Post Performance
The Post Performance view in Statusbrew’s Planner offers a fast way to review how individual posts are performing across your connected social networks. It’s ideal for quick checks or spotting top-performing content at a glance.
For deeper insights—such as trends, comparisons, or aggregated metrics across profiles—you’ll want to head into our Reports section.
Statusbrew pulls in performance data for posts sent through the platform, as well as posts published outside of Statusbrew. However, this only applies to content posted from your own connected profiles. Due to API limitations, Statusbrew cannot pull metrics for content posted by another account, even if your profile is tagged in it.
For example, if a collaborator posts from their own Instagram account and tags your brand, that data won't appear in Statusbrew. Reports If your brand posts the content and tags the collaborator, the data will be available.
Post Performance reports are available in Standard, Premium & Enterprise Plans. See full feature comparison of Statusbrew here.
How To Access The Post Performance View?
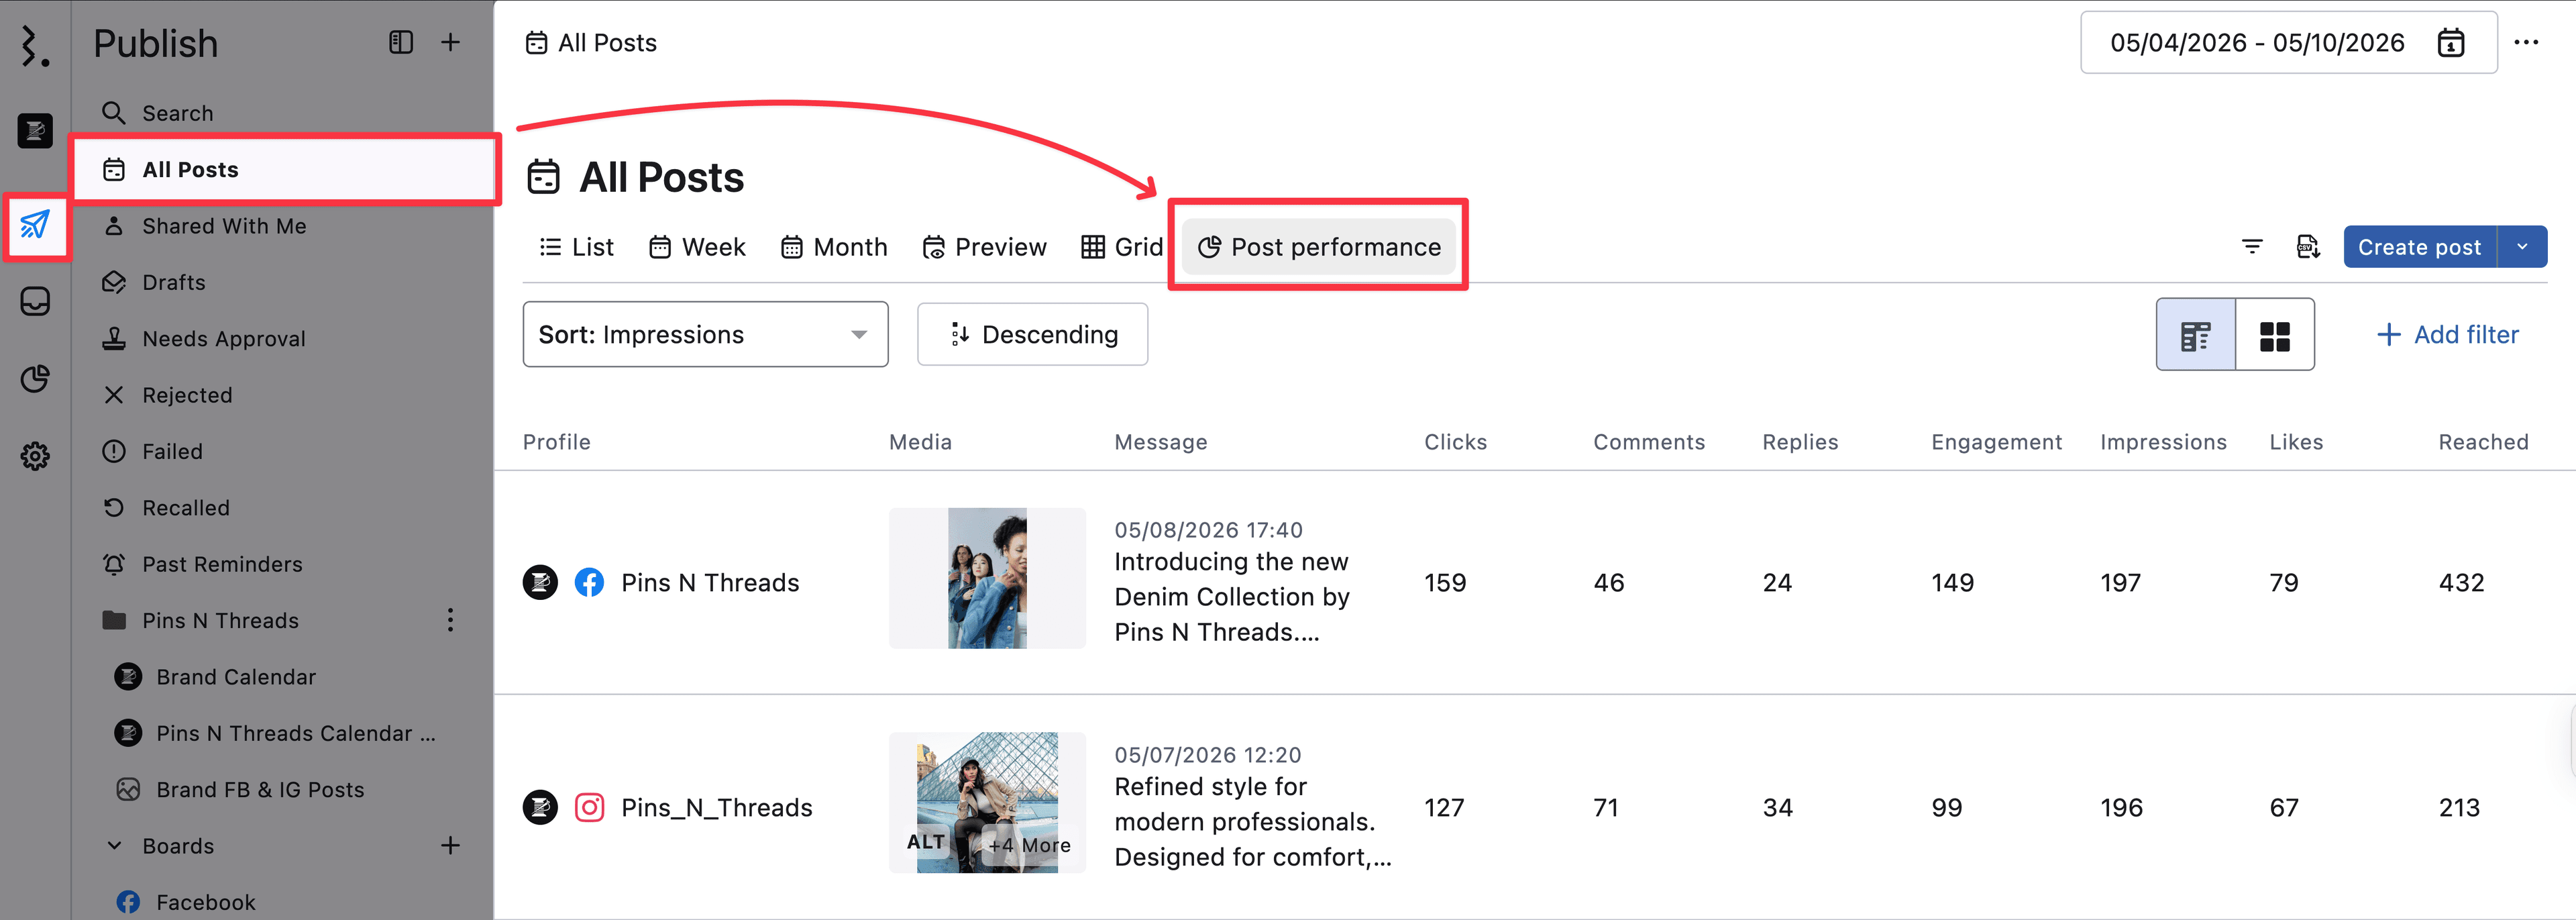
Go to Publish and select Post performance from the top.
Or
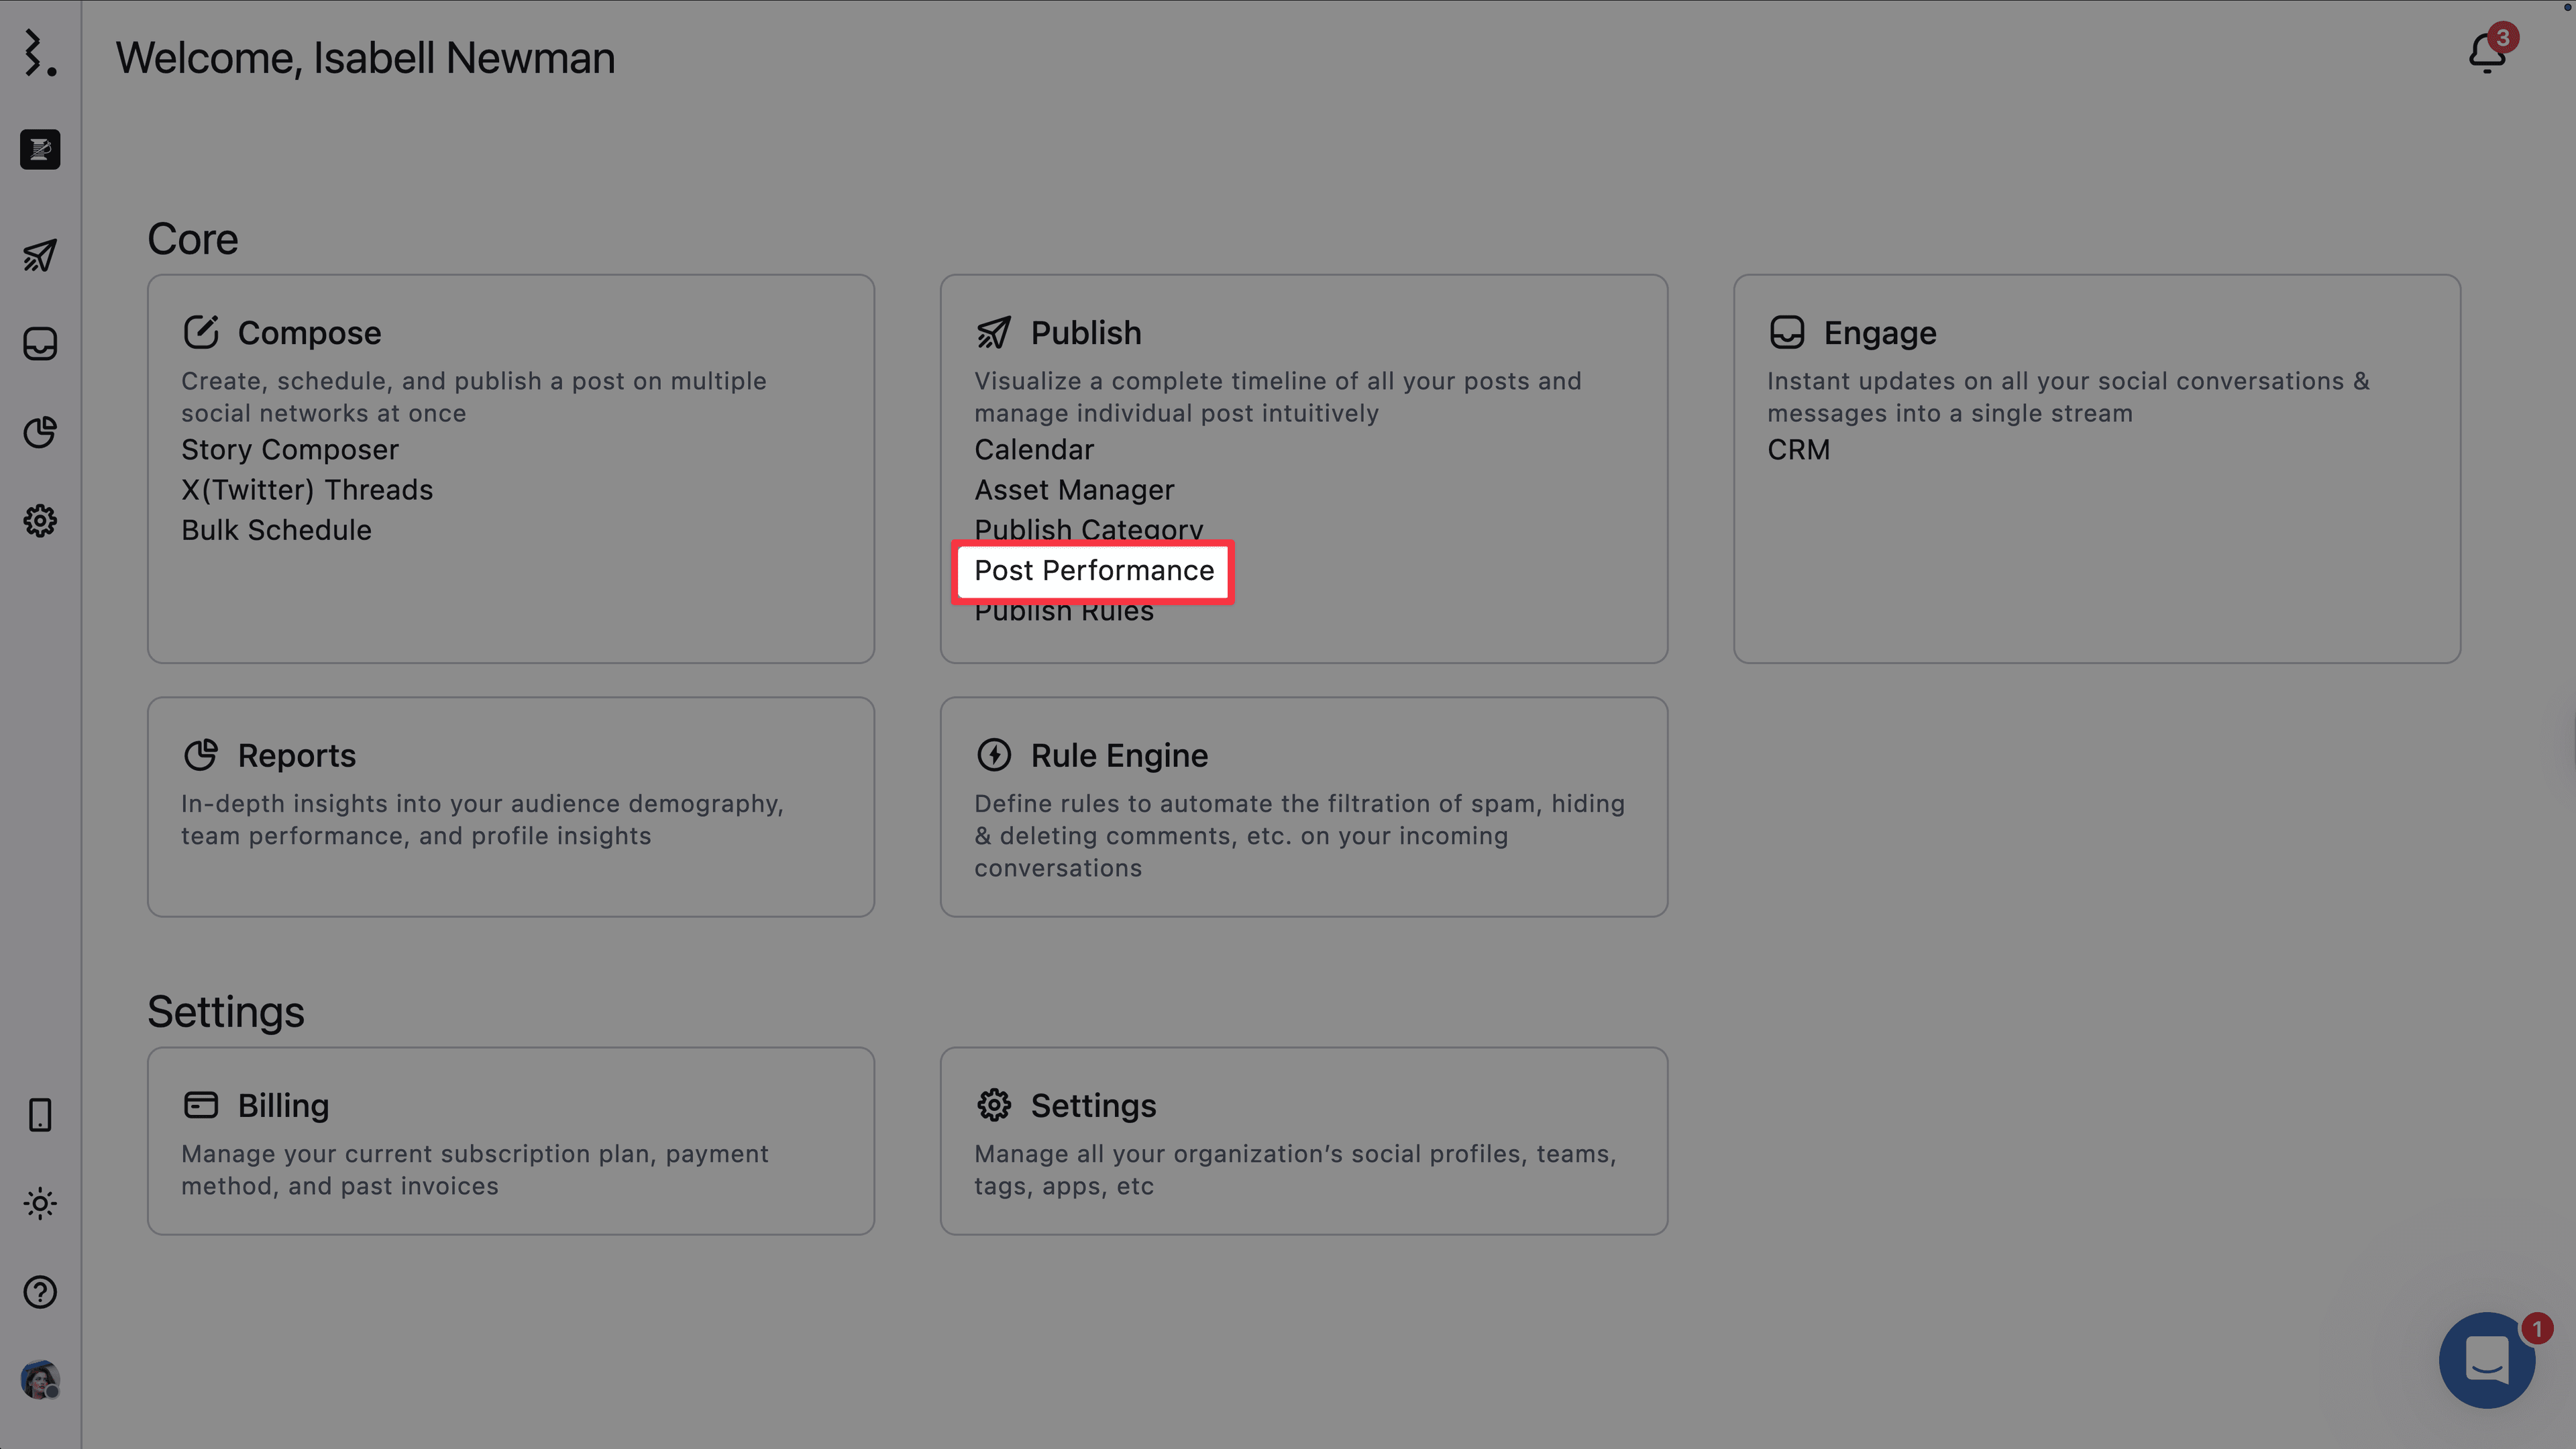
Select Post performance in the Publish section of the Statusbrew dashboard.
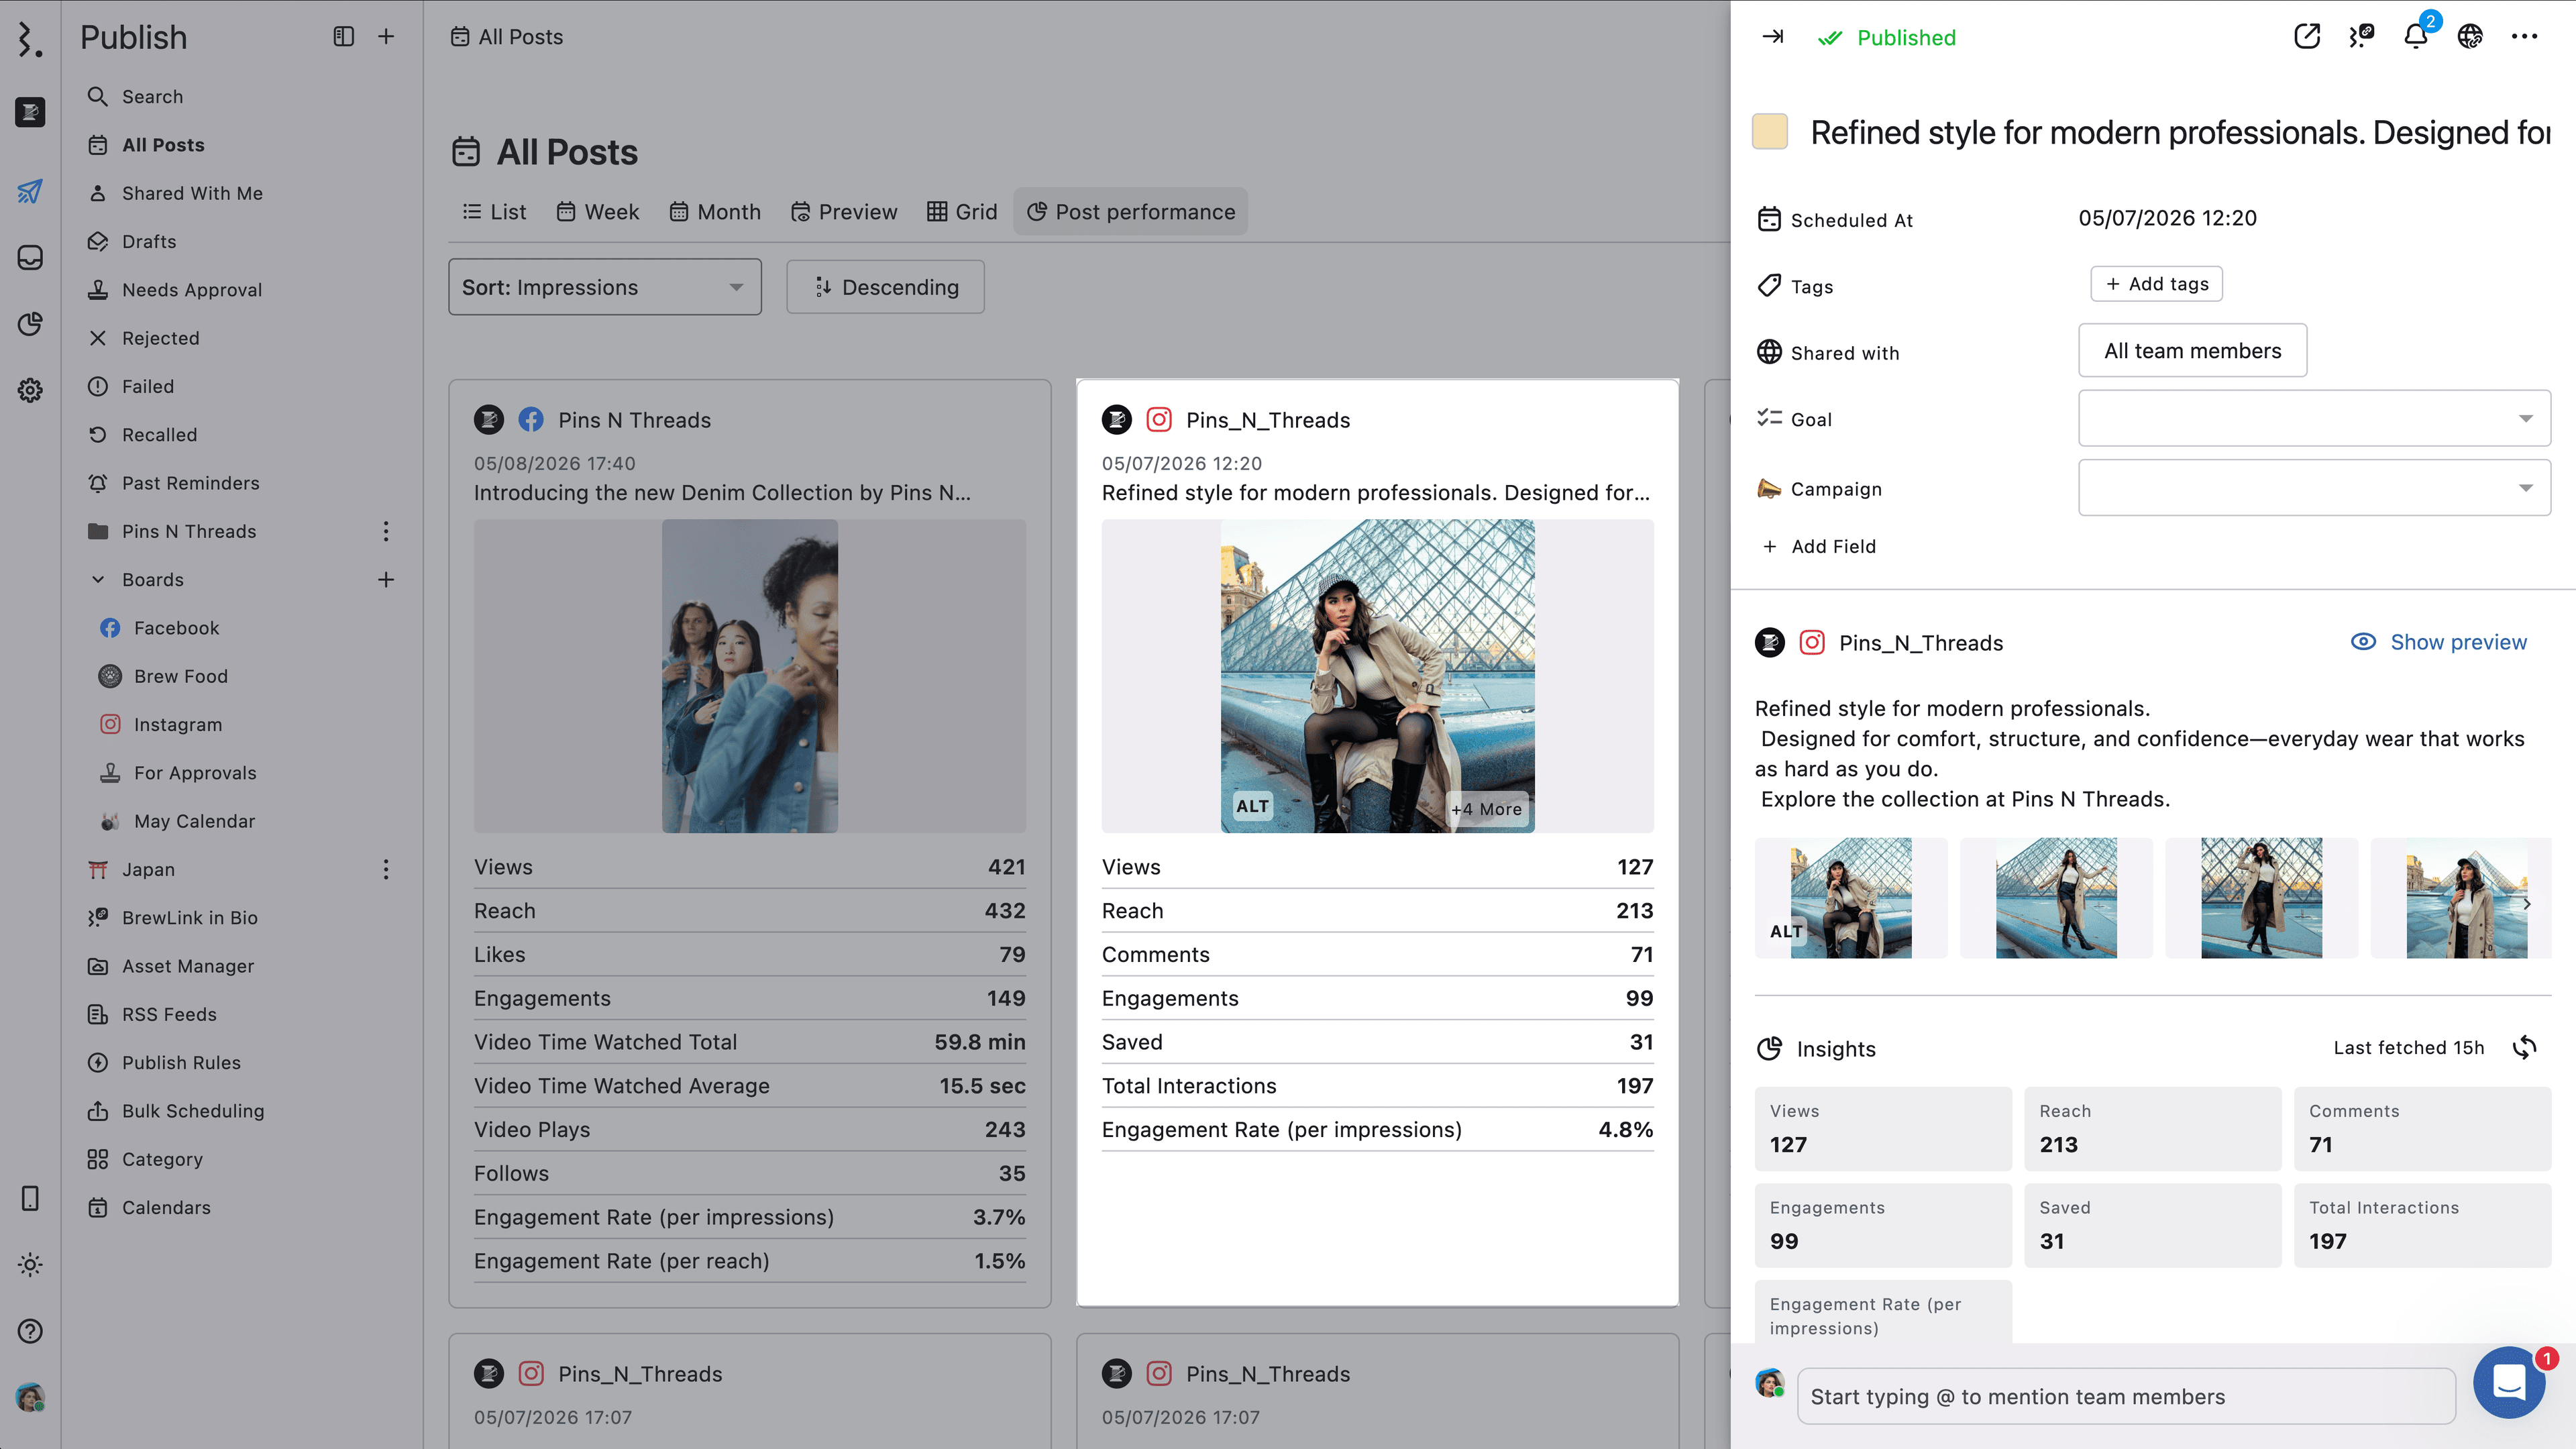
Clicking on any post in the Post performance view will open the Post Detail view.
Customizing The View
You can use the Planners filters to customize the posts whose data you see in the Post Performance view.
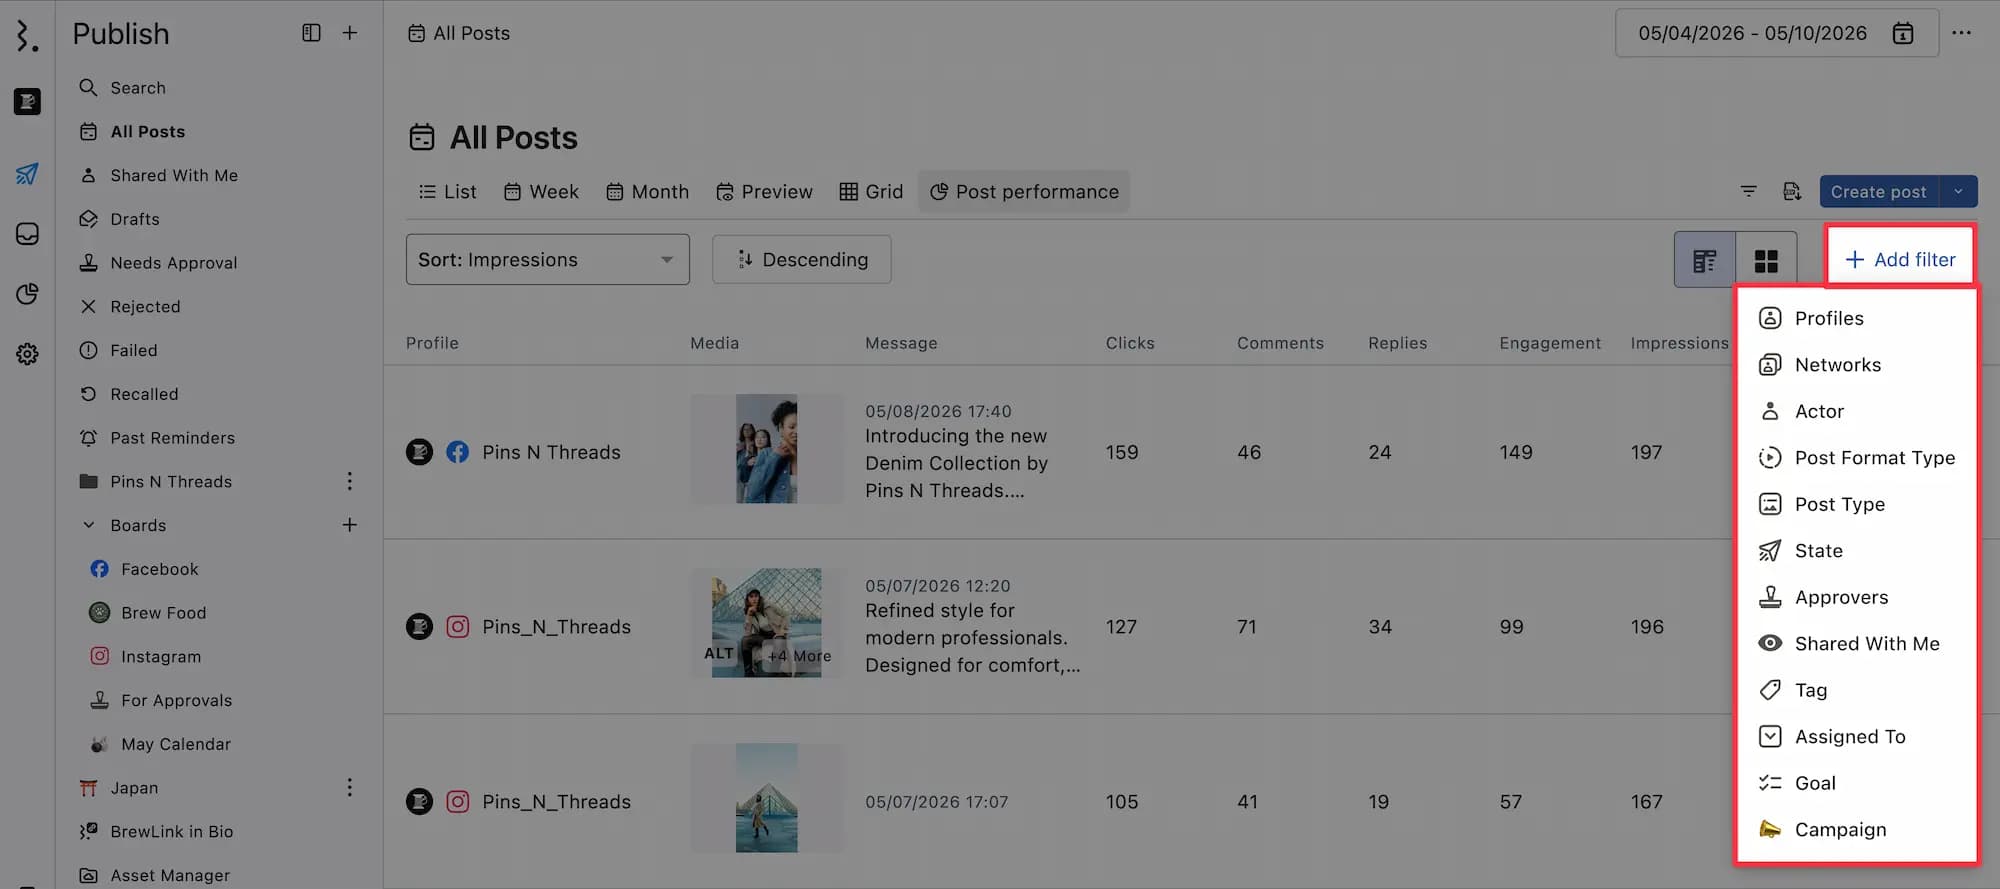
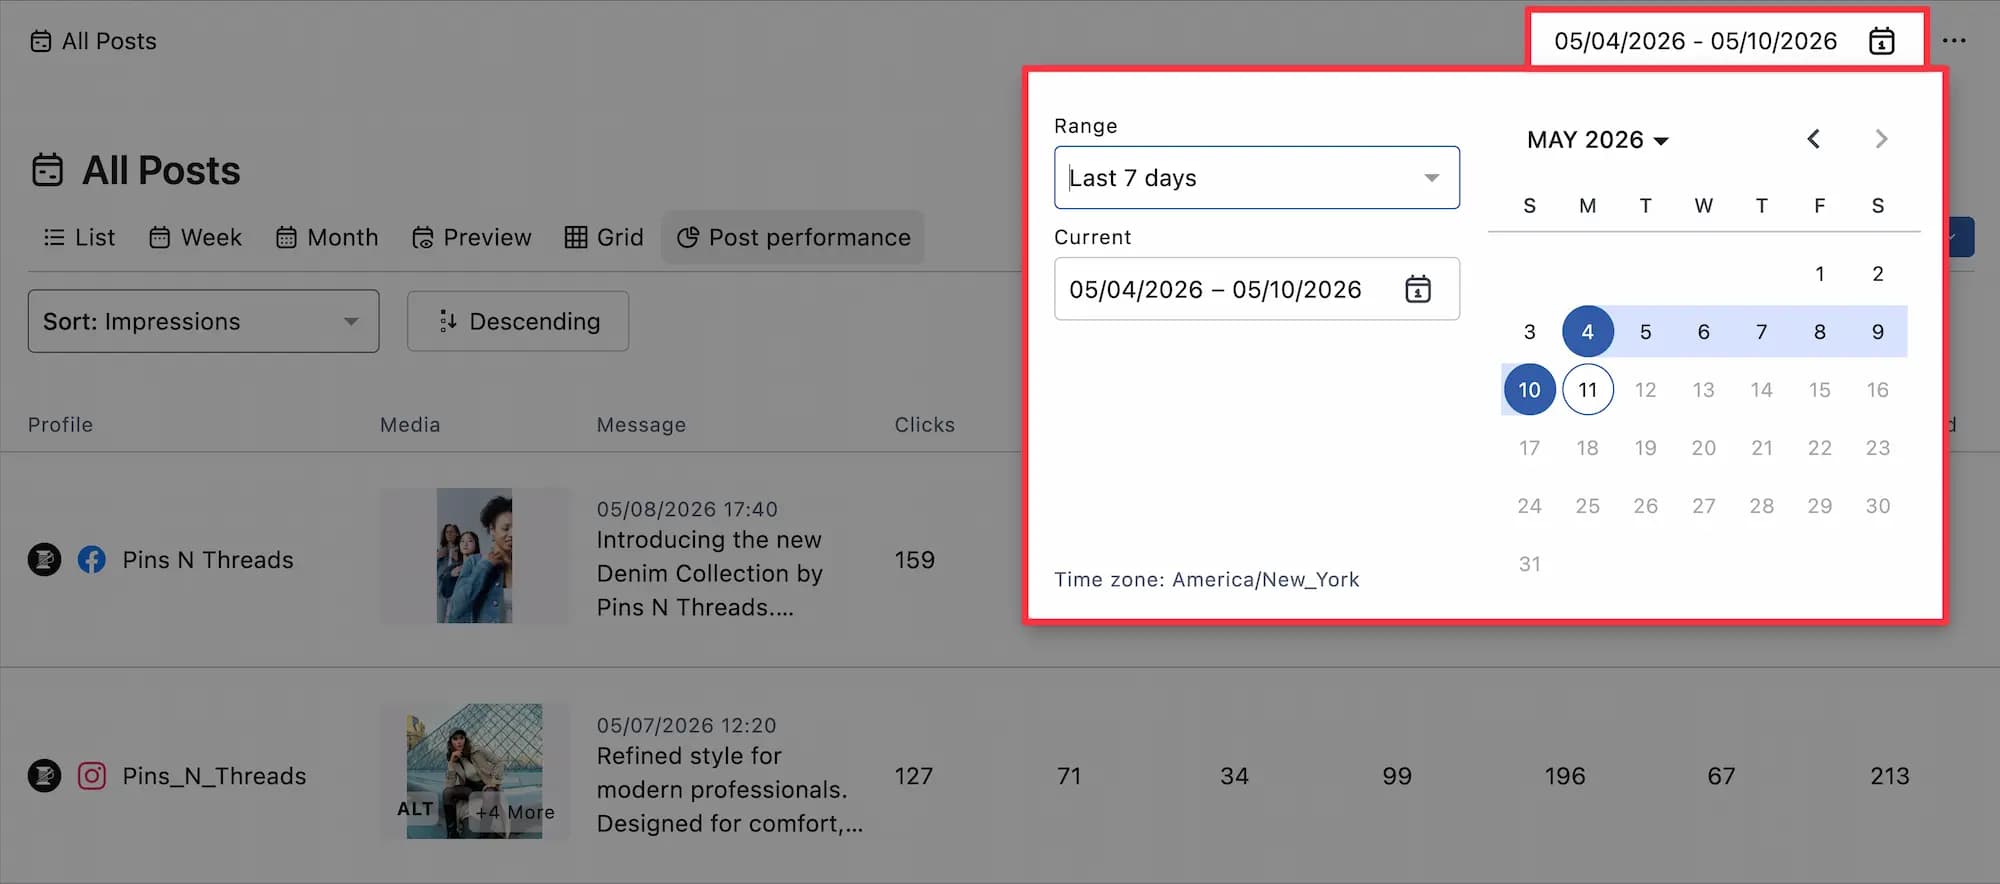
You can also customize the date range by clicking the Date Range box in the top left of the view.
You can also sort the posts by metric data and published date. Then, click on the Ascending or Descending arrows next to the Date Range box to define the order.
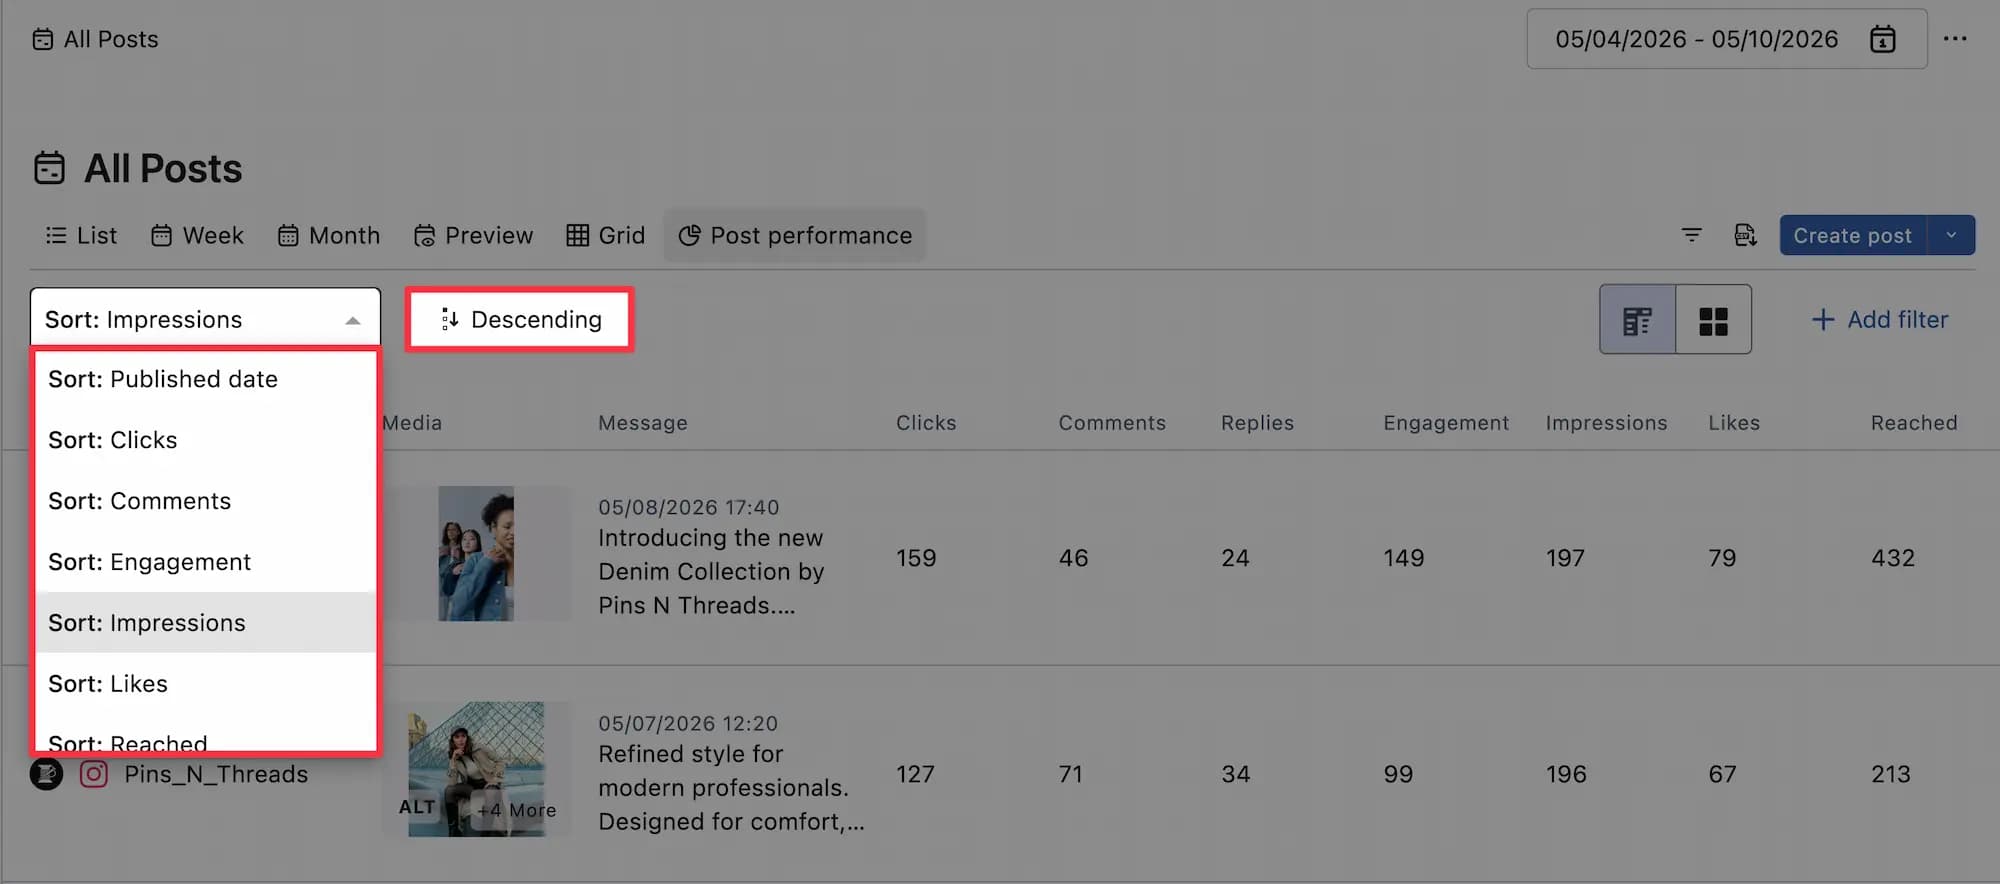
🔁 The sort order applies to the selected metric/published date only. For example, if you choose Sort: Impressions and set the order to Descending, posts with the most impressions will appear first.
View Options
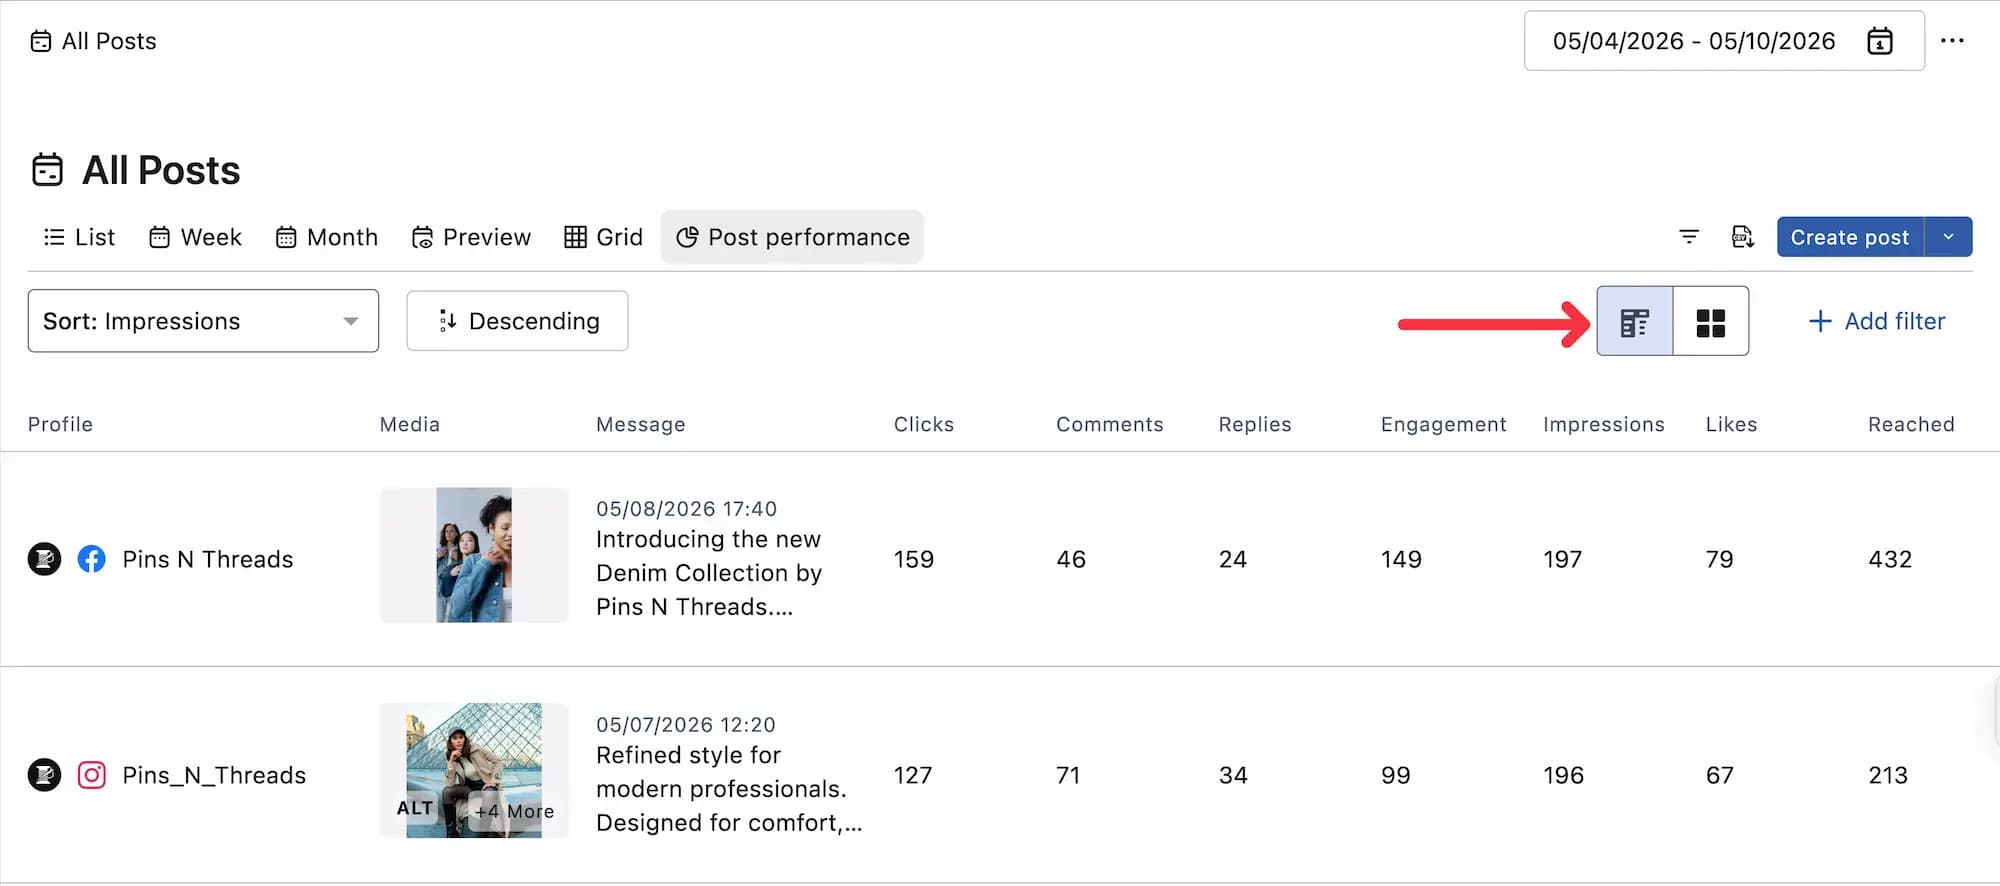
You have two options for viewing the data in your Post Performance view:
List View: Displays a row for each published post, along with key metrics that help you evaluate how that content performed
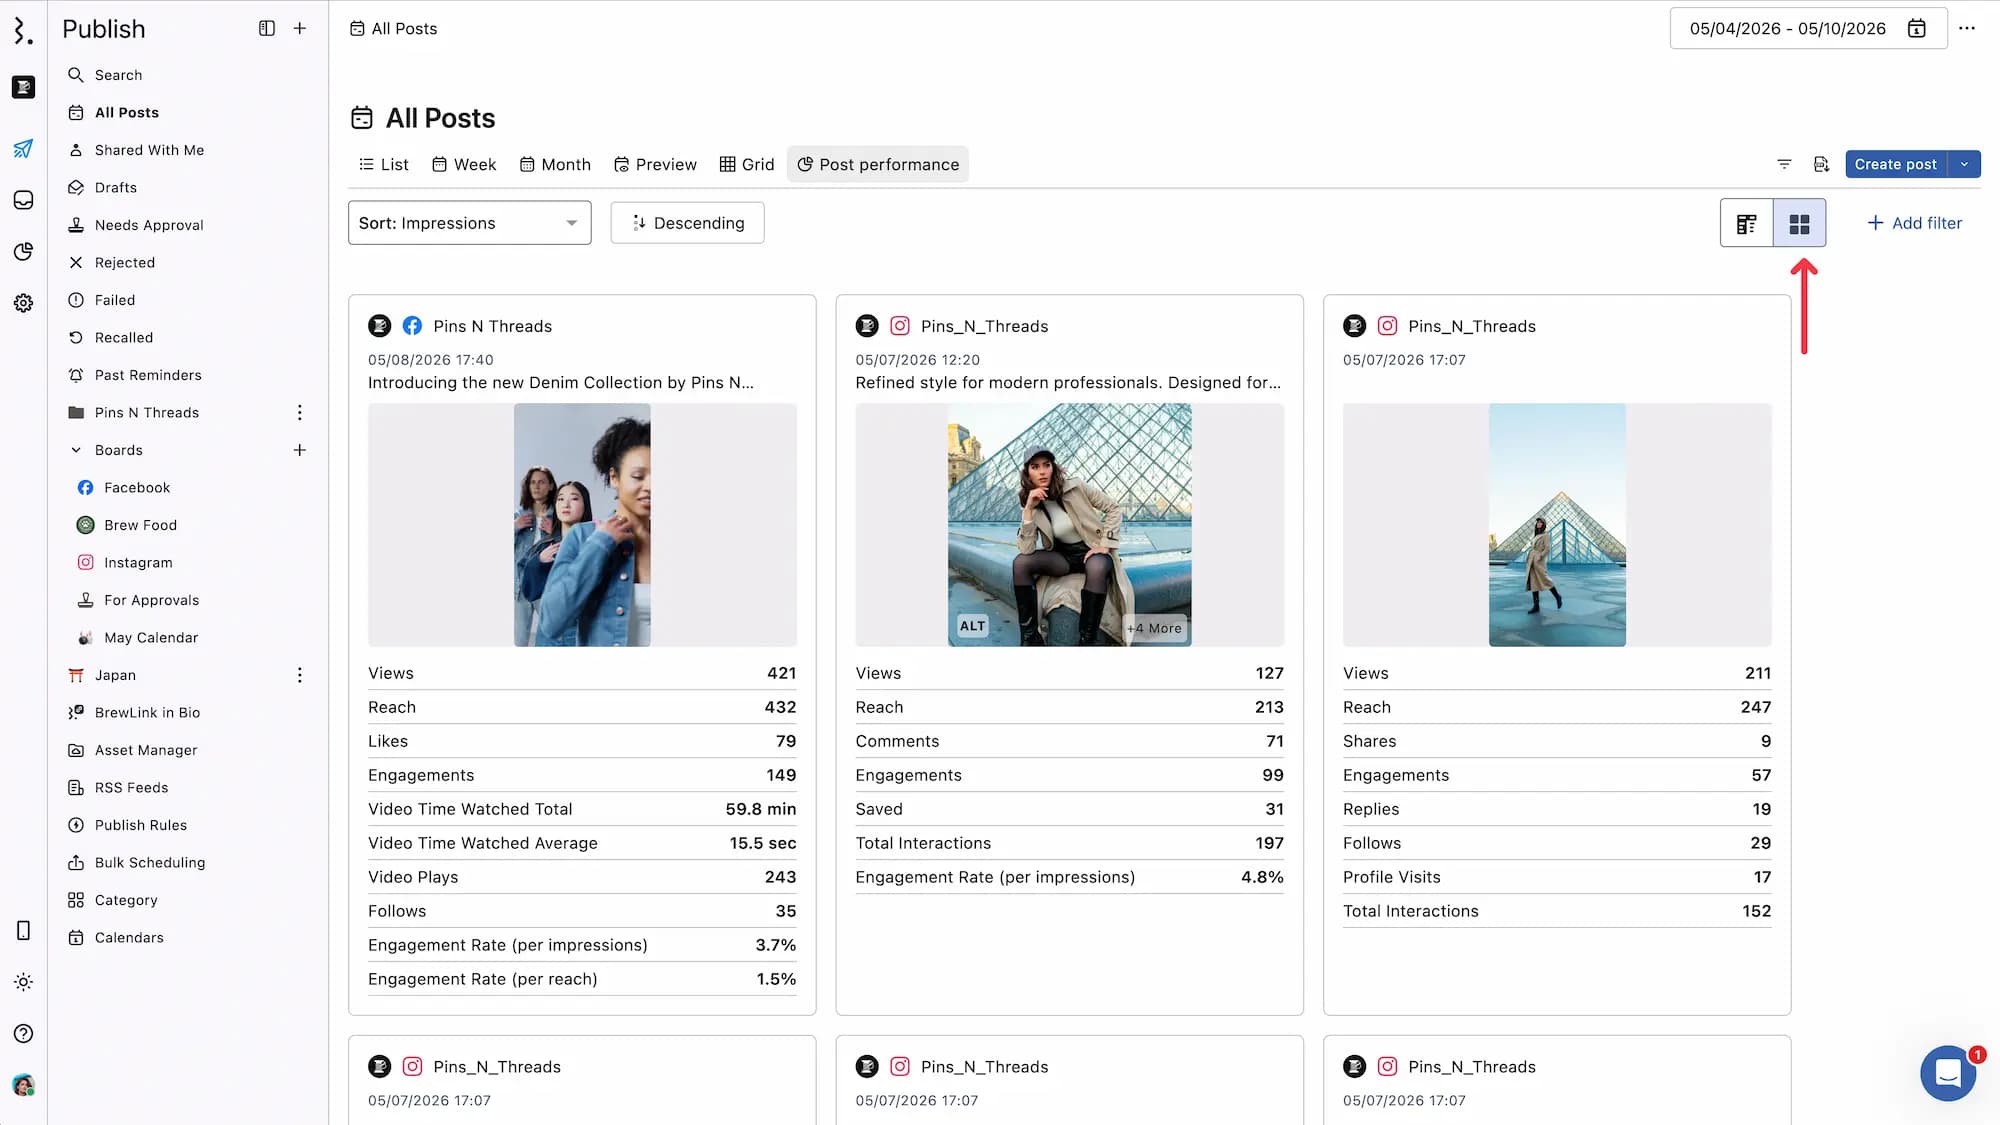
Card View: Provides a visually post-by-post summary to help you analyze individual post performance. Each card acts as a standalone performance report for a specific post.
Understanding View
Here's a breakdown of every column shown in this view:
Profile: Shows the social media profile name and platform where the post was published. Each entry includes the profile picture, platform icon, and profile name.
Media: Displays the thumbnail of the media used in the post—images, videos, carousels, or link previews. If it's a multi-image post, a “+n More” (n=number of additional media assets) tag appears to indicate additional assets. Clicking on any media will open the media in full-screen view, and clicking on the link preview will open the link in a new tab.
Message: Shows the caption or text content of the post along with the date and time it was published.
Clicks: The total number of times users clicked on your posts.
Facebook & X (Twitter): Only link clicks are counted.
For Facebook Reels: Counts clicks anywhere on the post.
LinkedIn: The number of unique clicks on your content, company name, or logo by a signed-in member. This excludes reposts, reactions, and comments. Multiple clicks on a document by the same user are counted as one click.
Comments: The number of comments received on your posts.
Engagement: The total number of engagements across your posts.
Note: Engagement is calculated as the sum of: Likes + Comments + Replies + Shares + Saves + Clicks + Reposts + Quoted Posts + Story Replies.
Impressions: The total number of times your posts were displayed to users during the selected time period.
Instagram, YouTube: Impressions are the same as views.
TikTok: Impressions are the same as video views
Note: For Facebook Reels Plays = Impressions
Likes: The number of likes or reactions received on your post.
Reached: The total number of unique people who saw your posts.
YouTube, Threads: Reach is the same as views.
X: Reach is the same as impressions.
Saved: The number of times users saved your posts.
Video Views: The total number of times users viewed your videos.
Facebook: A view is counted when a video plays for at least 3 seconds (or its full length if shorter). Replay time within the same session is excluded.
Instagram: Video View is same as view
LinkedIn: A view is counted when a video plays for at least 3 seconds.
TikTok: A view is counted when playback starts. If a user swipes away and then returns, it counts as a new view.
X: The number of times a video in this post has been viewed (including views happened in reposts and quoted posts).
YouTube: The total number of times a video was viewed.
Note: Facebook Reels, doesn’t provide a native Video Views metric, we substitute it with Video Plays.
Exporting The View
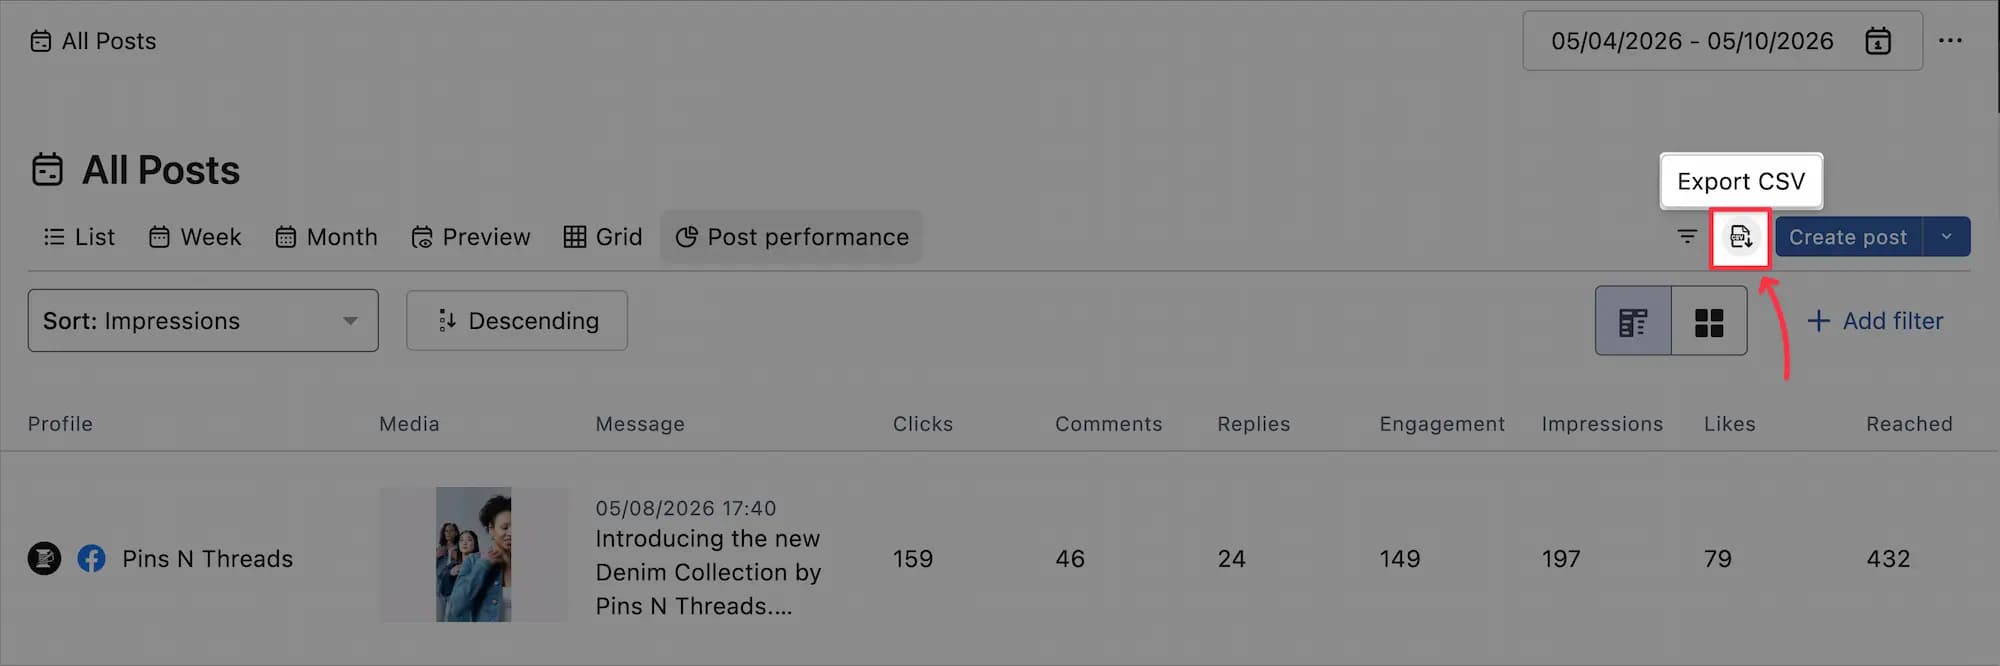
You can export and share the Post Performance view with your stakeholders as a report to show the impact of your social posts. You can export this view as a CSV to share. Any filters you set appear in your CSV export.
To export the view, select (More options) from the top right and select Export CSV.
The columns included in this exported CSV file are:
Channel: The social profile that published the post.
Network: The network the post was published to.
Content: The caption or text content of the post
Media URL: The direct link to the media attached to the post.
Created At: The date and time when the post was published.
Post Type: The categorization of the post. This can be Video, Image etc.
Tags: A list of the tags applied to the post in Statusbrew.
Clicks: The total number of times users clicked on your posts.
Facebook & X (Twitter): Only link clicks are counted.
For Facebook Reels: Counts clicks anywhere on the post.
LinkedIn: The number of unique clicks on your content, company name, or logo by a signed-in member. This excludes reposts, reactions, and comments. Multiple clicks on a document by the same user are counted as one click.
Comments: The number of comments received on your posts.
Likes: The number of likes or reactions received on your post.
Shares: The number of times users shared your posts.
X, Threads, Bluesky: Calculated as New Quotes + New Reposts.
Exit: The number of times users exited your stories.
Reach: The total number of unique people who saw your posts.
YouTube, Threads: Reach is the same as views.
X: Reach is the same as impressions.
Video Views: The total number of times users viewed your videos.
Facebook: A view is counted when a video plays for at least 3 seconds (or its full length if shorter). Replay time within the same session is excluded.
Instagram: Video View is same as view
LinkedIn: A view is counted when a video plays for at least 3 seconds.
TikTok: A view is counted when playback starts. If a user swipes away and then returns, it counts as a new view.
X: The number of times a video in this post has been viewed (including views happened in reposts and quoted posts).
YouTube: The total number of times a video was viewed.
Note: Facebook Reels, doesn’t provide a native Video Views metric, we substitute it with Video Plays.
Video Plays: The total number of times a Facebook Reel starts playing after an impression has been counted.
Defined as reel sessions with at least 1 millisecond of playtime, including replays.
Replays are counted only after the initial play of the reel within the same session. This metric is only available for Facebook Reels.
Instagram Saved: The number of times users saved your posts.
Permalink: The direct URL to the published post on the native social media platform.
FAQs
Can I pull all posts where my brand was tagged or mentioned, including posts not published from my own profiles?
It depends on what you mean by “tagged.”
In Statusbrew, Tags are labels you apply to organize your posts, conversations, campaigns, or reports. If you are asking about content tagged inside Statusbrew, you can filter your owned content using those Tags.
But if you mean posts where people tagged your brand, mentioned your handle, or included your brand in their content, that is different. Those are mentions or tagged media from the social network, not Statusbrew Tags.
Statusbrew can help you track mentions where the network API makes them available. However, Statusbrew cannot pull full performance data for content that does not belong to your connected profiles. For example, if another account posts about your brand or tags your brand, Statusbrew may be able to show the mention depending on API support, but it cannot track full post performance like reach, impressions, clicks, or engagement rate for that person’s post.
To track performance in reports, the content must usually be owned media from a connected profile.
So, in short:
Statusbrew Tags = labels added inside Statusbrew for organizing your own content.
Tagged or mentioned brand content = posts from other users where your brand was mentioned or tagged.
Performance reporting = available mainly for owned content from connected profiles.