Understanding Statusbrew Reports
Statusbrew makes it easy to track & analyze your social media performance.
Let's explore all the ways you can use Reports.
250+ metrics, ready-to-use templates, and a widget library can help create a wide range of reports, including competitor analysis, Paid vs. Organic reports, customer service analysis, etc.
Once your reports are set up, easily share live dashboards with clients or teams using Shared Links or export them as PDFs in grid or stack view.
You can even embed reports on webpages for seamless access.
This article highlights Report features rather than how to use them. If a feature interests you, check the linked articles in each section.
Let's get familiar with Statusbrew's analytics features and start creating reports right away.
What Are Reports?
Statusbrew's reports measure and visualize the performance of your social media accounts across various dimensions over a specific period.
Understanding how reports are structured will help you create reports that accurately reflect the data you need.
Report Components
The report consists of dashboards, widgets, and metrics, as shown in the figure below.
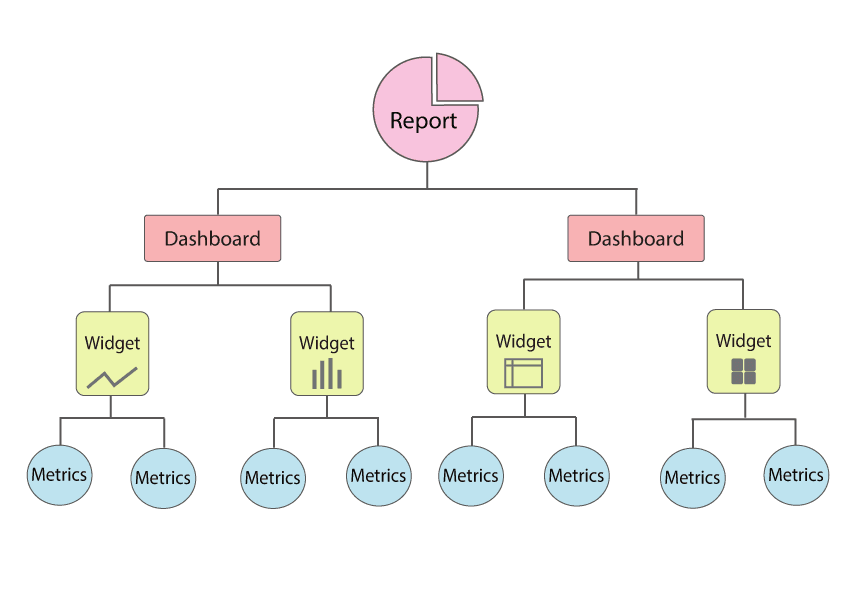
Plus, by combining visualizations, dimensions, filtering, and sorting, you can customize your reports to deliver the data you need.
Let's look at each element from top to bottom.
Dashboard
A dashboard is a reporting unit made up of one or more widgets, or, simply put, a report.
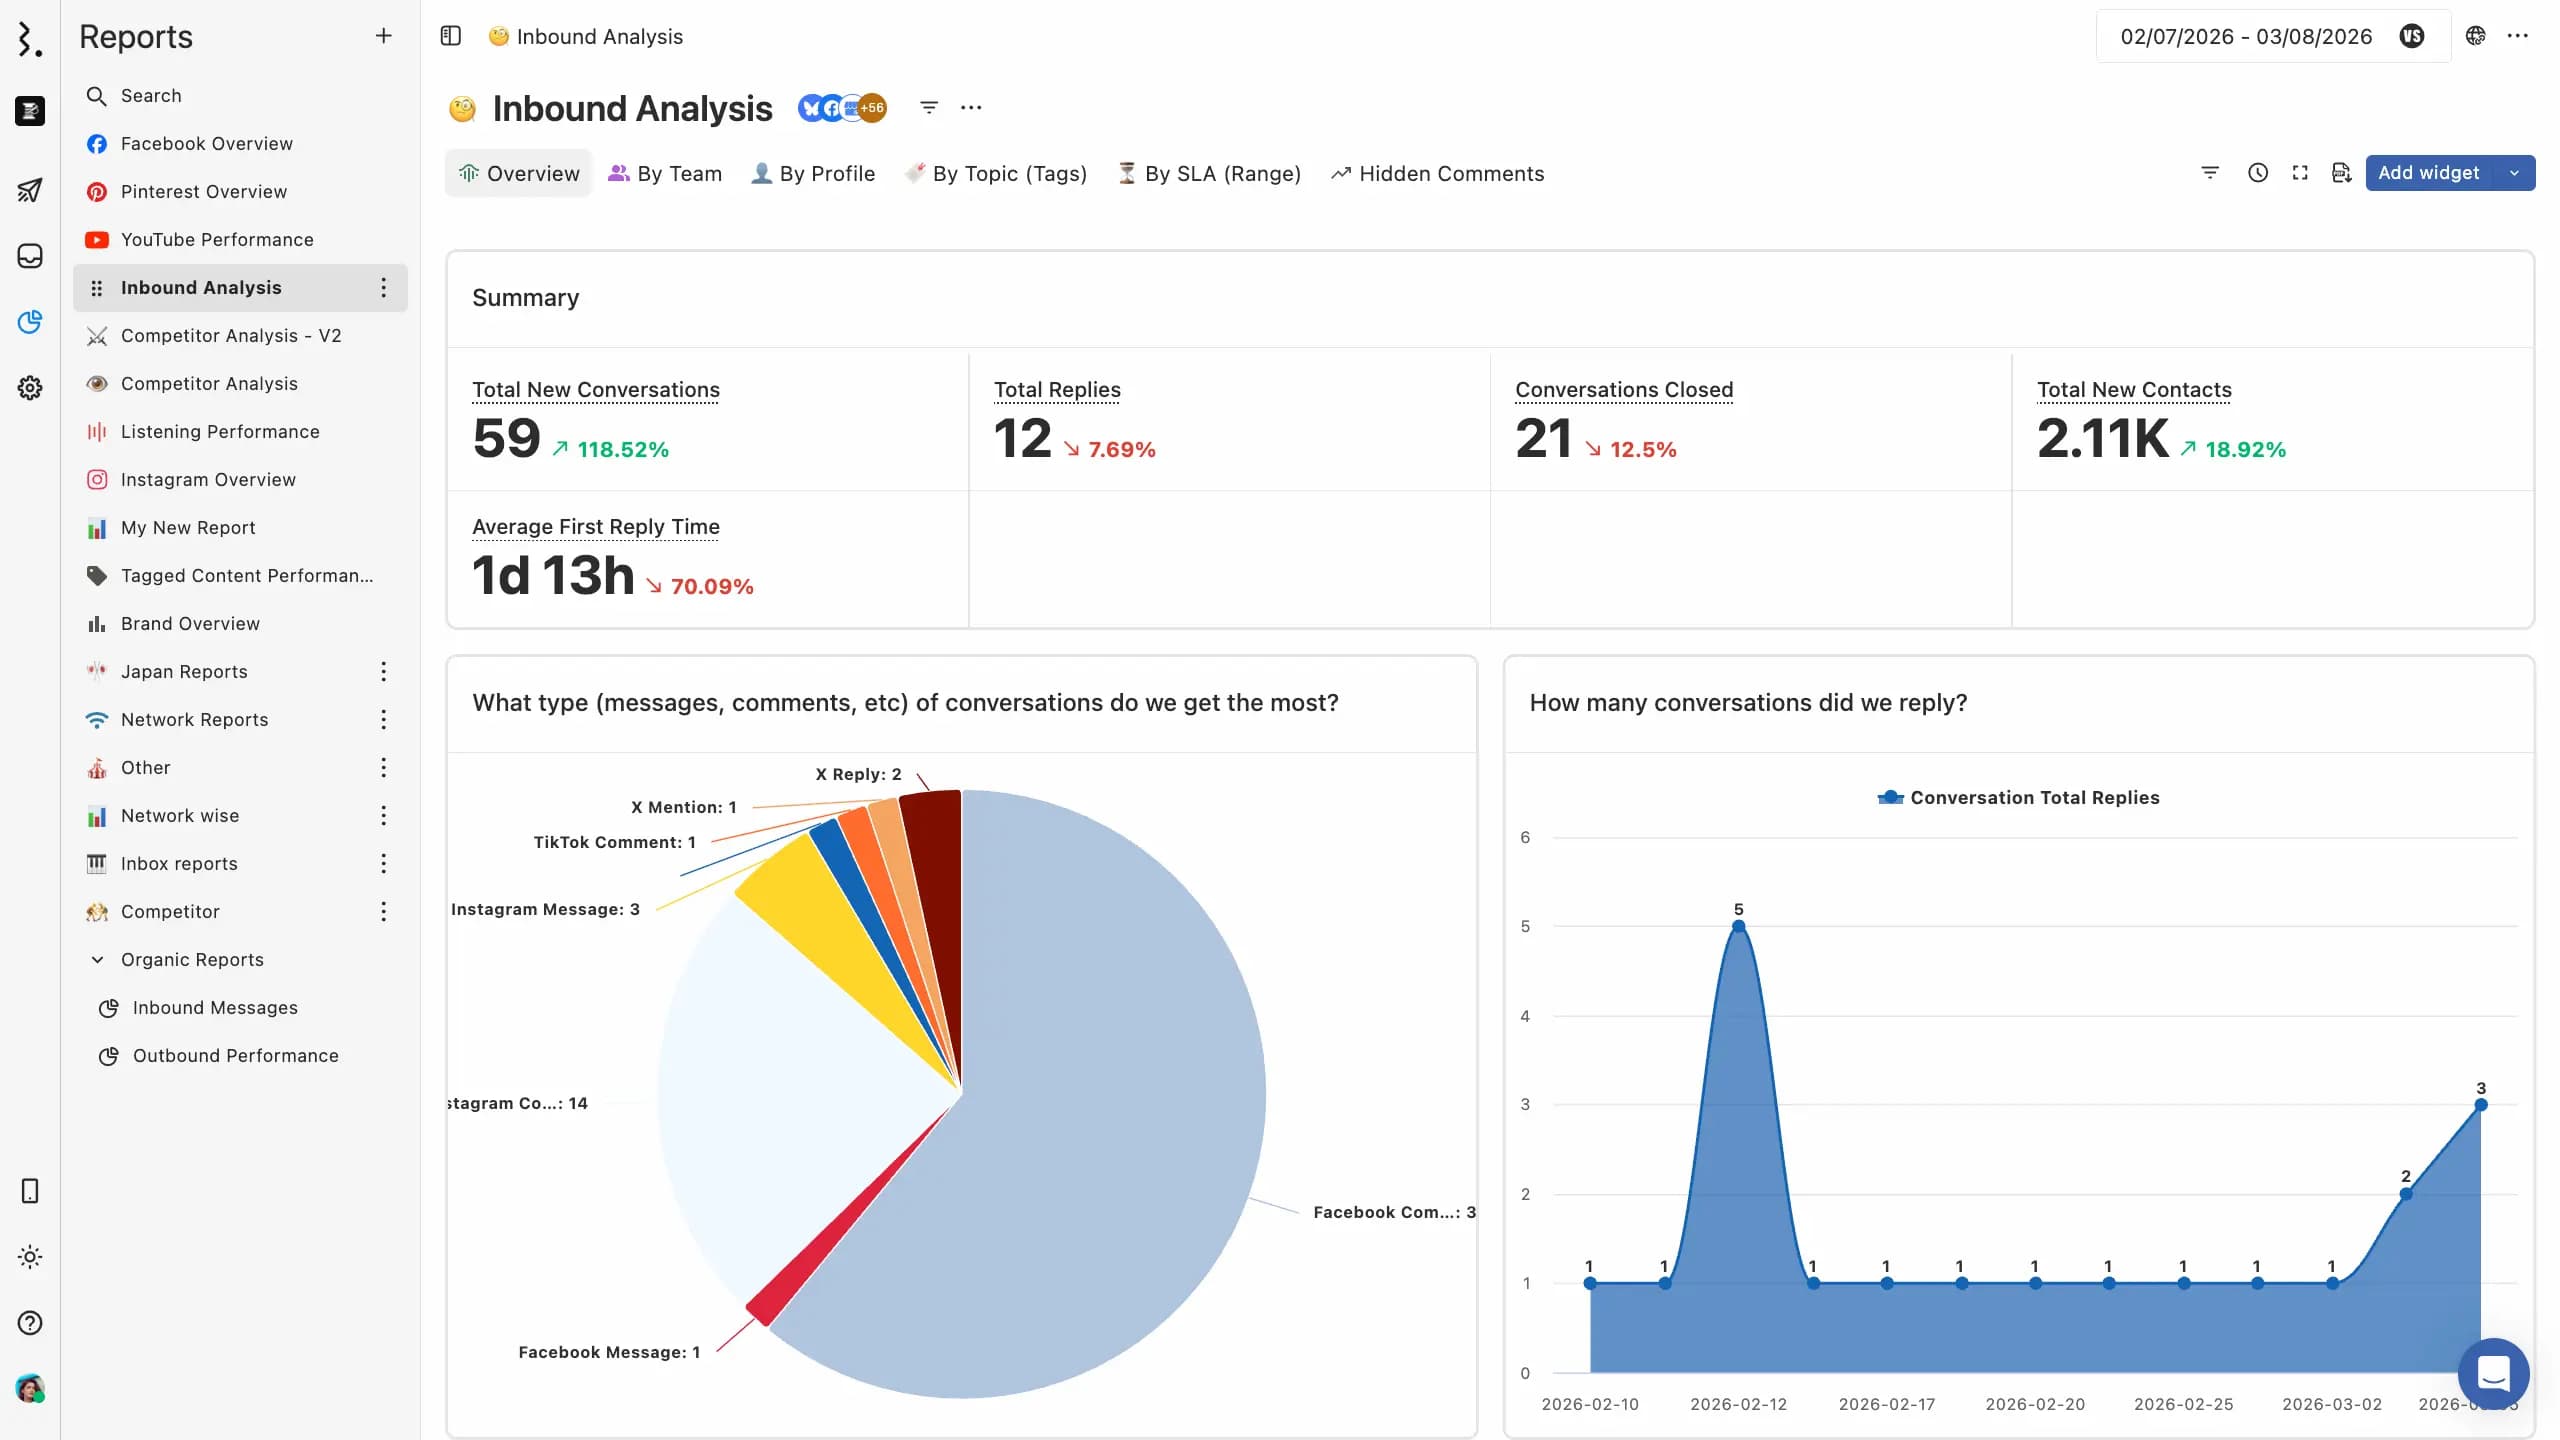
For example, a dashboard for Client A might have two widgets that display reach and follower counts, which are combined into a report.
When creating a new dashboard, you can choose one of the following methods:
Data updates automatically, and dashboards can be edited, duplicated, reverted, or exported as a PDF at any time.
Contact us if you need help setting up a high-performing reporting dashboard.
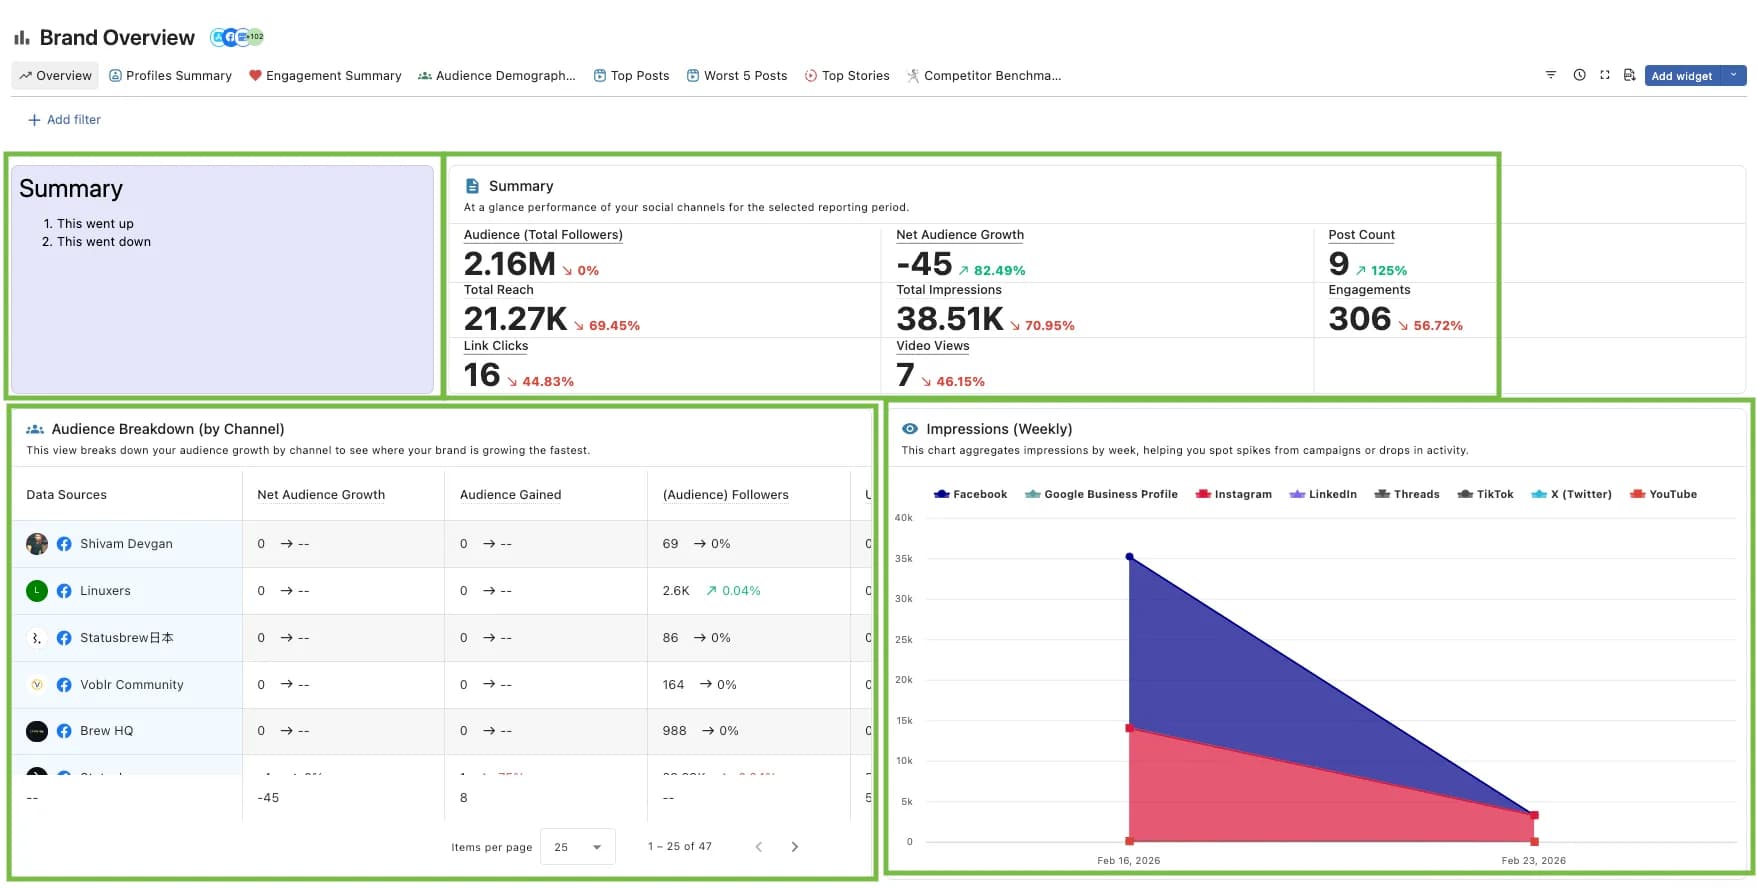
Widgets
A widget is a visual representation of one or more pieces of data.
For example, you could use a pie chart to color-code the number of followers, or use cards to display the top posts with the most reach or shares.
You can add as many widgets to your dashboard as you want.
The widget can be configured in detail.
Change visualizations: We offer 20+ types, including charts, tables, and heat maps.
Dimensions, filters, and sorting: You can add various elements to analyze your data more precisely (see below).
Drill down: If you want to perform a more detailed analysis, you can drill down by specifying a dimension.
Widgets can be duplicated, deleted, or downloaded in CSV or PNG format at any time.
Widget Library
You can directly add multiple widgets to your reports using our widget library or customize them to reflect totals, averages, and more.
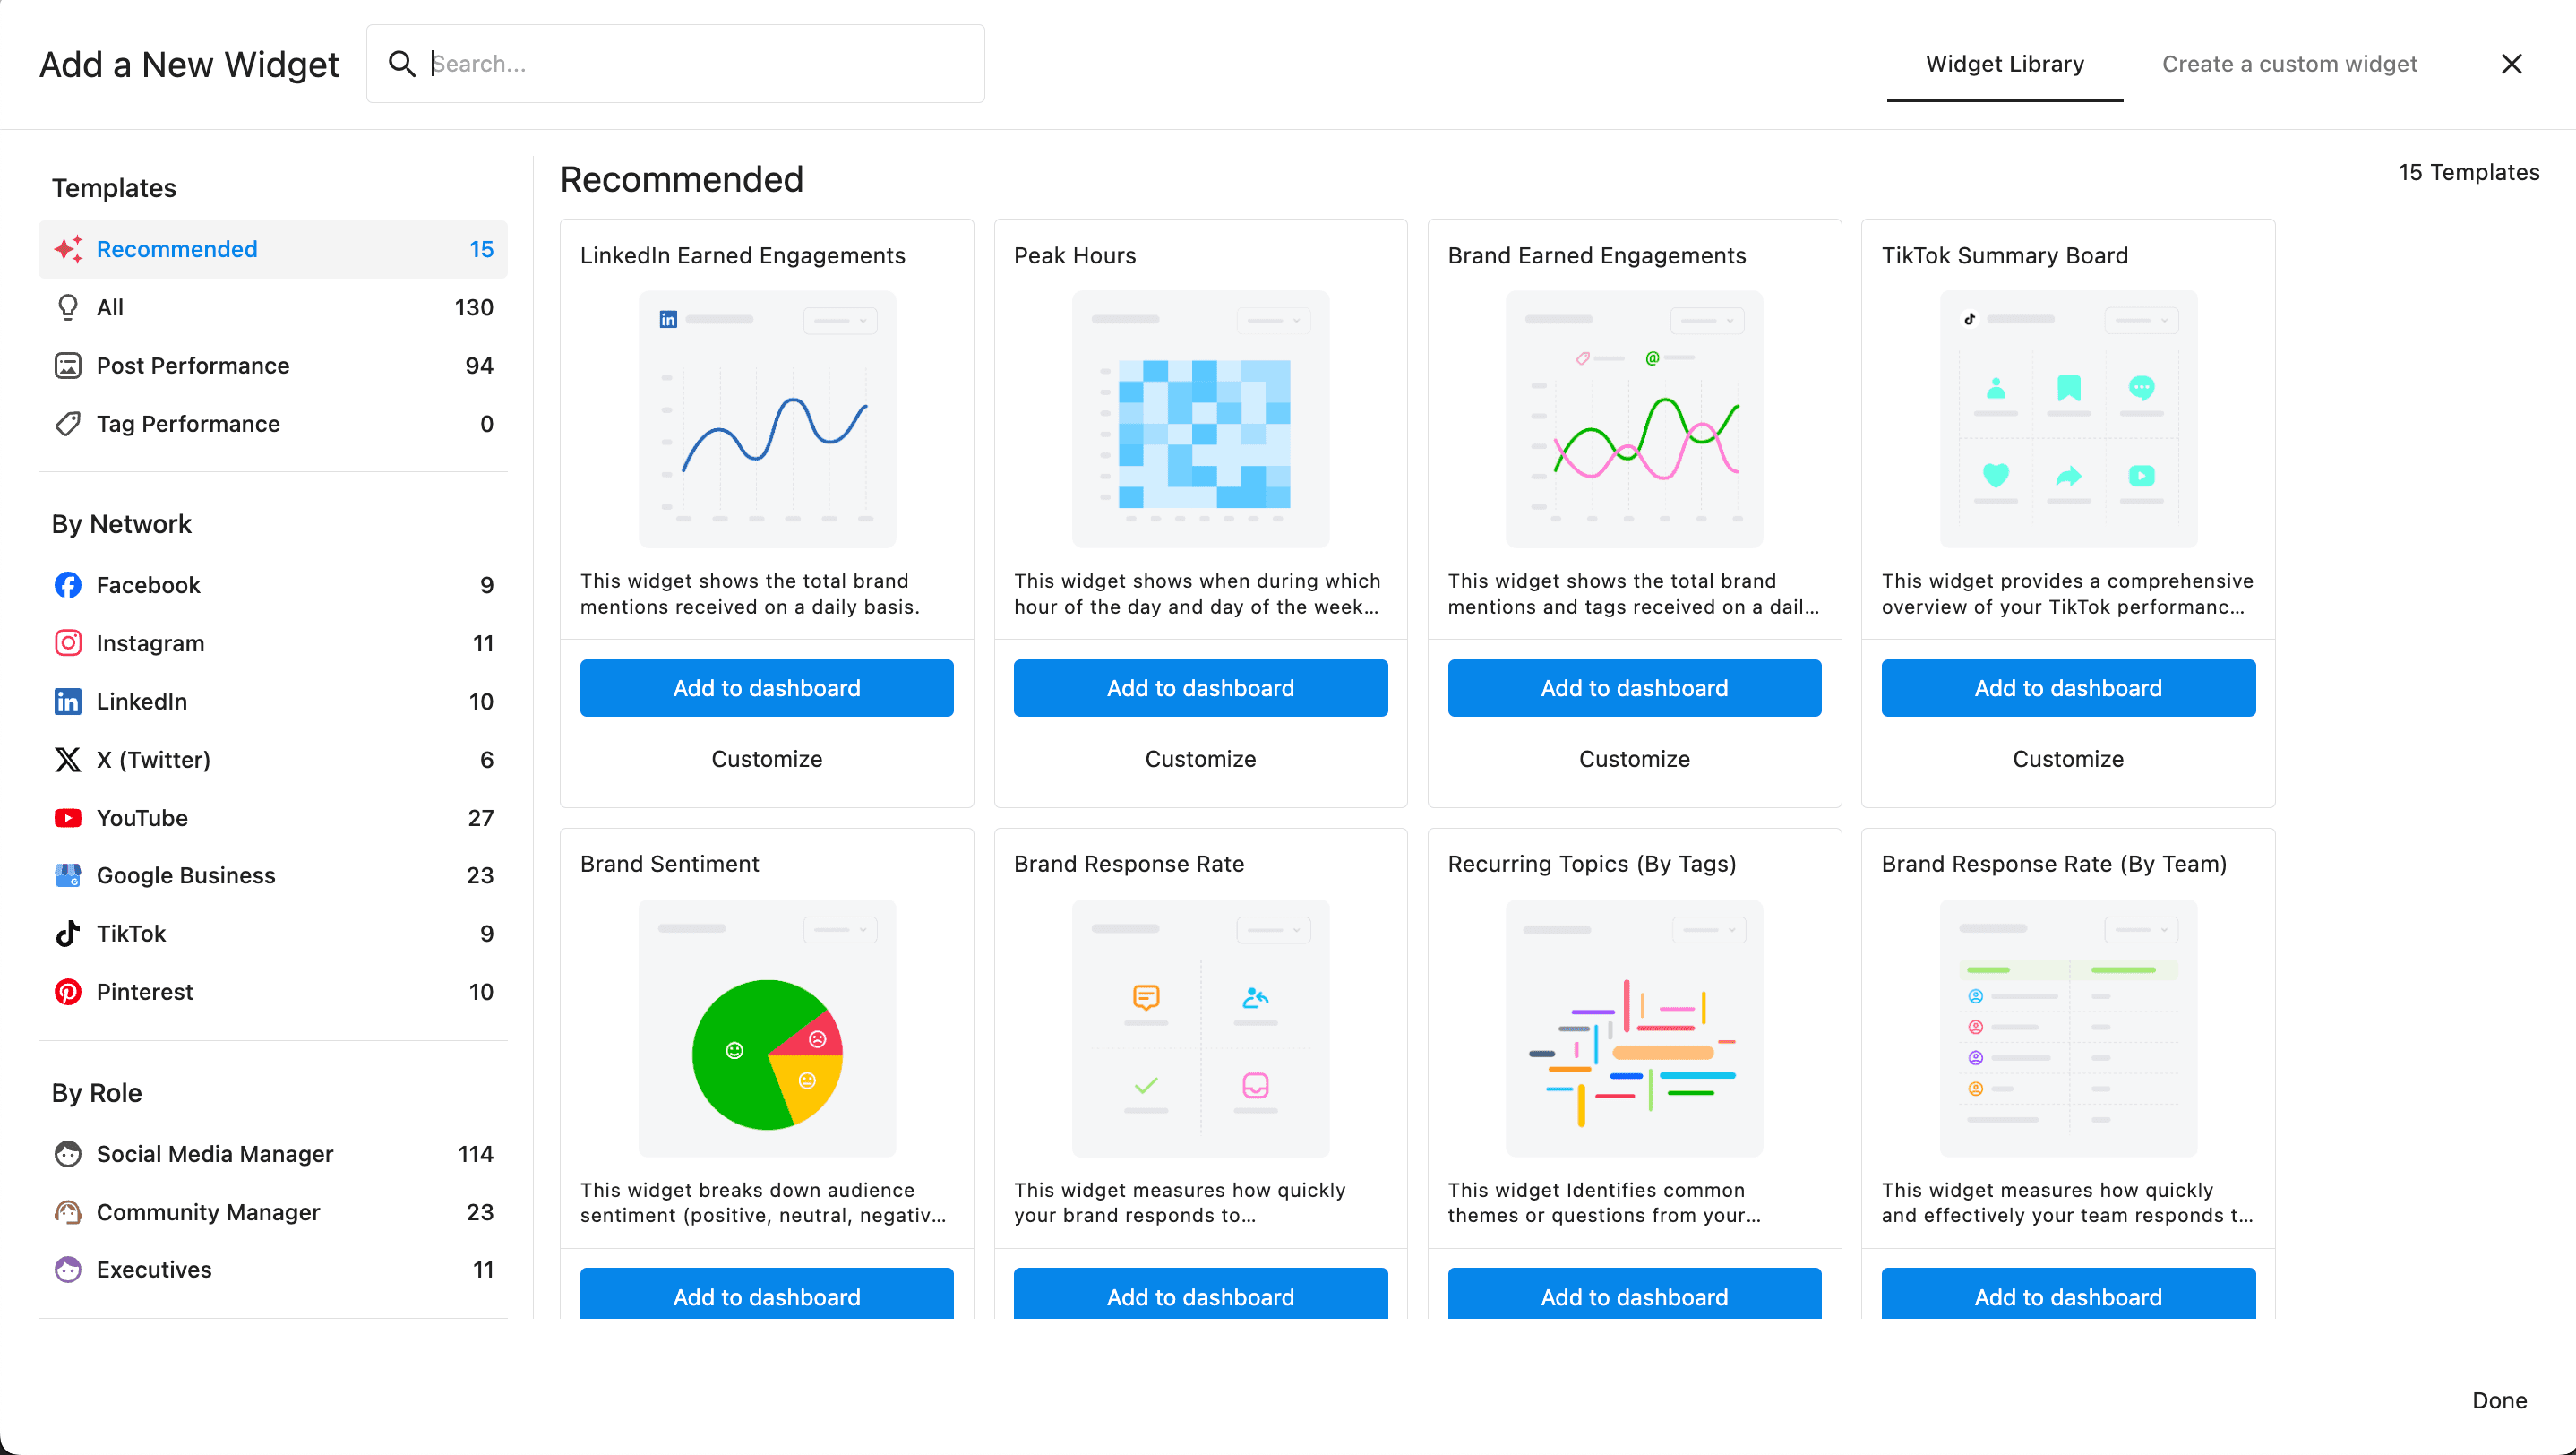
Learn More details about the widget
Metrics
Metrics are units of measurement used to evaluate performance.
Currently, Statusbrew offers over 250 metrics.
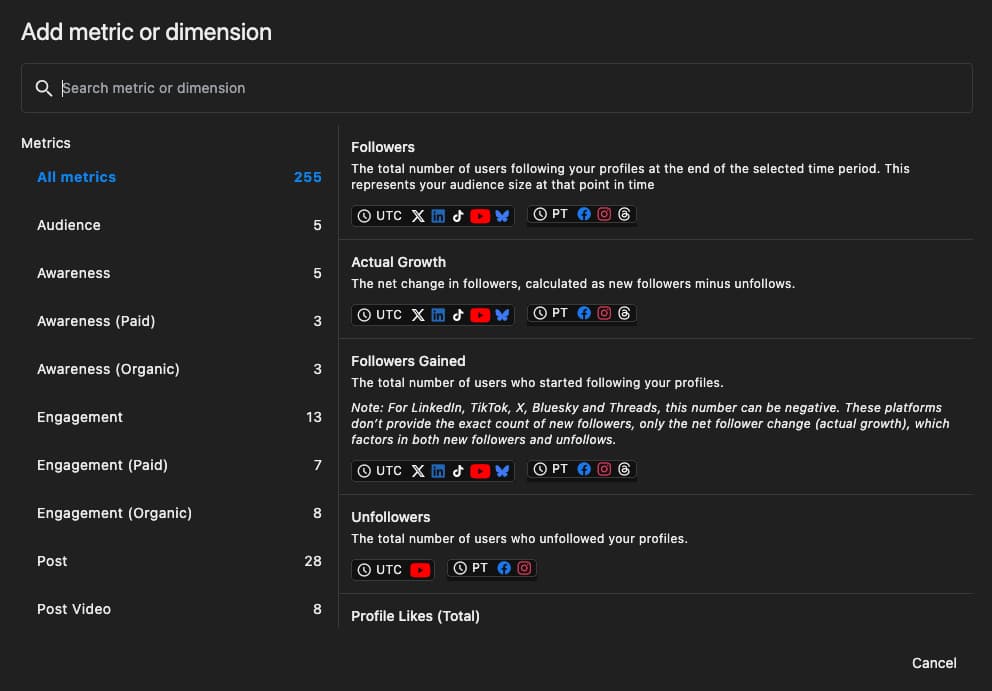
To measure the impact of your posts, social media uses metrics like reach and engagement, sometimes called "insights" or "KPIs (Key Performance Indicators)."
Metrics may have several versions depending on their nature.
🔍Profile-level and post-level metrics
Profile-level metrics: They measure the performance of your Statusbrew-connected account.
You can narrow your targeting by specific networks (Facebook, TikTok, etc.) or data sources
Values are aggregated over a specified period (reporting period).
Example: Impressions, Competitor Profile Engagements
Note: You can't track performance per post with Profile-level metrics.
Post-level metrics: measure the performance of each post.
You can track performance across networks and data sources, as well as post-by-post.
The cumulative total (lifetime total) for a given period since the post was published is displayed.
Example: Post impressions, Competitor post engagements
🔍 Paid, organic, combined
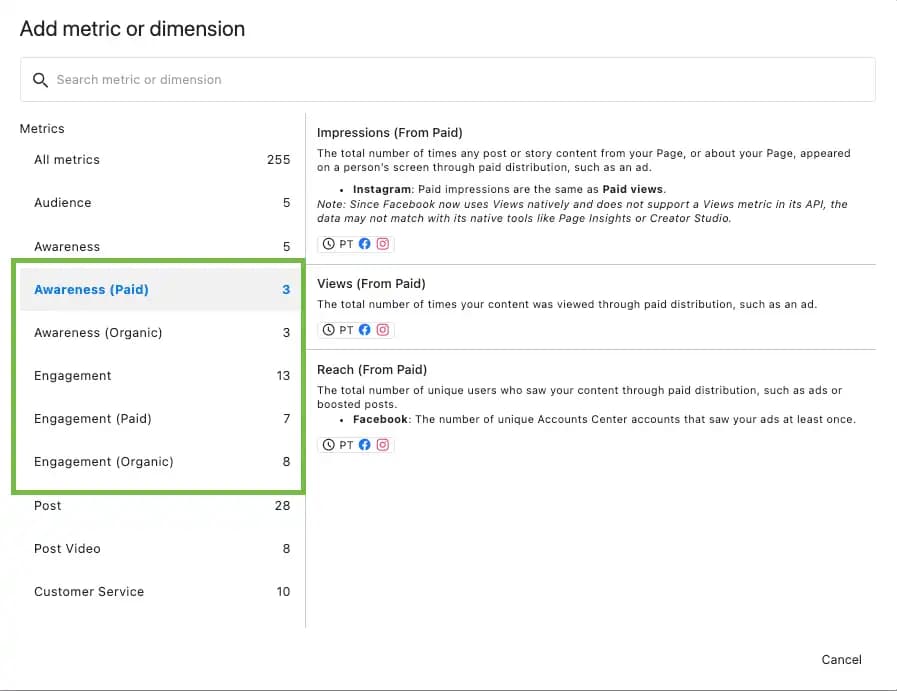
Some awareness and engagement metrics come in three varieties:
Paid metrics: Shows data for promoted posts only (metrics with (Paid) in the name, e.g., Shares (Paid))
Organic metrics: Shows data only for posts that are not promoted (metrics with (organic) in the name, e.g., Shares (organic))
Combined Paid + Organic: In this case, the breakdown is unknown. Please check the description of each metric to see if it is a combined metric.
✒Total /Average
Some metrics allow you to choose between a sum and an average.
Total: Displays the total value of all data in the set
Average: Displays the average value of all data in the set
Other options
There are more options available for deeper analysis.
Dimension
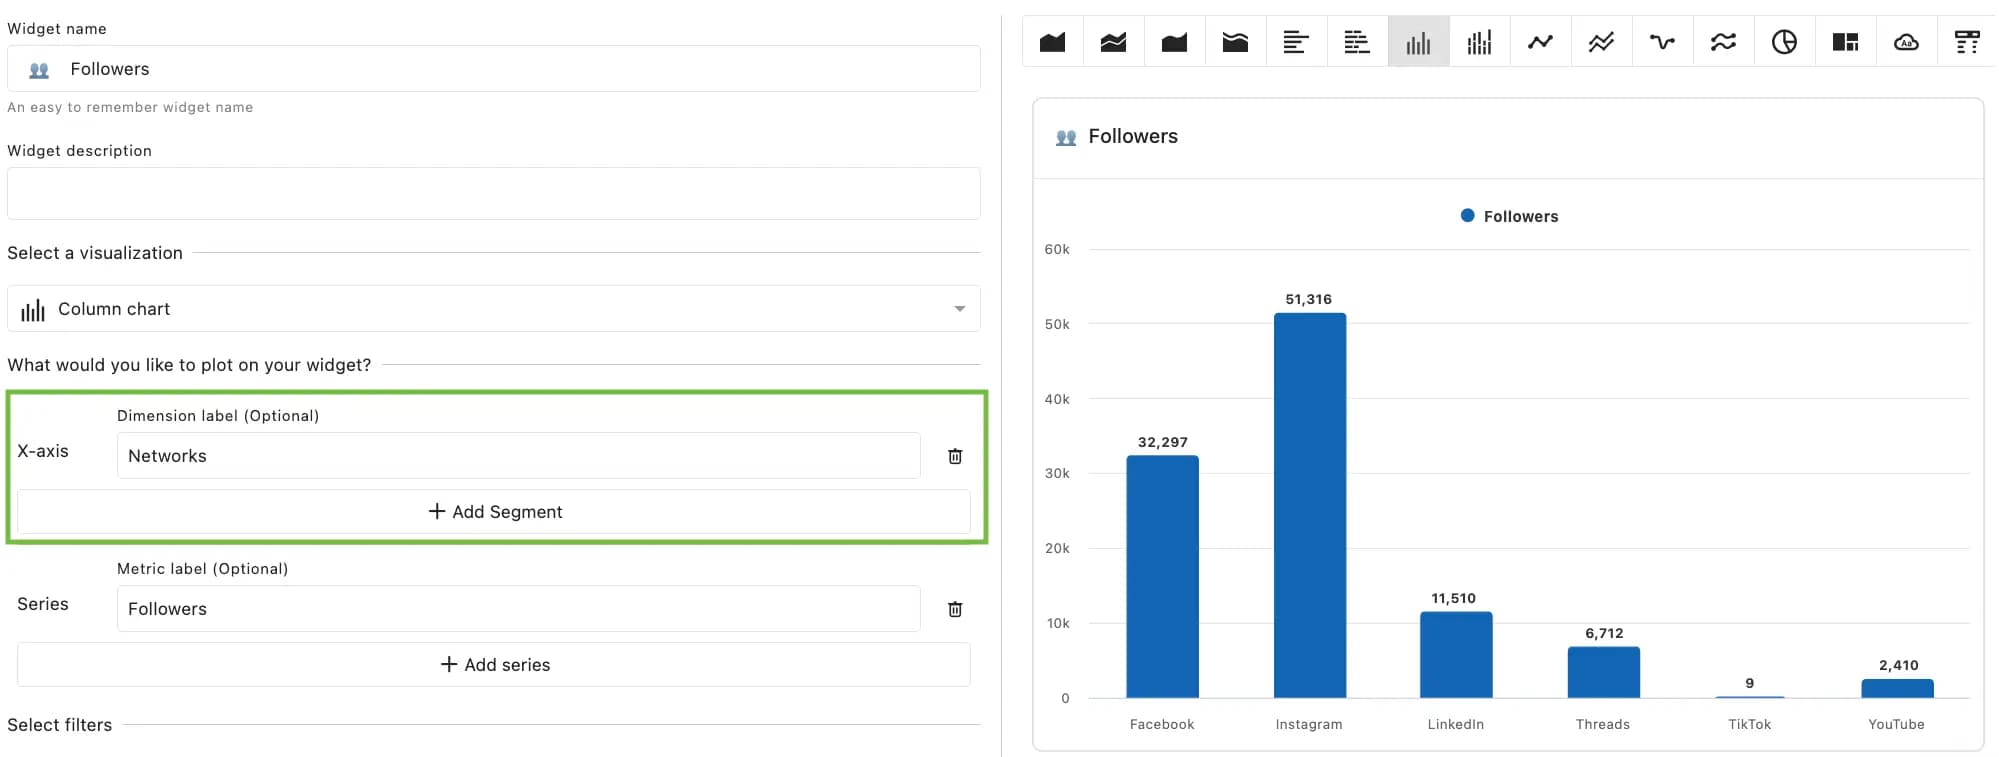
Dimensions allow you to break down your data by parameters such as network, date, actor, and conversation type. They add specificity to your data and also aid in comparative analysis.
For example, if you add the dimension "Network" to the metric "Followers," you'll see the number of followers on each network over the selected time period.
You can also drill down further into dimensions.
Dimensions are specific to each metric , so the number and type of dimensions displayed will vary depending on the selected metric (for example, the metric "Number of Followers" allows you to choose from nine dimensions, such as network and date, while "Number of YouTube Views" allows you to choose from ten dimensions, such as country and subscription status).
Filtering
Filters allow you to focus on specific data and provide more detailed reporting, increasing granularity by showing only the most relevant metrics.
For example, let's add a filter to the widget where we added a dimension above. In the previous image, LinkedIn and other social media platforms were included, but this time we want to limit it to Meta's platforms, so we only select Facebook & Instagram.
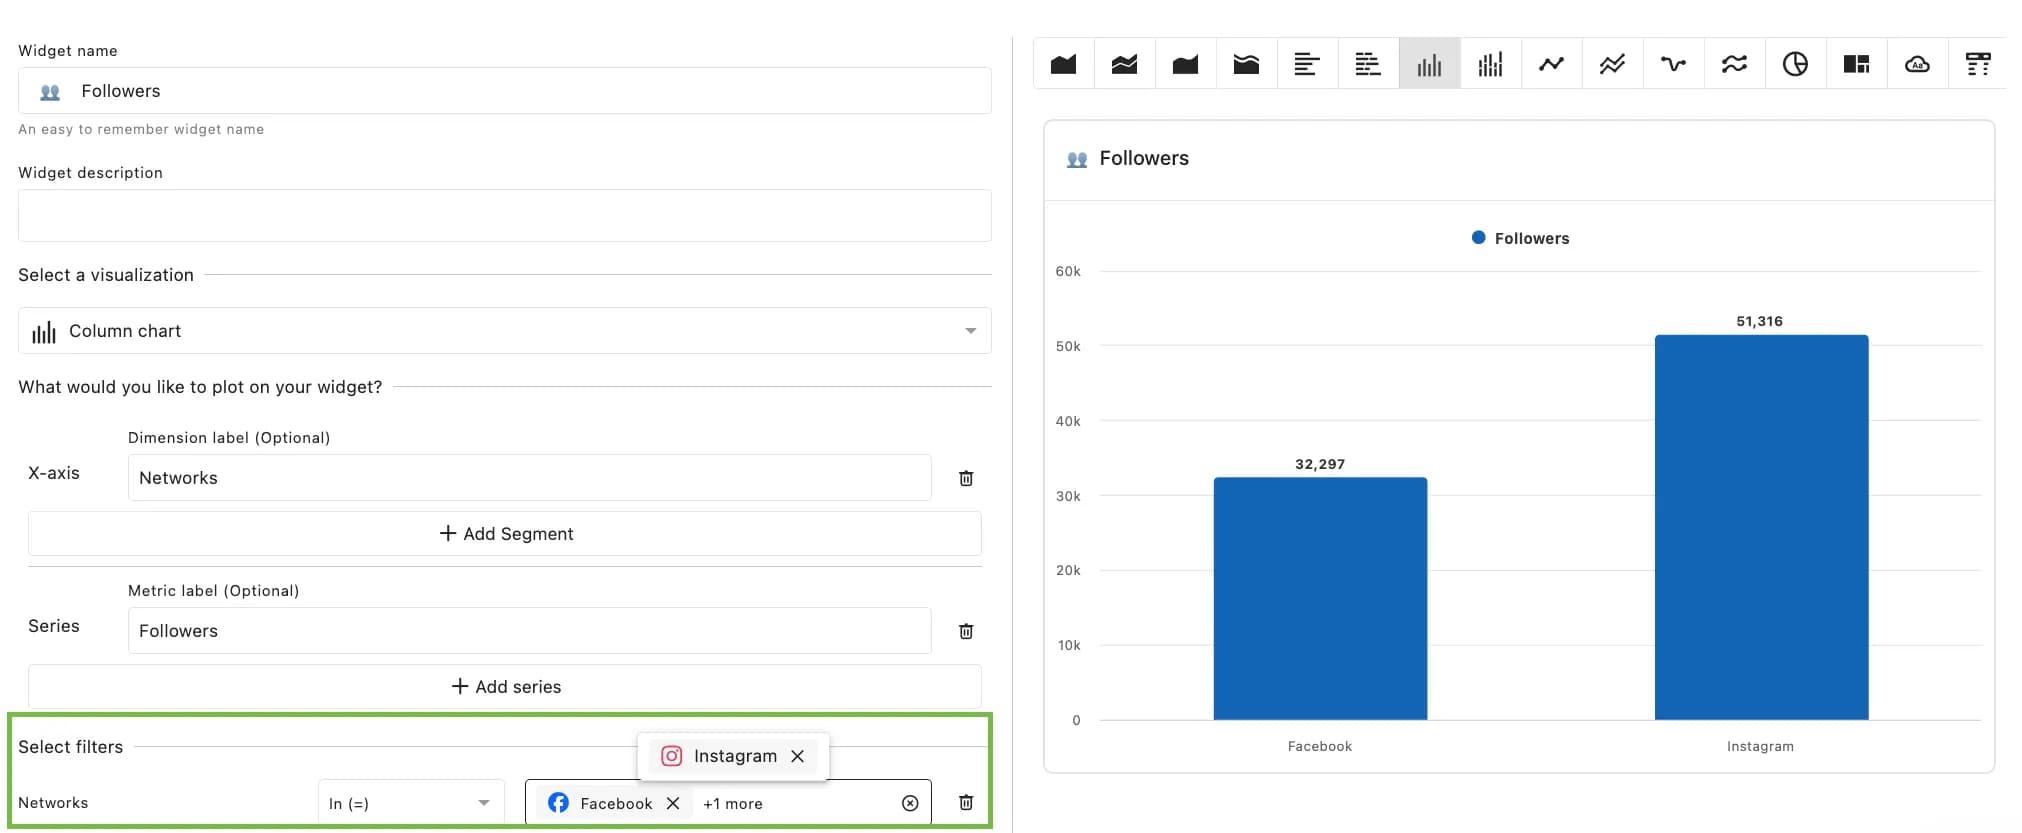
Filters are specific to each metric, so the number and type of filters you see will vary depending on the metric you select.
Learn more about filtering
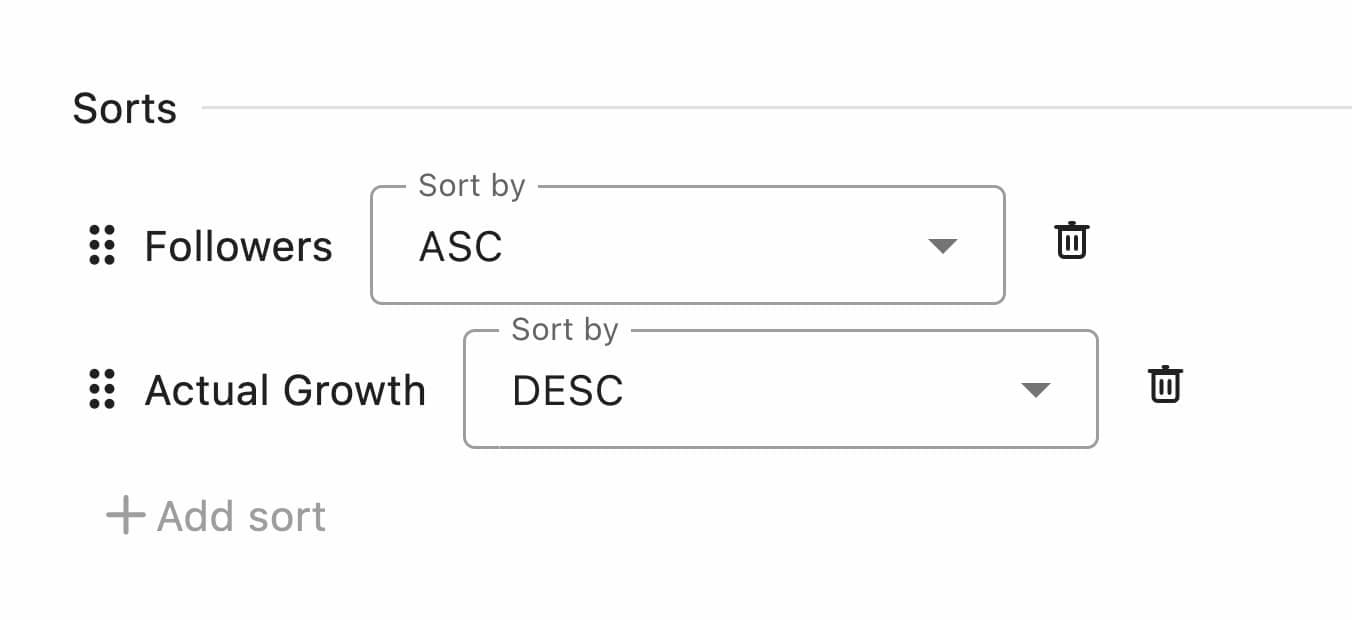
Sort
Adding a sort lets you arrange your data in ascending (ASC) or descending (DESC) order by the report metric you select.
This sorting feature is useful when you have a lot of data, as it naturally highlights the larger values, allowing you to prioritize key performance metrics.
Learn more details on sorting here
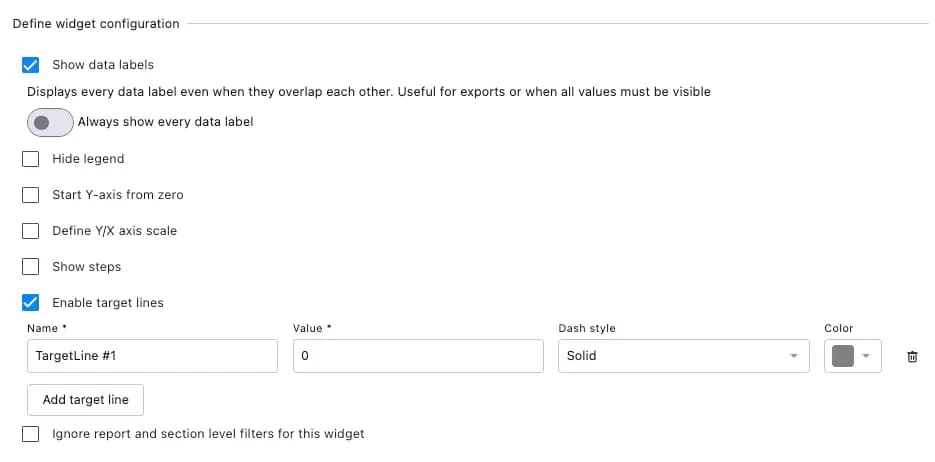
In addition to the above, you can also set the target line and define the X/Y axis from the "Define Widget Settings" for each widget.
Other useful features
Folder
You can organize your ever-increasing number of reports, such as weekly, monthly, and by client, using folders.
Create folders for each purpose, social network, or client, and store related reports there. This will help you keep your sidebar clean and give you quick access to the reports you need.
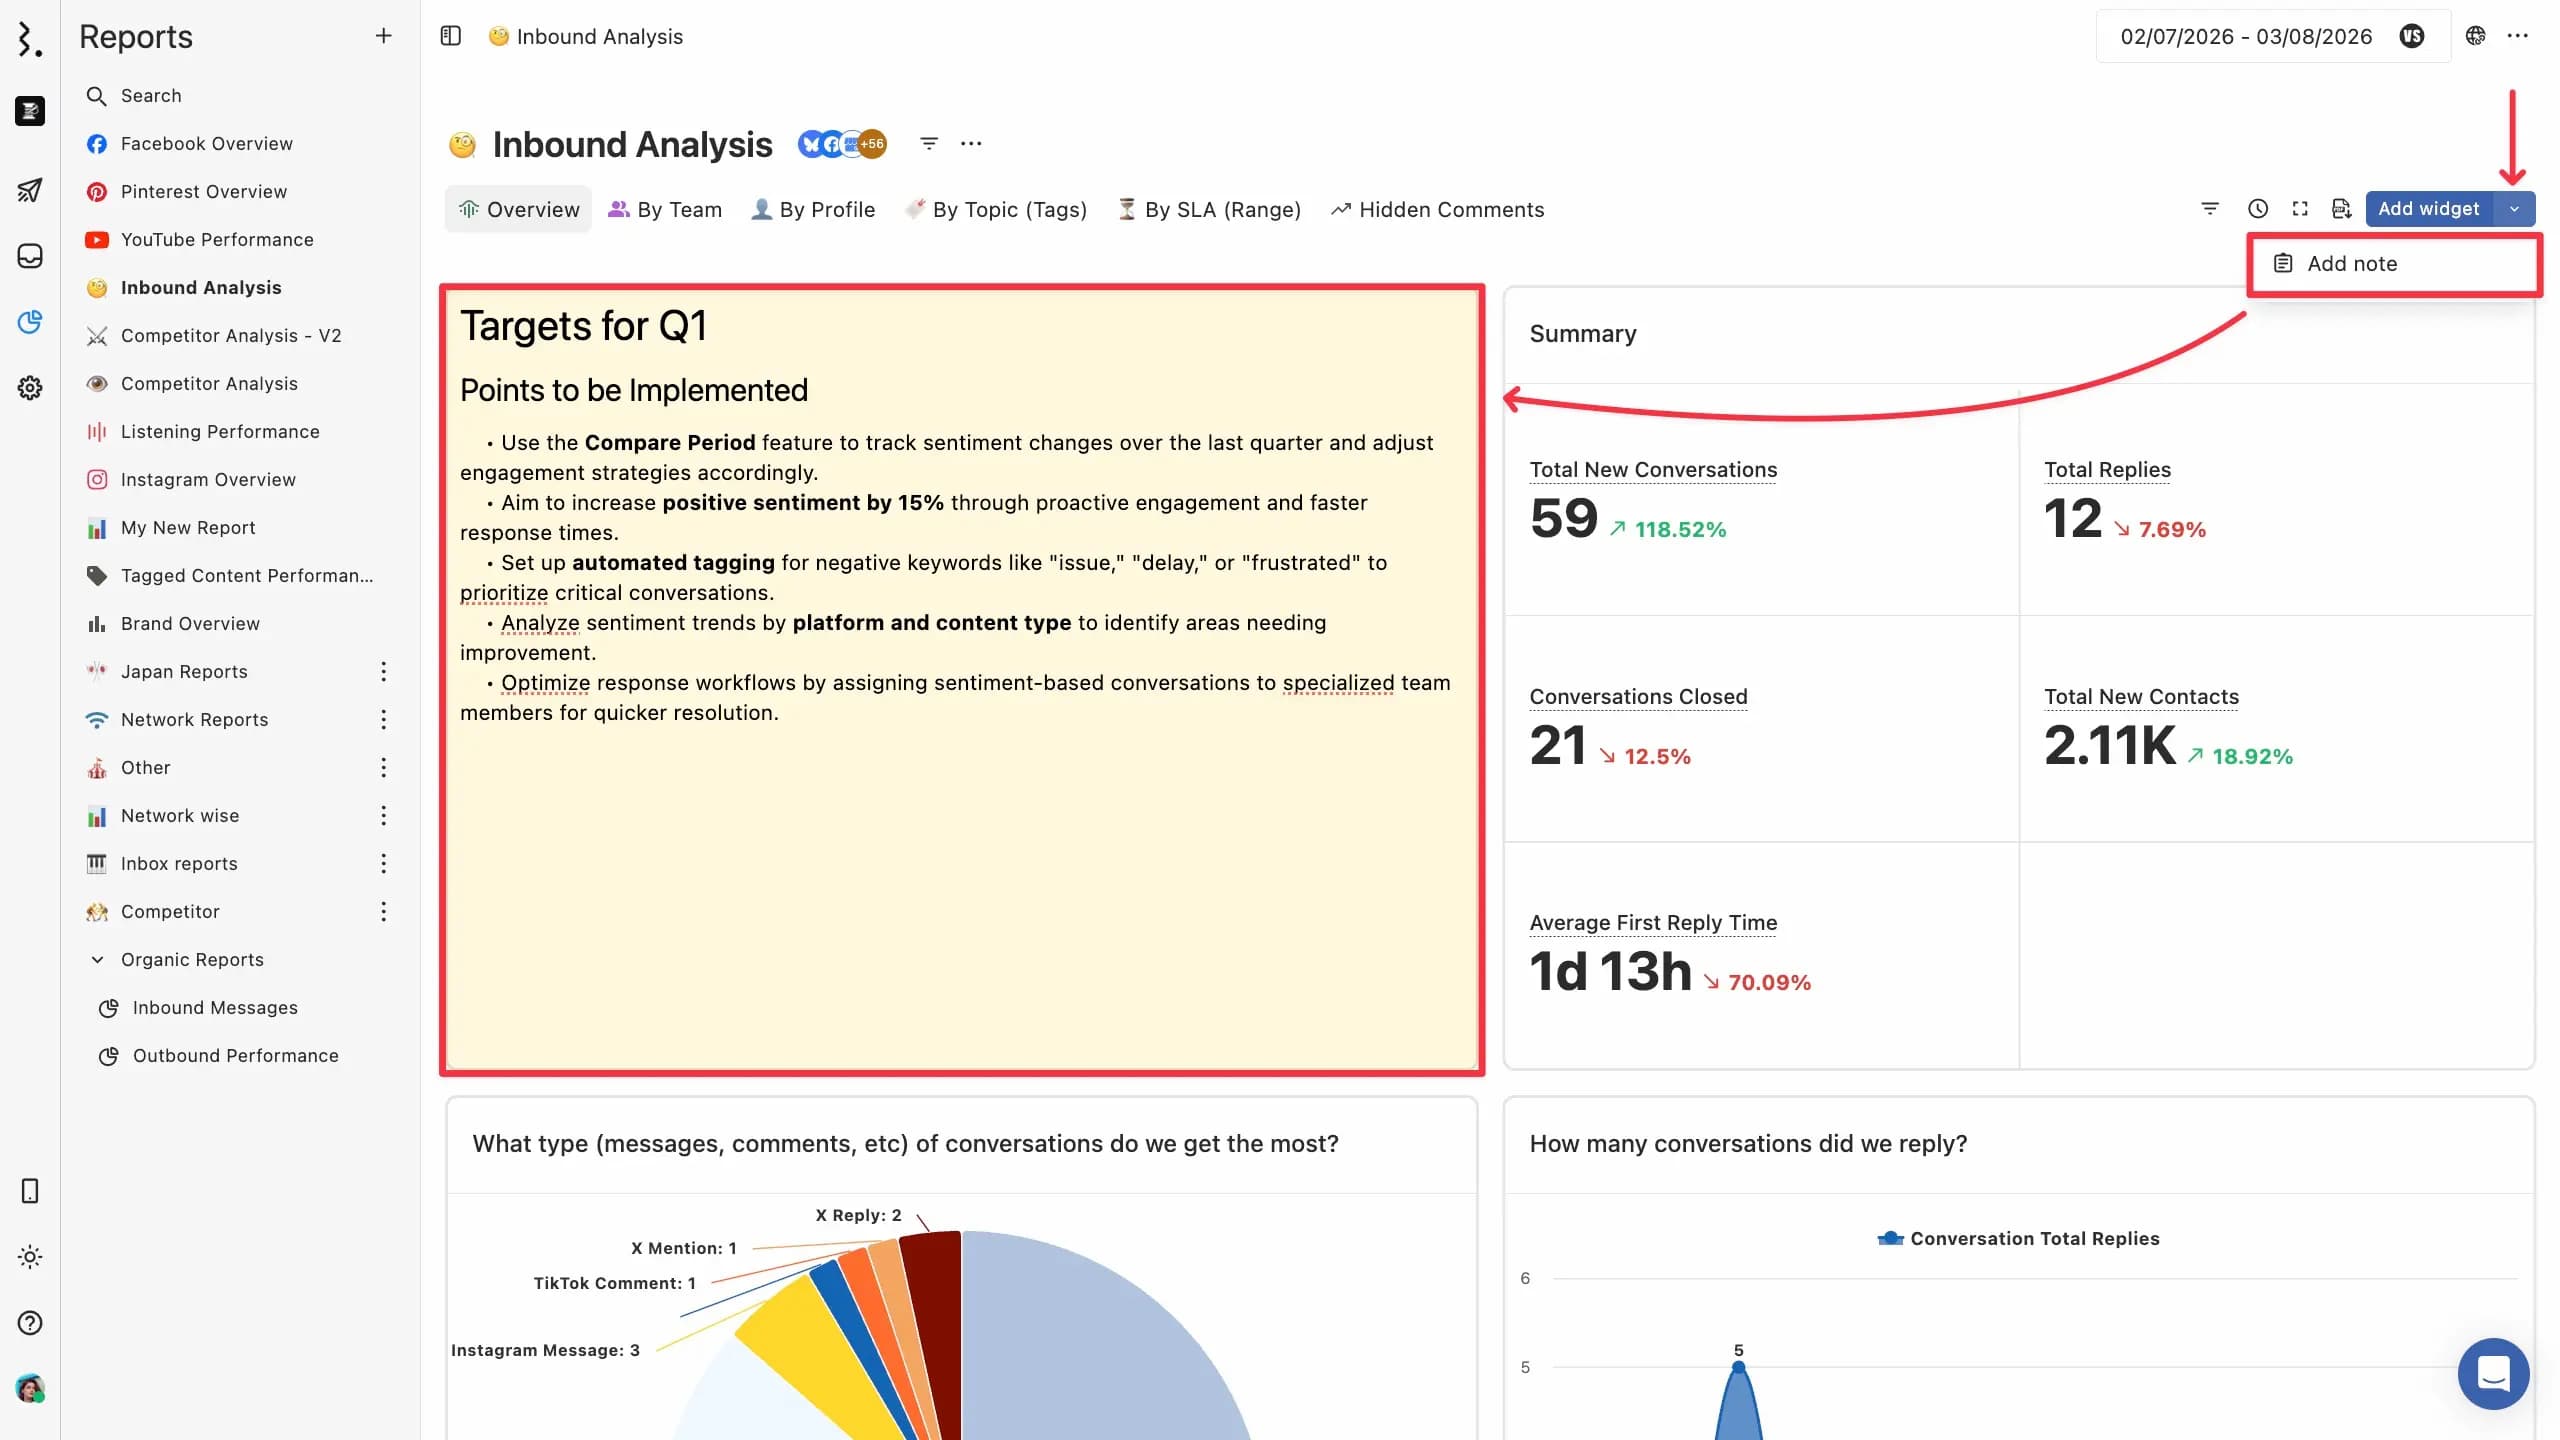
Notes
Notes let you add context, key takeaways, or action points directly in your reports. Use them to document insights, track goals, or highlight trends for your team.
Templates
Statusbrew also offers pre-designed templates.
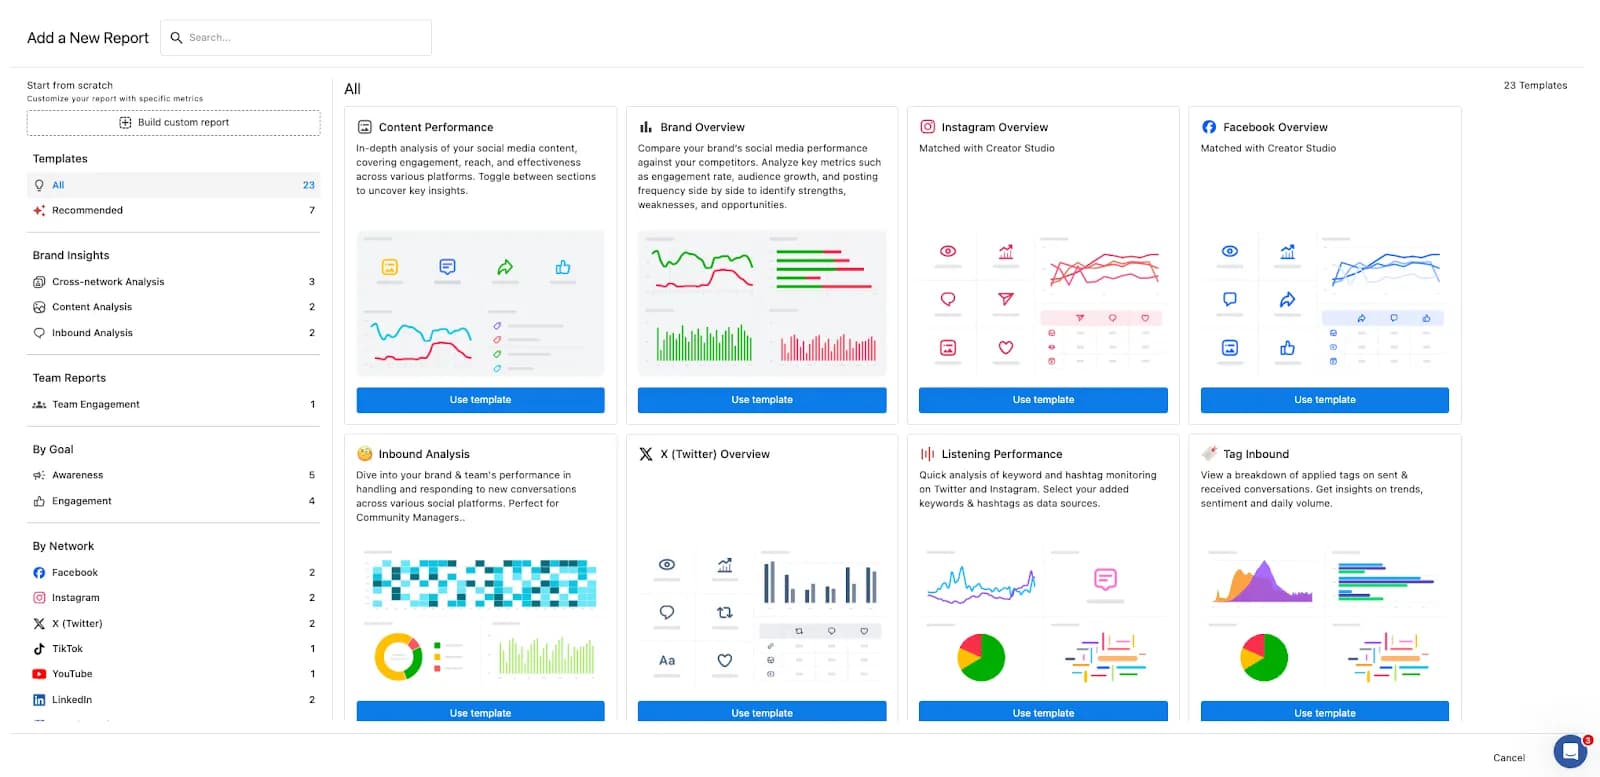
We offer report templates that include multiple widgets, as well as widget templates that let you create a report by selecting the widgets you need from a blank dashboard.
Schedule and export reports
Statusbrew reports can also be scheduled and exported.
Schedule report generation (reports will be automatically emailed at the specified interval)
Export reports as PDF
Download the widget in CSV format
Download the widget as a PNG image
Embedding a report in a web page
Share a report
Reports can also be easily shared.
For team members with Statusbrew accounts: Add them as collaborators and grant them edit or view permissions.
Even if you are not registered as a collaborator, users with Admin level or above can view and edit all reports .
For external users who do not have a Statusbrew account, you can share the report using the external sharing link without logging in to Statusbrew.
However, external users who are not Statusbrew users can only view the posts (they cannot be given editing privileges).
Create your first report
Now that you understand how powerful Statusbrew's analytics features are, it's time to create your first report! We recommend starting with a report template and learning the steps step by step.
Get important insights now through reports and analytics!
FAQs
Why don’t I see today’s data?
Some networks delay metrics. Statusbrew recommends waiting ~24 hours, and Google Business Profile can take up to 3 days.
Do widgets use the same date range across the report?
Yes. Your selected reporting period applies across widgets to keep insights consistent.
Can I share a report with someone who doesn’t have access to Statusbrew?
Yes. Use Shared links to create a live, view-only version of your report.
What’s the difference between exporting a report and exporting a widget?
Exporting a report generates a PDF (Grid/Stack). Exporting a widget lets you download the displayed data as CSV or the chart as a PNG image.
Can I automate reporting to clients or stakeholders?
Yes. Use Schedule to automate PDF deliveries via email.
Why is my report showing no data even if the profile shows active?
If you're seeing an empty report or missing data, here's the order to check:
Filters: Open your report and check if any filters are applied at the top of the report canvas. Remove them and see if data appears.
Data sources: Click the data source selector next to the report name, then confirm that the correct profiles are selected.
Date range: Check the reporting period in the top-right corner. Make sure it covers the time frame for which you're expecting data.
Permissions: If the Reports module loads but is empty, your account may not have the Create Reports permission. Note that even if a teammate has added you as a collaborator on their report, you still won't see any data without this permission. Ask your Primary Owner, Owner, or Admin to go to Settings > Profiles, click More beside the relevant profile, select Edit, and assign you the Create Reports permission.
Request a data sync: If you recently added a profile and data is not appearing in reports, reach out to the Statusbrew support team to initiate a data sync for your newly connected profile.
Why Are Profile Names Cut Off in My Report?
Profile names in reports are displayed exactly as they come from the connected social network. Column widths in reports are fixed and can't be resized, so longer names get truncated.
You can fix this by setting a shorter Display name for the profile in Statusbrew. This only changes how the name appears inside Statusbrew; it has no effect on the actual profile name on the social network.
Go to Settings → Profiles.
Find the profile with the long name and click (three-dots) beside it.
Select Edit.
In the Display name field, enter a shorter or abbreviated name.
Click Update.
The shorter name will now appear in your reports and across Statusbrew.
This change is internal only. Your profile's actual name on Facebook, Instagram, or any other network stays the same.
Can I filter a report by a tag?
In Statusbrew, tags are applied to Conversations, Contacts, and Posts/Content.
It depends on what you've tagged.
Tags on conversations (inbound): Open any Inbound Analysis report in Statusbrew Report and apply the Tags filter to narrow results to specific tags.
You can also use the Tag Inbound report to get a dedicated breakdown of all your tagged conversation activity.
Tags on posts (outbound means content or posts). Open your Content Performance report in Statusbrew Report and apply the Tag filter to view post performance by tag.
Note: Please make sure you are using the correct tag for reporting (either conversation or post), and that the tags were applied correctly.
Why is my widget showing 0 or unexpectedly low numbers?
First, make sure you select the right data source and date range.
Now, check that your widget is configured correctly:
Metric: Confirm you've selected the right metric for what you're trying to measure
Sort: Confirm the sort order is set as intended
Filters: Confirm each filter type appears only once, with all desired values selected within that single row
For filters specifically, each separate filter row is treated as an AND condition, meaning the widget looks for data that satisfies all rows simultaneously, which is often impossible, so the count drops to zero or a very low number.
The fix: use a single filter row for each filter type and select all the values you want within that one row. Most filters support multi-select. For example, if you want to track Facebook Comments, Facebook Messages, and Facebook Post Mentions, select all three within one Message Type filter row instead of adding a separate row for each. Values within a single row are treated as OR conditions, and your count will reflect correctly.
Can I show a widget or report section for a smaller time period than the main report date range?
Yes. You can filter a widget or report section to a smaller time period using date-based filters such as Month, Quarter, or Day of Week.
However, the selected time period must be within the main report date range selected at the top of the report.
For example, if your main report date range is January 1 to April 30, you can filter a widget to show only April data.
But if your main report date range is only April 1 to April 30, you cannot use a widget filter to show February or March data, since those months fall outside the main report date range.
Why do Month, Quarter, and Day of Week filters ask for numbers?
Currently, these filters use numeric values instead of showing readable names.
Ideally, the month should show names like January, February, and March. Quarter should show Q1, Q2, Q3, and Q4. Day of Week should display weekday names such as Monday, Tuesday, and Wednesday.
For now, you need to enter the matching number value.
Month values
Use the following values when filtering by Month:
January = 1 February = 2 March = 3 April = 4 May = 5 June = 6 July = 7 August = 8 September = 9 October = 10 November = 11 December = 12
Example:
To show only April data in a widget, use:
Month → Is (=) → 4
To show February and March data, use:
Month → Is greater than equal to → 2 and Month → Is less than equal to → 3
Quarter values
Use the following values when filtering by Quarter:
Q1 = 1 Q2 = 2 Q3 = 3 Q4 = 4
Example:
To show only Q2 data, use:
Quarter → Is (=) → 2
Day of Week values
Day of Week also uses numbers instead of weekday names.
Before sharing exact values with a customer, confirm the mapping used in Statusbrew. It may follow one of these formats:
Monday = 1 to Sunday = 7
Key thing to remember
Widget or section filters can only narrow down the data from the main report date range. They cannot pull data from outside the main report date range.
If I duplicate a report, will changes in the original report apply to the duplicate?
No. Once a report is duplicated, it becomes a separate report.
Any changes you make to the original report will not automatically apply to the duplicated report. For example, if you duplicate Team Performance as Management Reports, both reports can then be edited independently.
If you want the same changes in both reports, you need to update each report separately.
Can I copy a report section to another report?
Yes. You can copy a report section to another report in the same Space or to a report in a different Space.
Open the report section menu, select Duplicate section, then choose the destination Space and Report.
This is useful when you want to reuse a section, such as profile performance, team performance, engagement summary, or a custom widget group, without rebuilding it from scratch.
Once copied, the section becomes a separate section in the destination report. Changes made to the original section will not automatically apply to the copied section.
If you want the same changes in both places, update each section separately.