How To Use A Report?
The reports analyze social media campaigns and performance , and also support advertising reports To do this, you can create your own custom reports or use the template's reports and widgets to quickly track key analytical metrics. In this article, we'll use the template's Competitive Performance report as an example to show you how to use reports effectively.
The Competitor Posts report lets you analyze your competitors' posts across Facebook, Instagram, and X. Analyzing your current social media performance compared to your competitors can help you identify opportunities and refine your strategy.
Reporting is available on Standard, Premium, and Enterprise plans.
Use Case: Competitor Analysis Report
For instance, you want to compare your brand's Instagram engagement metrics with those of your top competitors. With the Competitor Analysis report, you can analyze key performance indicators like follower growth, engagement rates, post frequency, and audience interactions across all selected competitors.
Note: Before using competitor analysis report template, you need to add your competitor’s social profiles in competitor channels
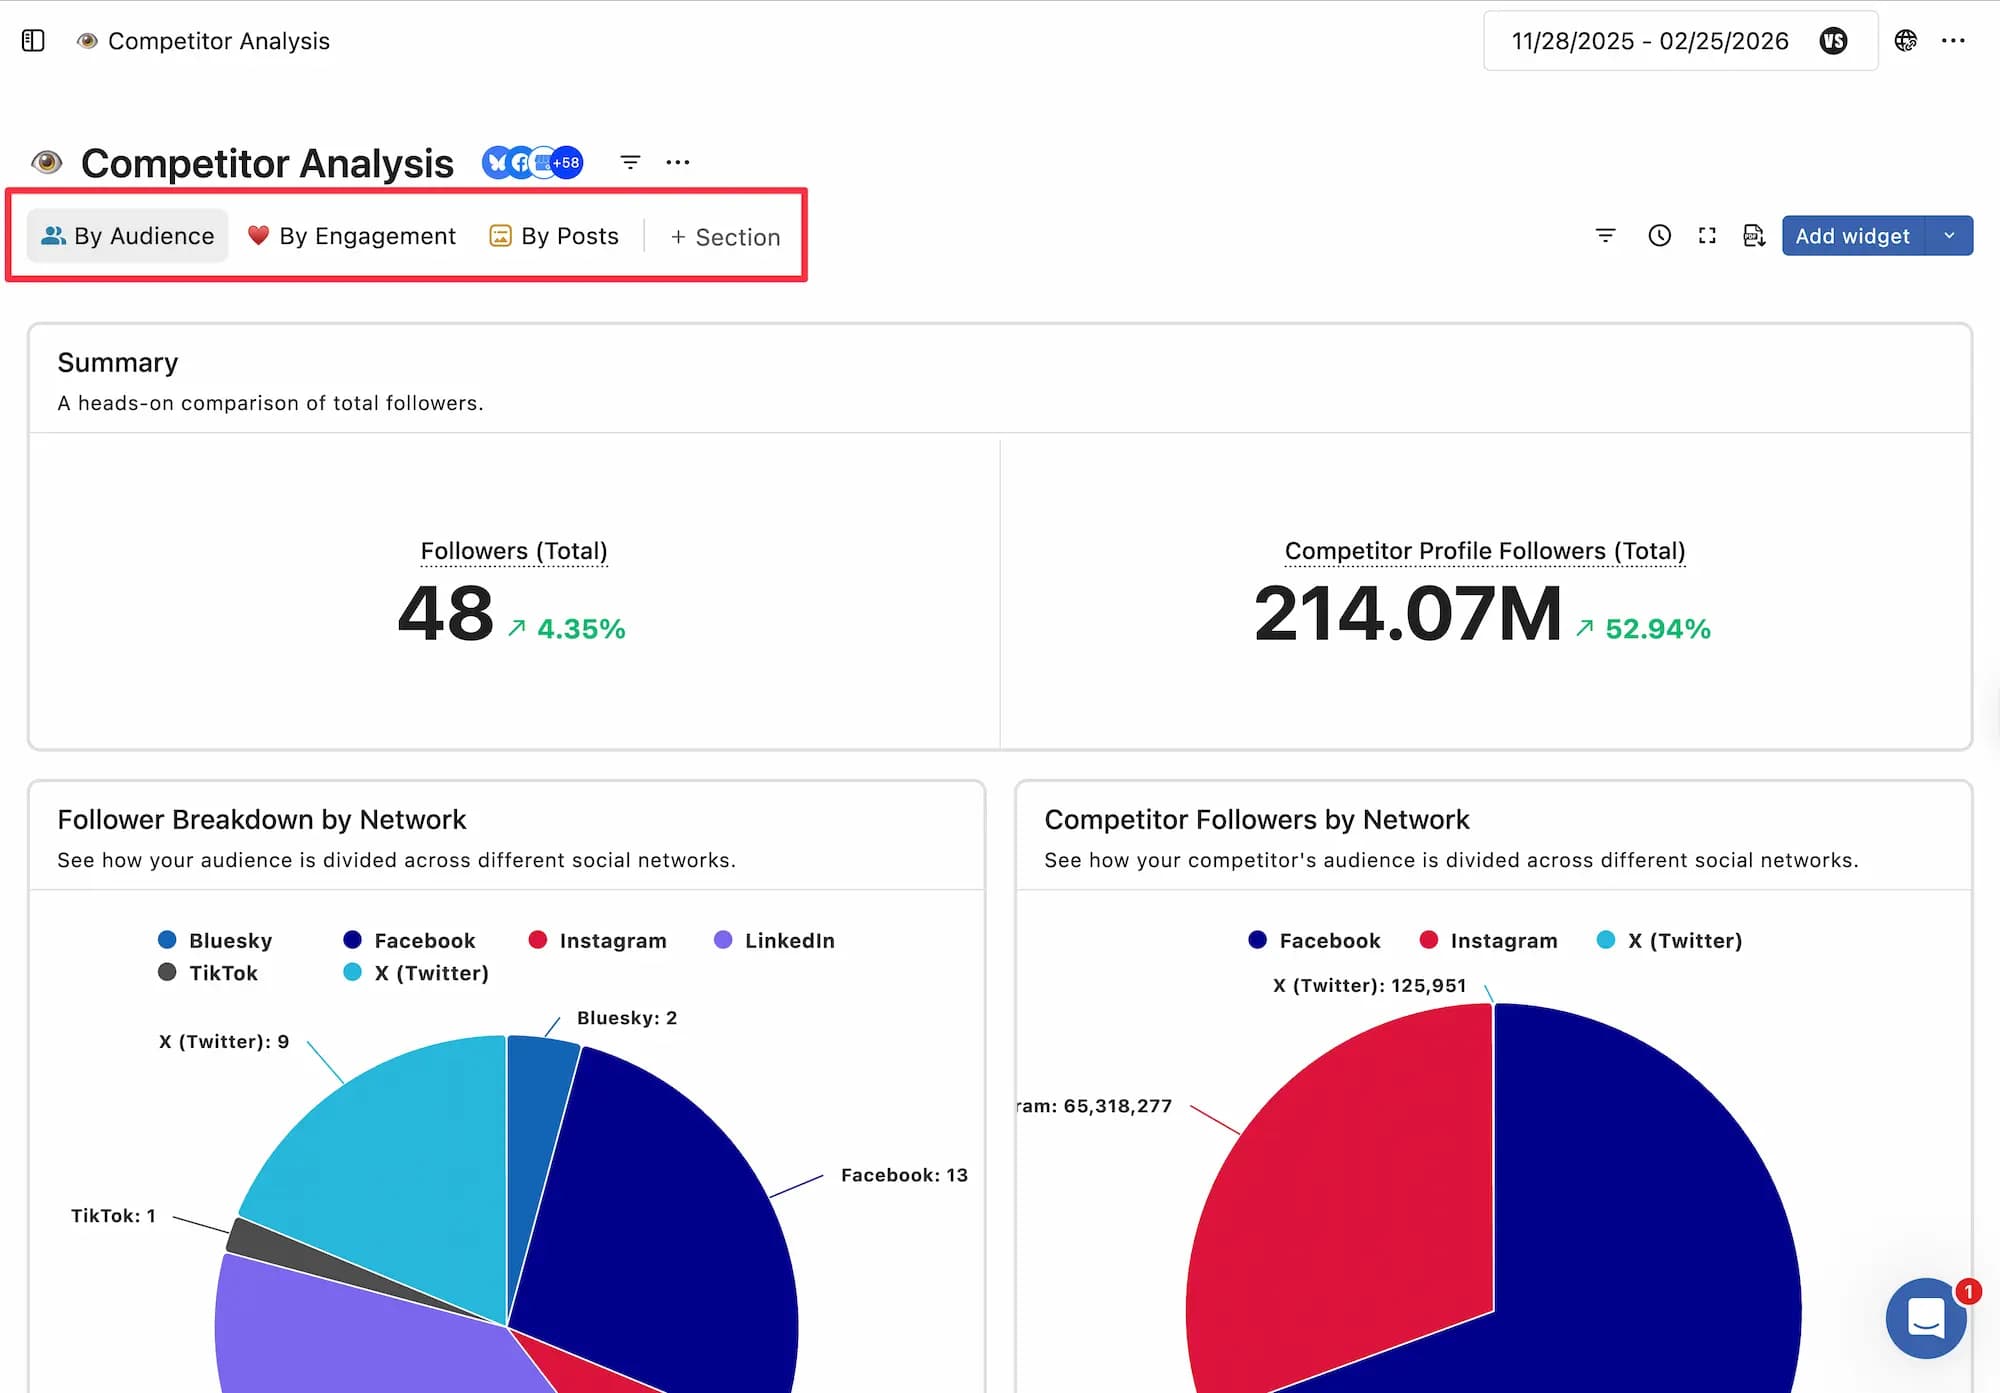
By comparing your metrics with theirs, you can identify areas where you're excelling and where there's room for improvement. It also helps you to keep a close eye on your competitive market. You can easily create a competitor analysis report from the Competitor Analysis Template in Reports.
Note: Competitor Analysis Reports for Twitter, Instagram, and Facebook are available for Premium and Enterprise Plans.
How Do I Customize The Report?
You can create a custom report fit for your business needs.
Here’s how to tailor your Competitor Analysis report:
Select Data Sources: Choose which social profiles and competitor channels you want to include.
Adjust Date Ranges: Customize the reporting period for more relevant insights.
Add or Remove Widgets: Use the widget builder to add metrics that matter most to you or remove those that don’t.
Add Sections: Add or rearrange sections within the report to customize how you want to view the report.
Rearrange Widgets: Drag and drop widgets to organize the report layout as you see fit.
What Metrics Are Included?
Every report, including the Competitive Performance Report, provides a detailed analysis of your performance with pre-designed metrics .
Metrics included in the Competitive Performance Report for Facebook, Instagram, and X include:
Follower Growth: Analyze the rate at which your competitors have gained or lost followers.
Engagement rates by network: Compare likes, comments, shares, etc., based on audience size
Content Frequency: See how often your competitors post and how much engagement they're getting.
Post Type Breakdown: View a breakdown of the types of posts you've published (GIFs, videos, etc.)
Top Posts: See which content types your competitors are engaging with most and compare them to your brand
To view details about the metrics used in a widget, click theHover your cursor over it to see details in a pop-up.
The competitor metrics available will vary depending on the social platform and competitor you select.
How Do I Share The Report?
Reports can be easily shared with stakeholders and clients.
Share a link: How to create and share an active link
Schedule PDF generation: How to schedule PDF reports to be generated and automatically sent by email.
Download and share: Download as a PDF ( choose your view type: stacked or grid ) and share it with stakeholders or clients