Create A Custom Report
Use the report builder to create customizable reports tailored to your business needs. The report builder allows you to add widgets, customize them, and sort them to display the metrics that are important to you
Create a new report
The Primary Owner, Owner, Admin, or any user with full analytics access for a specific profile can create a custom support at any time.
Statusbrew Reports on the dashboard Click
To create a new report, click at the top of the left panel where the dashboard names are listed. Click the icon to create a custom report Select
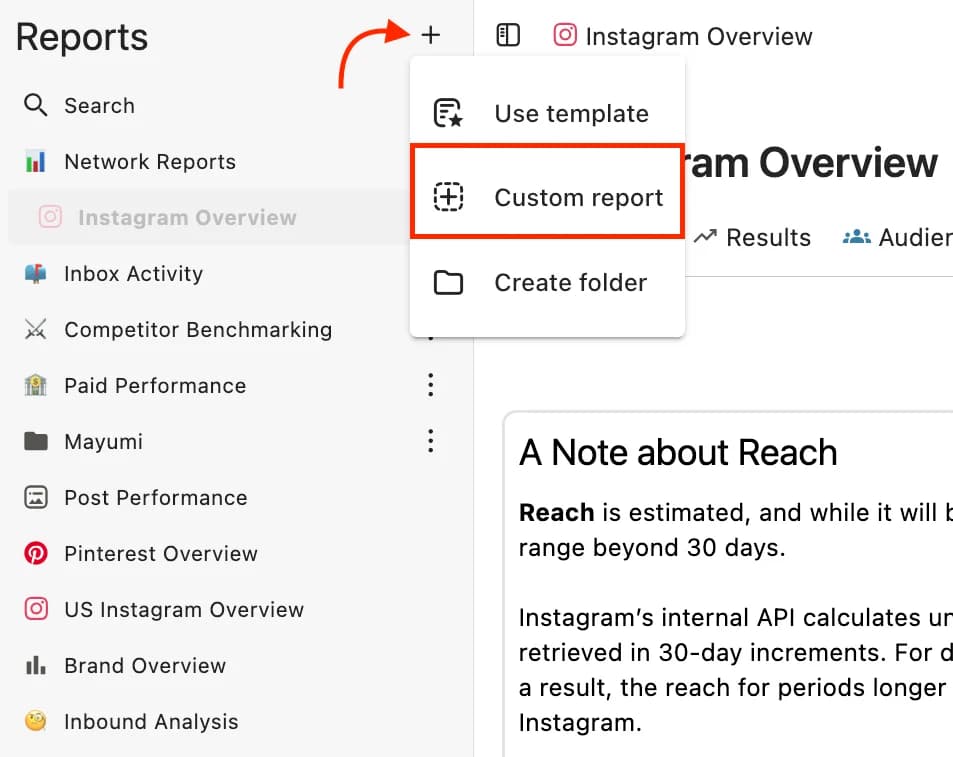
This article explains how to create a custom report from scratch, but if you want to use a template report that generates data instantly, see Templates. Please select an option.
Report Name: Give it a descriptive name.
Icons: You can also set emojis, icons, and colors to style your reports.
It's also useful to upload your company logo at this point for branding purposes and for submitting to clients.
Summary: Enter a summary of the report.
Data Source: Select the data source from which the report data will be extracted.
Collaborators : Designate the users/user groups with whom you want to share the report data as collaborators and grant them view or edit permissions.
Users with Admin level or above can view and edit all reports without being added as collaborators.
Once you have completed the above settings, click the Create button.
Set the data range for your report
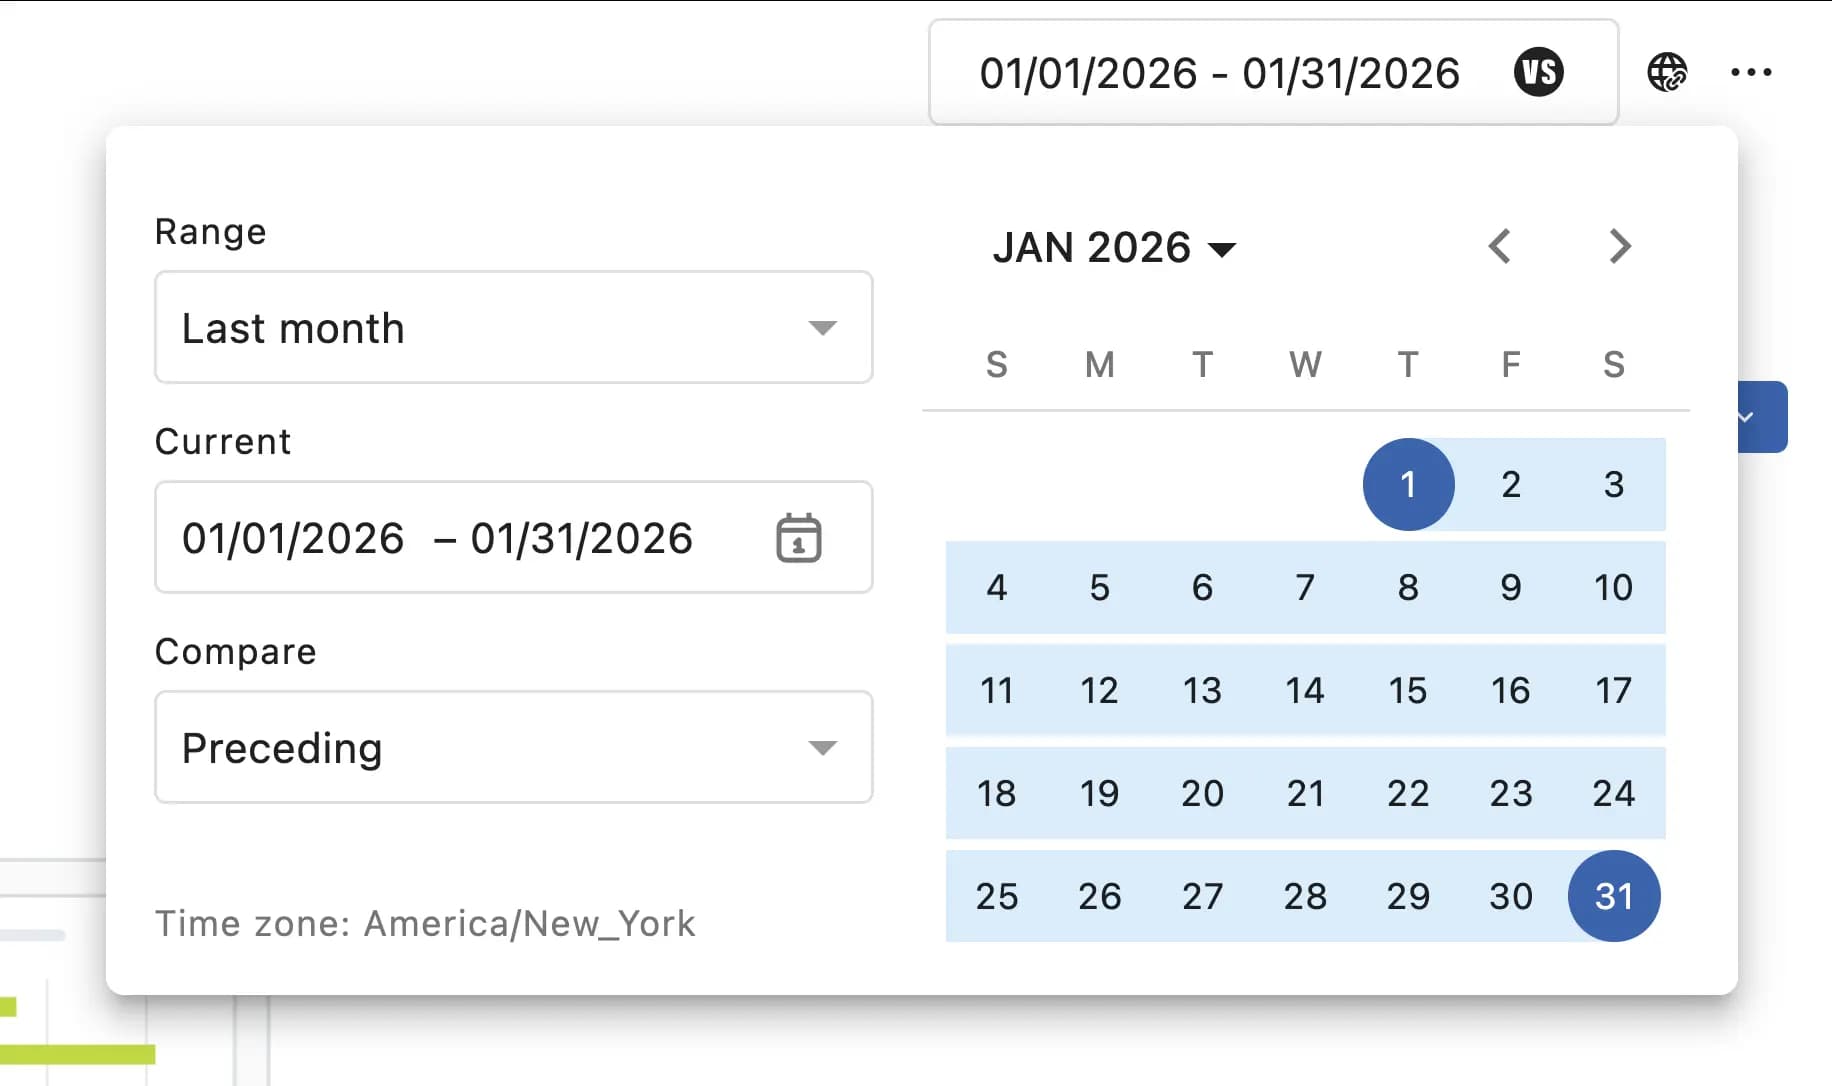
The report will be displayed, so you can set the range of report data to be acquired. By default, it is set to the most recent week, so change it as necessary.
If necessary, you can also set a comparison period to compare the data.
Adding widgets
Click Add Widget to open the Widget Library. You can add up to 100 widgets to each report.
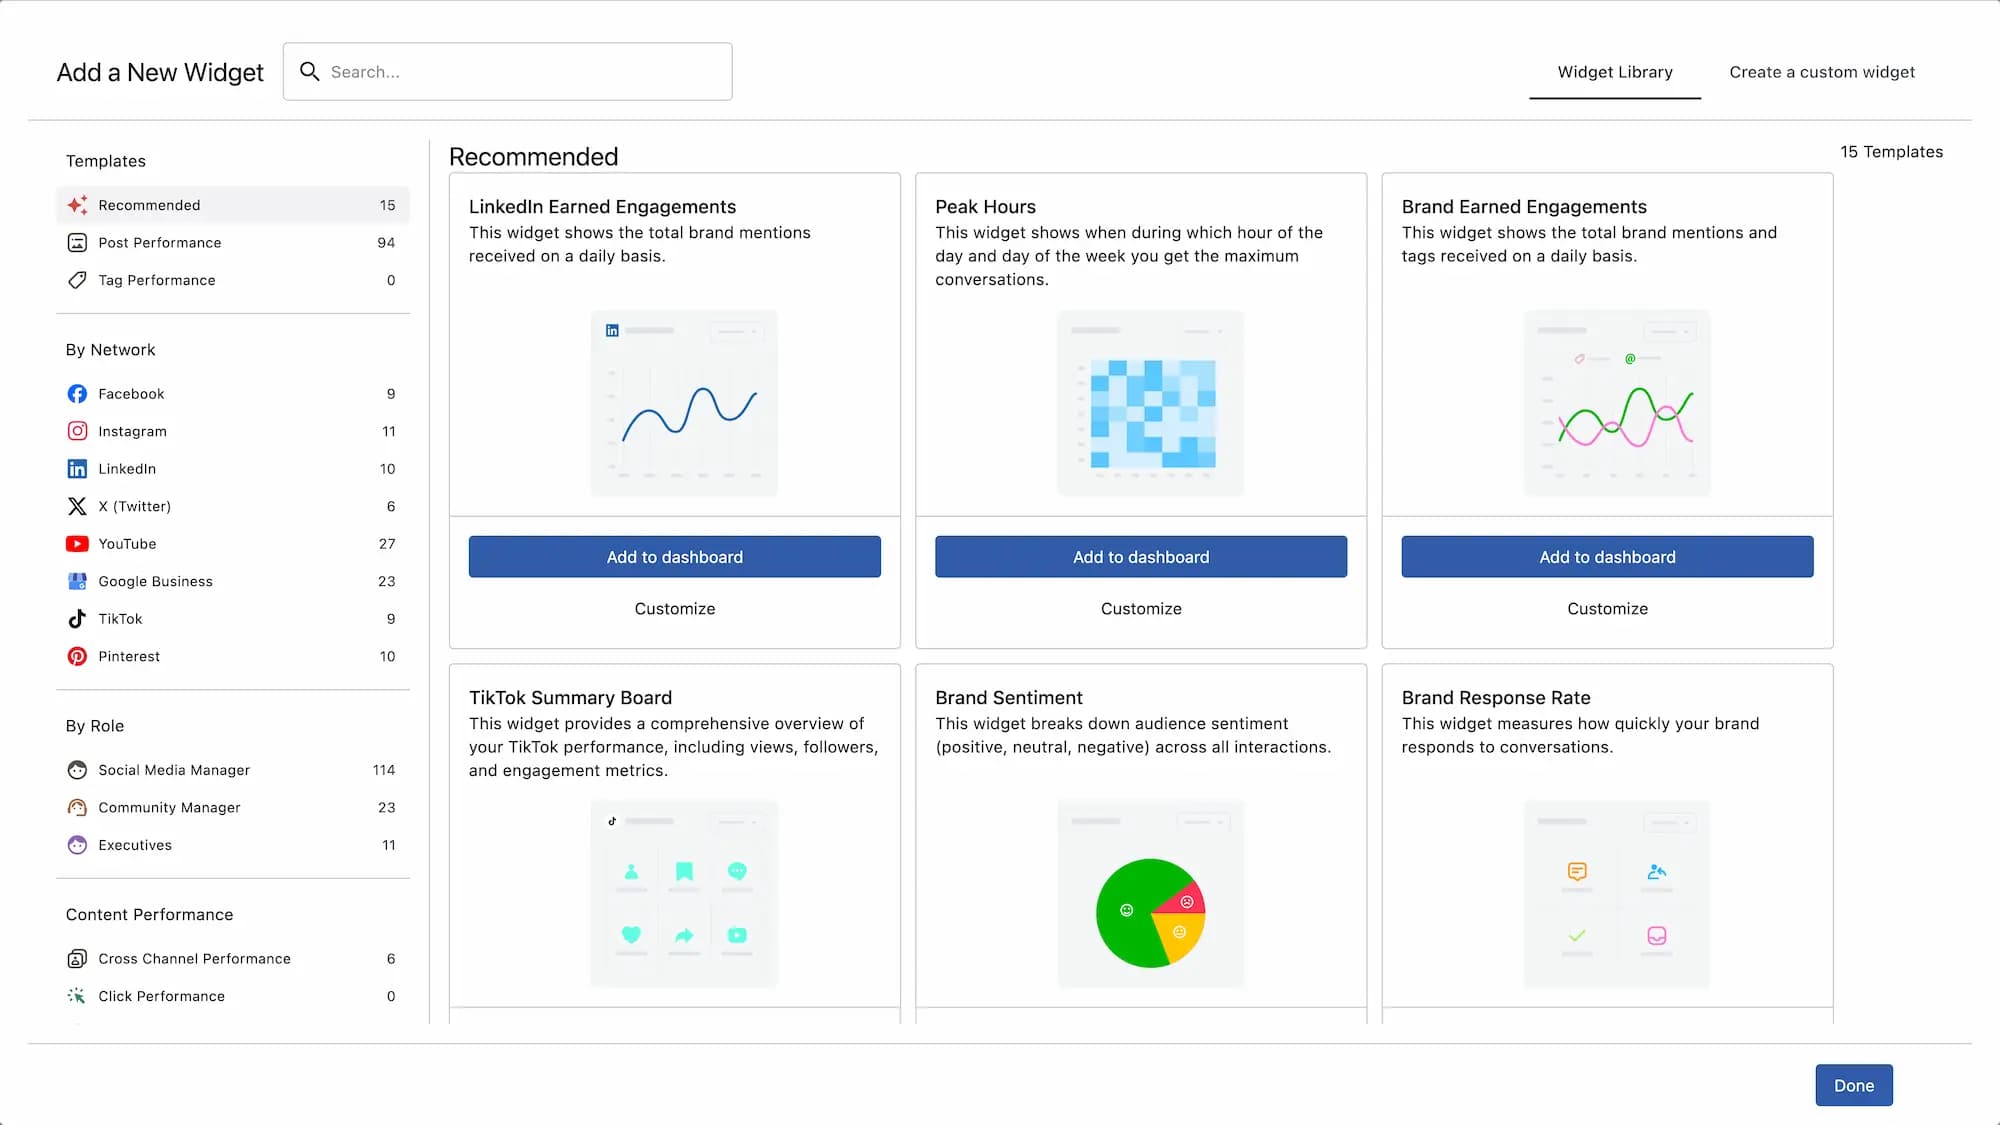
Add or customize the widgets you want directly, or you can create a custom widget. Follow the steps below:
1. Enter a name and description for the widget.
2. Select the visualization format (e.g., line chart, pie chart, heat map chart, etc.).
3. Choose the analytics metrics you want to track (e.g., number of posts, engagements, etc.). Statusbrew offers over 250 metrics to choose from.
When building a widget to show top posts, select metrics from the Post category (e.g., Post Engagement, Post Impressions). Page-level metrics cannot be combined with Post metrics and will trigger a compatibility error.
4. Set filters, data sorting options, etc., as needed.
5. When you're done, click Save.
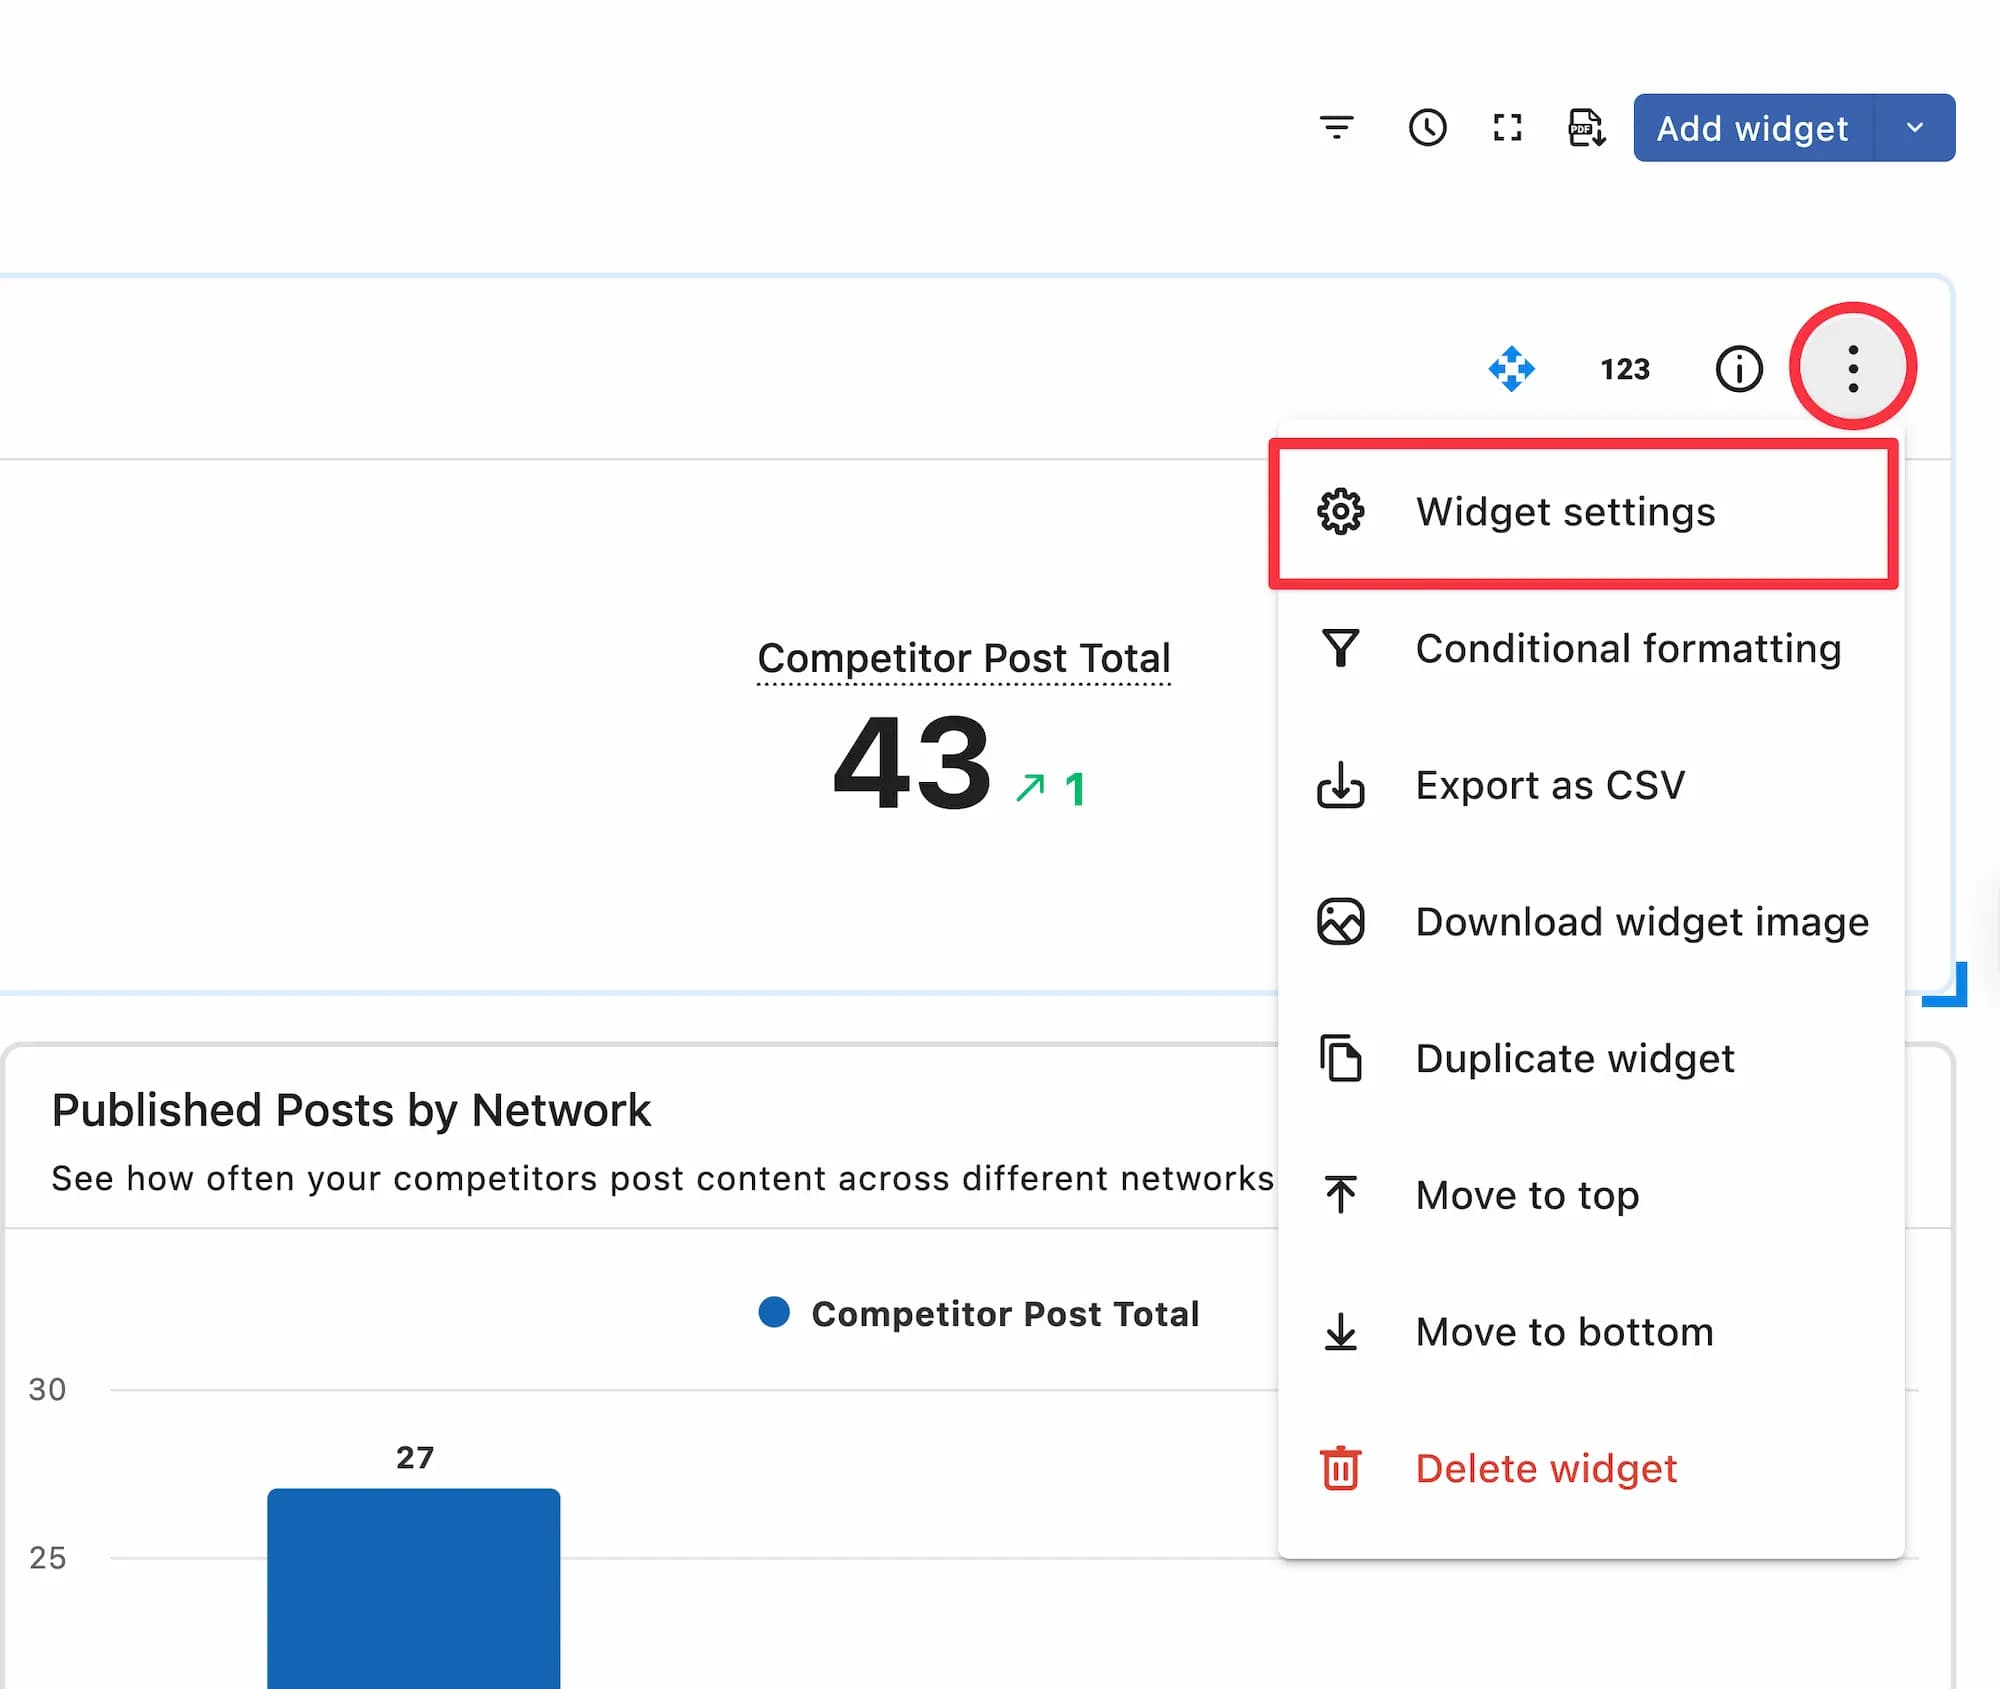
6. To edit a widget, click the three-dot menu. You can also edit, set conditions, duplicate, delete, or download the widget as a CSV.
You can change the size and order of widgets by dragging and dropping them.
Other operations
Add a section: Click the . You can add multiple sections to your report by clicking "Add Section". You can also duplicate or delete sections.
We recommend categorizing sections by the types of widgets they contain, such as a section for analyzing audience metrics and another for comparing with competitors.
Duplicating reports, etc: Three-dot menu in the top right corner of the screen . The following operations are possible from
Full Screen View
Report scheduling
Editing a Report
Duplicating a Report
Download the report
delete
The entire dashboard is available for download in PDF format, while individual widgets are available for download in CSV format.