Add Section To A Report
Report sections can be used to add different pages to a report. It allows you to organize your report into multiple pages, each with its own set of widgets. Sections are useful for grouping related insights, breaking down large reports, or creating dedicated views for specific teams.
How Report Sections Work?
When you create a custom report, a section is added and named after the report itself. You can later rename it or add more sections to further organize your data.
When using report templates, sections are already built in, depending on the template you choose.
For example, the Post Performance report template has the following sections:
Overview: High-level summary of your content performance.
Top Posts: Highlights the best-performing posts based on engagement.
Top Stories: Focuses on top-performing Instagram Stories.
By Theme (Tags): Gives the breakdown of your content performance by tags (internal labels).
By Author: Displays post performance grouped by team member or content creator.
How To Add A Section To A Report?
You can add as many sections as you need to structure your report effectively.
From the section bar, select Section. A new section will be added to the report, named "New Section #n" by default, where n represents the next available number in the sequence. For example, if your report already contains one section and you add a section, its default name will be “New Section #2.”
How To Manage Sections In A Report?
To manage a section, open it and click it. You will get the following options:
Edit section
Selecting Edit section will open the Edit section dialog box. Here you can:
Change the icon.
Rename the section to something more descriptive or relevant.
Add Filters to narrow down the data shown in that section. Filters applied to a section affect only the data shown in that section. Filters won’t be applied to a report section that doesn't have a widget added.
Once done, click Save to apply your changes.
Duplicate section
Choosing Duplicate section creates a copy of the current section, including all widgets and filters.
The new section will appear next to the original and will be labeled with a prefix like "[Cloned]:" followed by the original section name (e.g., [Cloned]: Top Posts).
This is useful when you want to reuse the same layout but change the filters or widgets to show a different perspective.
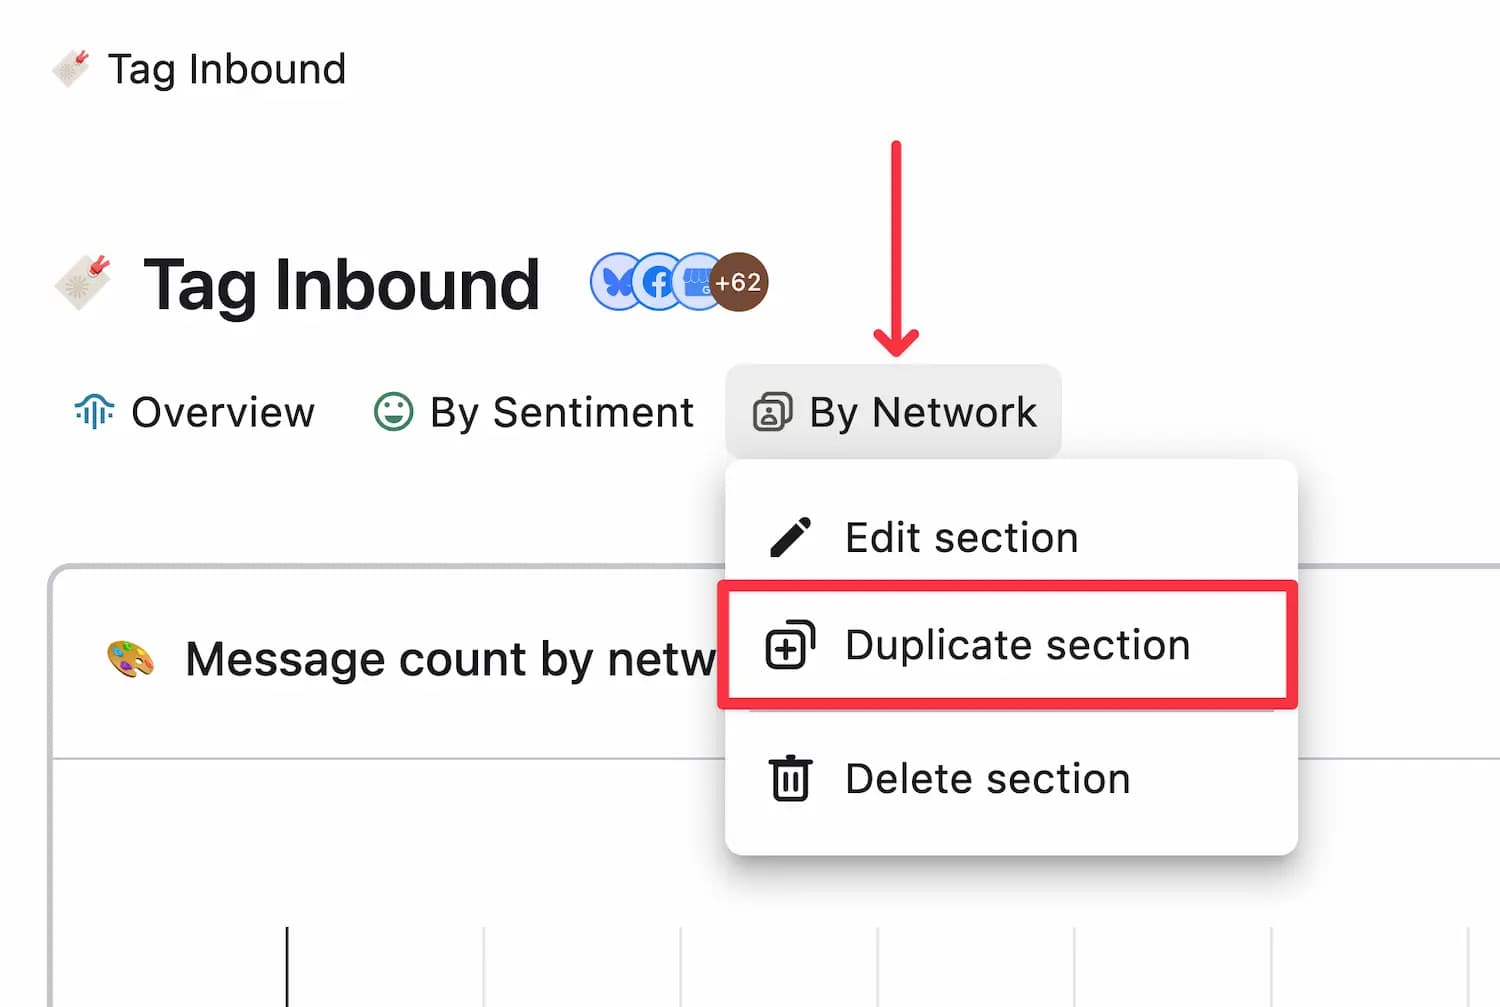
Delete section
Click Delete section to remove the section from the report. A confirmation prompt will appear, warning you that this action cannot be undone.
To proceed, click Delete. If you change your mind, click Cancel to return without deleting.
Note: Every report must have at least one section. Therefore, you won’t be able to delete the last remaining section in a report.
Rearranging Sections
To rearrange sections:
Click and hold the section you want to move.
Drag it to the desired position and release.
The new order is saved automatically.
Section Filter Types
Adding filters allows you to filter your section view based on various options, creating a more personalized section.
The steps are as follows:
Double-click the section you want to edit.
You will see an option to Edit Section , select it.
The editing screen will appear, so click Add Filter.
You will be presented with multiple filter options, so set as many filters as you need.
Once you have finished entering the information, click Save .
Below are all the types of filters, but the filters displayed may vary depending on the widget and network.
tag
Data Source
network
Post Types
Conversation Type
Executor
UTM Campaign
UTM Source
UTM Medium
UTM Content
UTM Term
Post likes
Number of comments posted
Post shares
Post clicks
Post impressions
Post reach
Number of views of posted videos
Number of saved posts
Post replies
Number of reposts
Post citation count
Post Follow Count
Number of views of posted videos
Total Interactions
Total profile activity
Bio link clicks
Call Clicks
Directions clicks
Email clicks
Other clicks
Text clicks
Time Zone
day of week
month
quarter
Message Type
Language used
sentiment
hidden
Deleted
Brand Message
Star Rating
Brand Keywords
End time (seconds)
End time calendar (seconds)
Initial reply
Response time (seconds)
Response Time Calendar (seconds)
Engage Inbox
Stories impressions
Stories reach
Number of automatically sent stories
Number of taps to next story
Number of taps to return to Stories
Number of people leaving Stories
Stories back swipes
Stories swipes down
Stories Next Swipe Count
Stories swipes up
Number of stories shared
Number of replies to stories
Stories completion rate
Stories profile visits
Total Stories Interactions
Total Stories profile activity
Story bio link clicks
Stories call clicks
Stories Directions Clicks
Stories email clicks
Stories and other clicks
Story text clicks
You can also filter by any relevant custom data attributes you have created . If applicable, you can select the data attribute from the dropdown.