Schedule PDF Reports
Schedule PDF Reports allows you to generate and deliver report PDFs to specified email recipients automatically. You can select the reporting period, set the frequency of delivery, and customize the report layout to fit your needs. Moreover, you can automatically deliver your report PDF to your stakeholders and clients using their email without giving them access to your Statusbrew account.
You can give access to an interactive version of the report using the Shared Links for Reports.
How to Create a PDF Report Schedule?
Navigate to the report you would like to schedule, on top right corner and select " Schedule”.
Click the Create schedule button.
Configure the schedule properties
Reporting period - Designated time frame for which data is collected, analyzed, and included in a report.
Last Week: This period includes data from the previous calendar week. This option is ideal for weekly performance assessments and trend analysis.
Last Month: This period includes data from the entire previous calendar month. This period provides a comprehensive overview of monthly performance, helping users to identify trends, patterns, and overall progress for the past month.
Last 7 Days: This period includes data from the last seven consecutive days, counting backward from the day before. This rolling period is useful for short-term performance monitoring and identifying recent trends and changes in metrics.
Last 30 Days: This period includes data from the last thirty consecutive days, counting backward from the day before. This period provides a broader view of recent performance, allowing users to analyze trends and patterns over approximately a month-long span.
Reporting frequency - Determines how often a report is generated and delivered based on the selected schedule.
Daily: Reports are generated and sent every day at 17:00 UTC, providing up-to-date data and insights to monitor performance on a daily basis. This option is ideal for closely tracking changes and making quick adjustments.
Weekly: This frequency is suitable for periodic performance reviews and identifying weekly trends. Weekly reports are generated and sent every Tuesday.
Bi-weekly: Reports are generated and sent every two weeks on Tuesday at 05:00 UTC. This option is useful when you want regular updates without having to send reports every week.
Monthly: This option is best for long-term analysis and strategic planning based on monthly performance.
Internal Recipients - Select team members from your organization who have access to your Statusbrew account. You can also select User Groups.
External Recipients - Enter email addresses of your stakeholders, clients or team members who do not have access to your Statusbrew account.
PDF Layout - Select the representation of your individual widgets in the PDF
Stack View - Each widget is displayed on a separate page, utilizing the full width of the page for better readability. For tabular widgets, content can span across multiple pages to ensure all data is visible and well-organized.
Grid View - Widgets are arranged in a layout similar to how they appear in the report dashboard, allowing multiple widgets to be displayed on a given page in a structured, 4x3 grid-like format.
Additional options - Add a clear, descriptive subject line to help the recipients understand what the report contains. Use the email body to highlight key takeaways, flag trends, or highlight campaign results without needing to send a separate follow-up email.
Save your settings and activate the report schedule. Your reports will now be delivered automatically according to your configuration.
For weekly and monthly schedule reports, the day of the week is Tuesday. User preference for timezone is not supported.
Scheduled report notification
Scheduled reports will be sent to specified users/user groups and external participants via email at the intervals you specify.
An email like this will be sent at 05:00 UTC time, with the report PDF attached.
Benefits and Practical Applications
Team Updates:
Ensure all team members receive the latest performance data daily, weekly, or monthly.
Save time and keep everyone aligned with consistent information.
Automated PDF reports eliminate manual labor, allowing the team to focus on analysis and strategy.
Stakeholder Communication:
Keep external stakeholders informed with regular, automated updates.
Promote transparency and build trust through timely and accurate reporting.
PDFs are in a ready-to-present format, making it easy to share insights directly.
Performance Monitoring:
Track campaign performance consistently without the need for manual report generation.
Allow for quicker adjustments and more responsive management.
Automated delivery ensures no data is overlooked, providing comprehensive insights regularly.
Custom Layouts:
Use stack or grid layouts to present data in the most readable format.
Enhance the usefulness and clarity of the reports based on the audience's needs.
Remove the effort of designing reports, making it easy to create visually appealing documents effortlessly.
How to Manage Report Schedules?
Report Schedules can be edited or deleted at any time from the Schedule Page of the target Report.
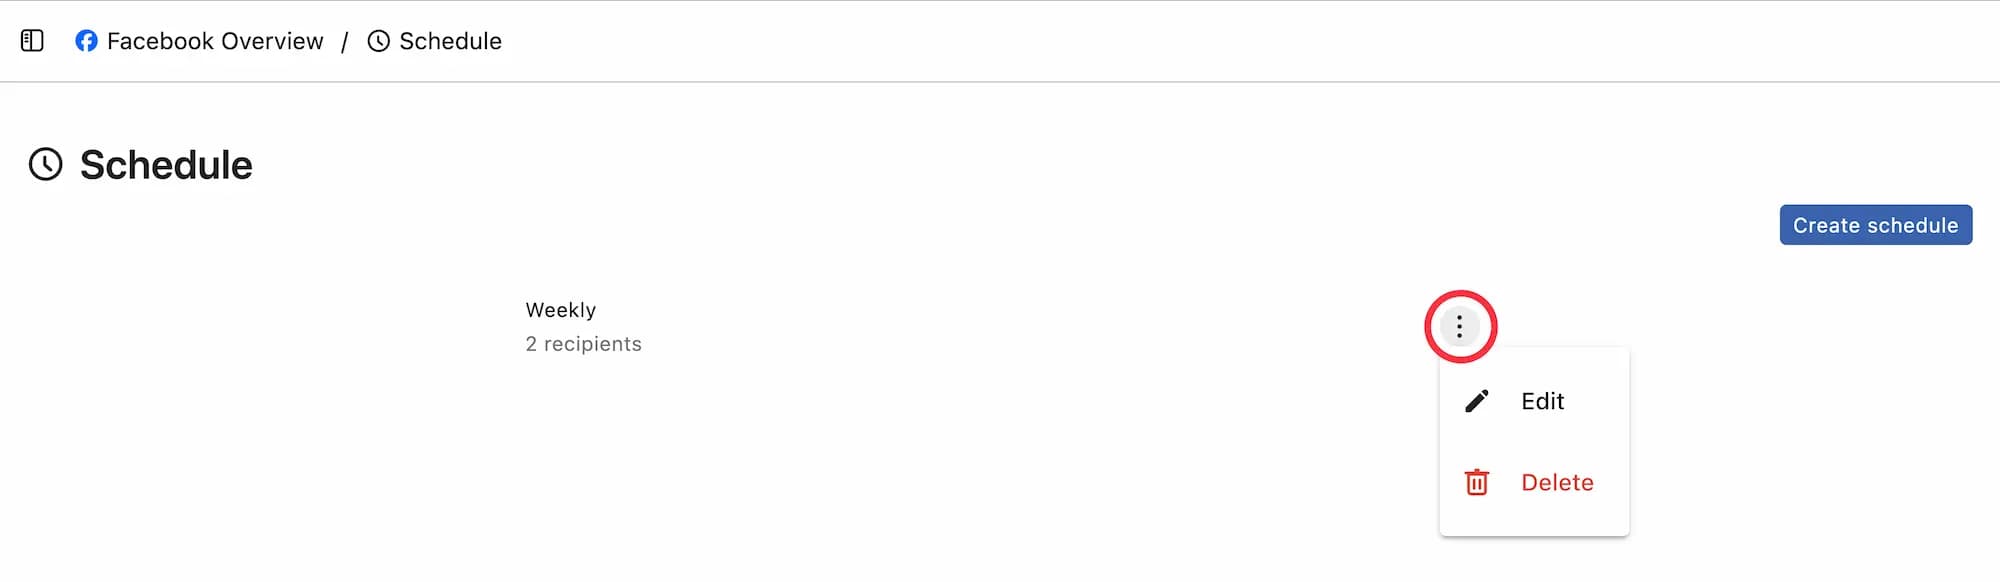
Edit a schedule
To update the properties of a schedule, click on the icon and select Edit.
Delete a schedule
If a Report Schedule is no longer needed, remove it by clicking on the button and selecting Delete.
FAQs
Do I have to give access to our Statusbrew account to share reports with clients?
No, clients do not need access to your Statusbrew account. They can be added as external recipients so they can receive the reports directly.
Can I schedule reports for custom periods?
Currently, the feature supports predefined periods like Last Week, Last Month, etc.
Can I setup daily, weekly and monthly schedule for the same report?
Yes, you can create multiple schedules with different schedule properties like reporting frequencies and reporting periods to your requirements.
A good use case is to setup a daily schedule for your team and a weekly or monthly schedule for your stakeholders or clients.
How can I share a live report link with my clients?
Schedule PDF Reports generates and emails a snapshot of a report at a regular frequency and sends it to your team, clients or stakeholders as a PDF. If you would like to share a live link to your report, you can use our Shared Links for Reports.
Troubleshooting
My client didn’t receive the scheduled report
Verify Email Addresses: Ensure that the email addresses entered for the recipients are correct.
Check Spam/Junk Folder: Ask the recipients to check their Spam or Junk folder, as emails from @statusbrew.com might have been incorrectly filtered.
Whitelist Statusbrew: Instruct the recipients to add the Statusbrew email address to their whitelist or safe sender list to prevent future emails from being blocked.
Email Blockers: Confirm that the recipients' organization does not have an email blocker that might prevent emails from @statusbrew.com from being received. If necessary, ask their IT department to whitelist the Statusbrew domain.
Incorrect Data
Verify that the correct reporting period and data sources are selected.
Layout Issues
In the Grid View, you can organize widgets into a 4x3 grid, which allows for a clean and structured report layout. This means you can place up to three rows of widgets per page, with each row accommodating a maximum of four widgets.
Widget Arrangement: Place up to 12 widgets on each page, arranged in three rows of four.
Overflow Management: If a widget doesn’t fall within the bounds of the 3-rows of a page, they will automatically spill over to the next page.
Dashboard Visualization: Visualize your report dashboard as multiple pages, each with three rows. Adjust the height of your widgets to ensure they fit neatly within a single page.
Why is my report PDF export failing or showing a server error?
PDF export can fail or show a server error if the report is too heavy to generate. This can happen when the report spans a large date range, has too many widgets, or experiences browser session/cache issues.
If PDF export fails, try these steps:
Use a shareable report link instead If a PDF is not required, create a shareable link to the report and send it to your team or client.
Reduce the report date range Open the report calendar and select a shorter date range. Large date ranges can make the report heavy and may cause the PDF export to fail.
Reduce the number of widgets If the report has many widgets, try removing a few or duplicating the report, keeping only the widgets you need before exporting.
Refresh your browser session Clear Statusbrew's cache and cookies, reset local storage if needed, then log in and try exporting again.
If the issue persists, contact the Statusbrew team via live chat and share the report name, selected date range, and the error message displayed during export.