Relationship between dashboards and widgets
StatusbrewAll data in Analytics is organized into entities called Spaces.
As different entities existing within this space,
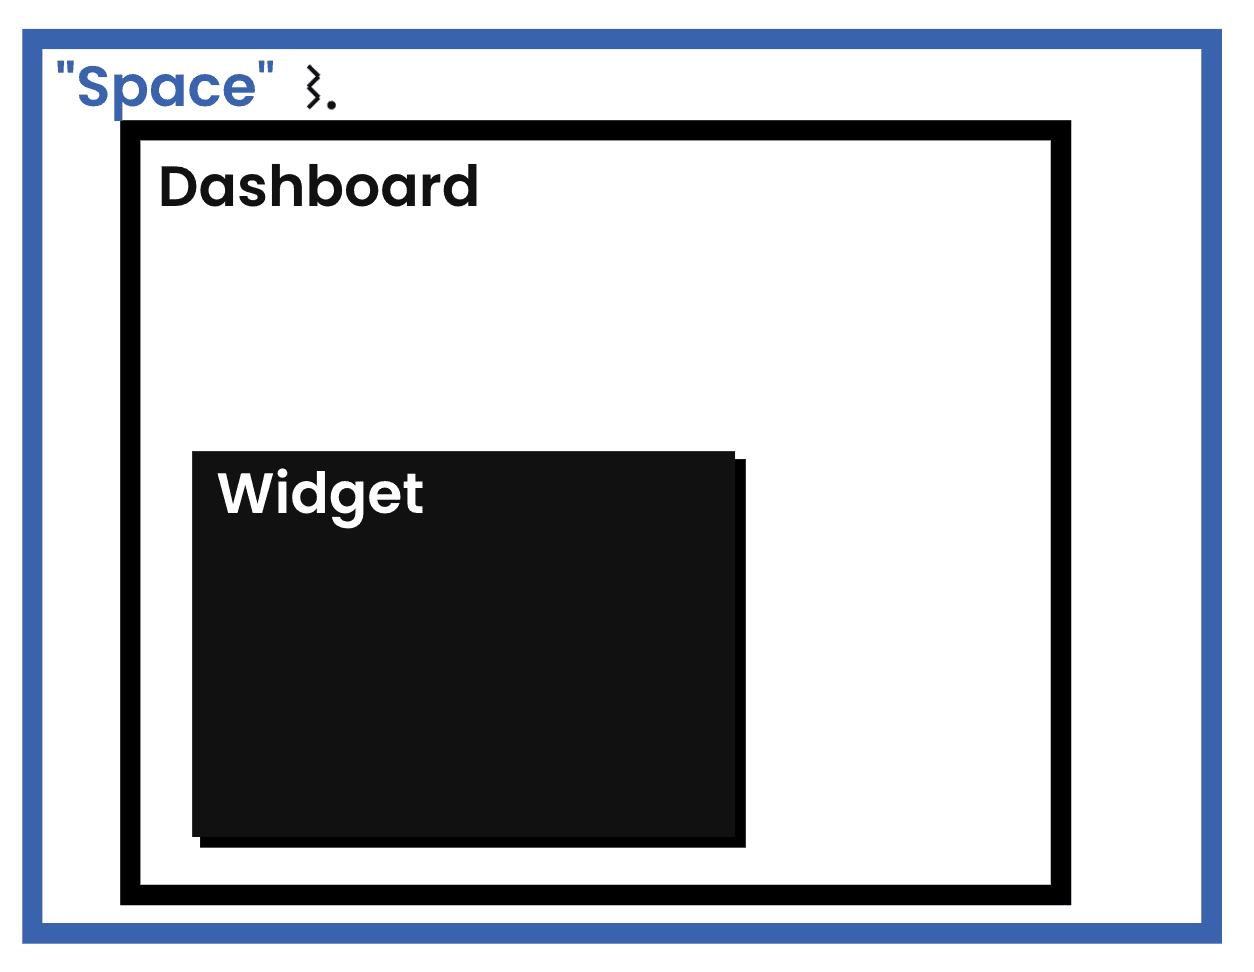
Dashboard
Widgets
exists.
Workspace in Statusbrew - "Space"
Statusbrew offers Spaces to help businesses and brands flexibly manage social media for their businesses and multiple brands.
Learn more about the space here
Space refers to the unit of workspace in which you work.
The social media profiles you connect to within a space are the analytical resources, so if you manage different businesses or brands in each space, you won't be able to report on data across all your businesses.
If you want to compare your business or brand's performance on the same dashboard, you need to connect all your social profiles in one place.
You can have one or more spaces in your account, and they can be owned by you or shared with you by other users.
Dashboard
A dashboard is a reporting unit that aggregates your reports onto a single page, giving you an at-a-glance view of the key metrics you want to track. Statusbrew provides dashboards with a simple, intuitive drag-and-drop interface that lets you create one in minutes.
The items listed on the left in the screenshot below are dashboards (report units). You can freely move between dashboards at any time by clicking on the reports you created on the left.
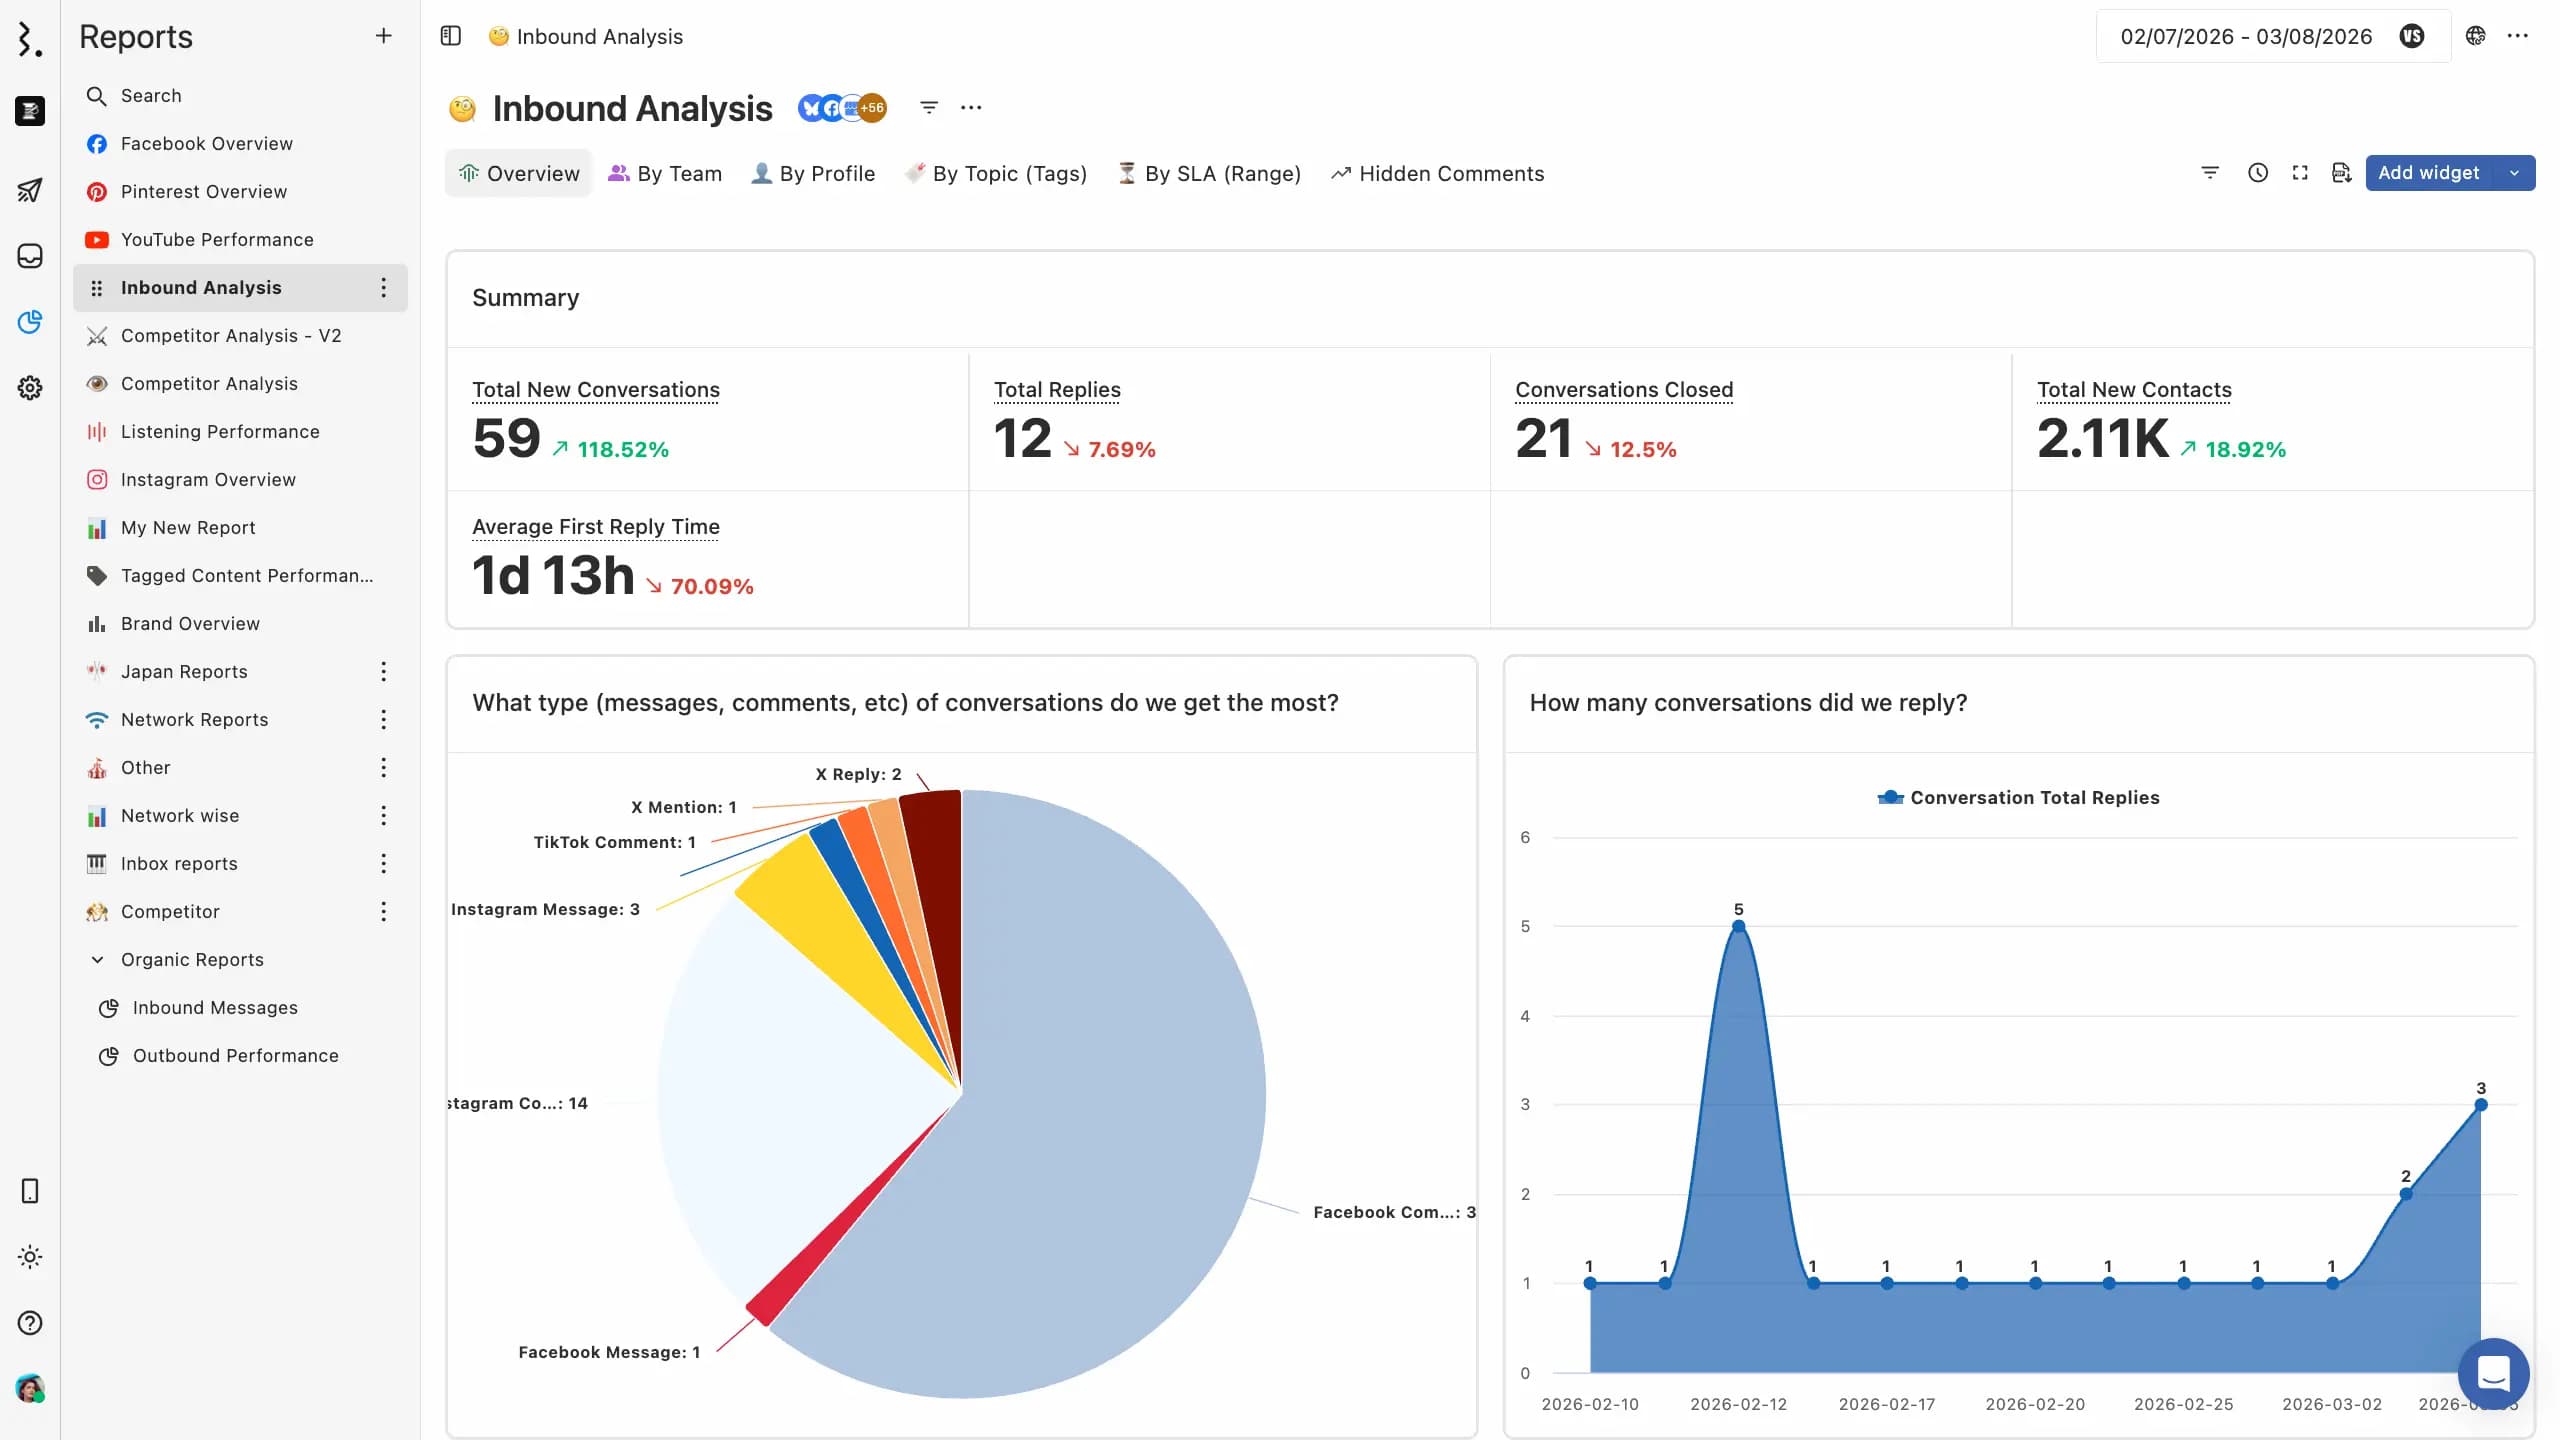
You can create visually interactive dashboards by adding widgets to a layout.
Widgets
Widgets are the units of data displayed within the dashboard (=report) above. They contain the actual data you need to analyze.
A widget has a name and a data type associated with it, and you can create multiple widgets to compare two or more different data types.