Totals, averages, and percentages in reports
The analytics feature offers over 250 metrics, some of which let you choose whether to display values as totals, averages, or percentages.
This article explains the difference between total and average values, how to change the settings, and when to use them.
Types of calculation methods
Statusbrew offers three ways to calculate a metric's value: Sum, Average, and Percentage.
The calculation method applied varies depending on the indicator. Some indicators have a fixed calculation method, while others allow you to choose either calculation method.
Total value only (SUM): Example: Number of followers acquired
Average value only (AVG): Example: Average rating
Sum or average value can be selected (SUM/AVG): Example: Post reach
Sum or percentage options (e.g., Instagram profile comments)
Items that do not display totals or averages*: e.g., YouTube viewership
If a calculation method is not displayed, it means that there is only one calculation method (rate, unit price, etc.). The calculation method appropriate for that metric is automatically applied.
The difference between totals, averages, and percentages
First, let's look at the difference between totals, averages, and percentages. They are the same as general totals, averages, and percentages.
Sum: The sum of the metric's values over the specified time period.
Average value: The average value of the metric over the specified time period.
Percentage: The total for the specified period is 100%, and when a dimension is added, each parameter is shown as a percentage.
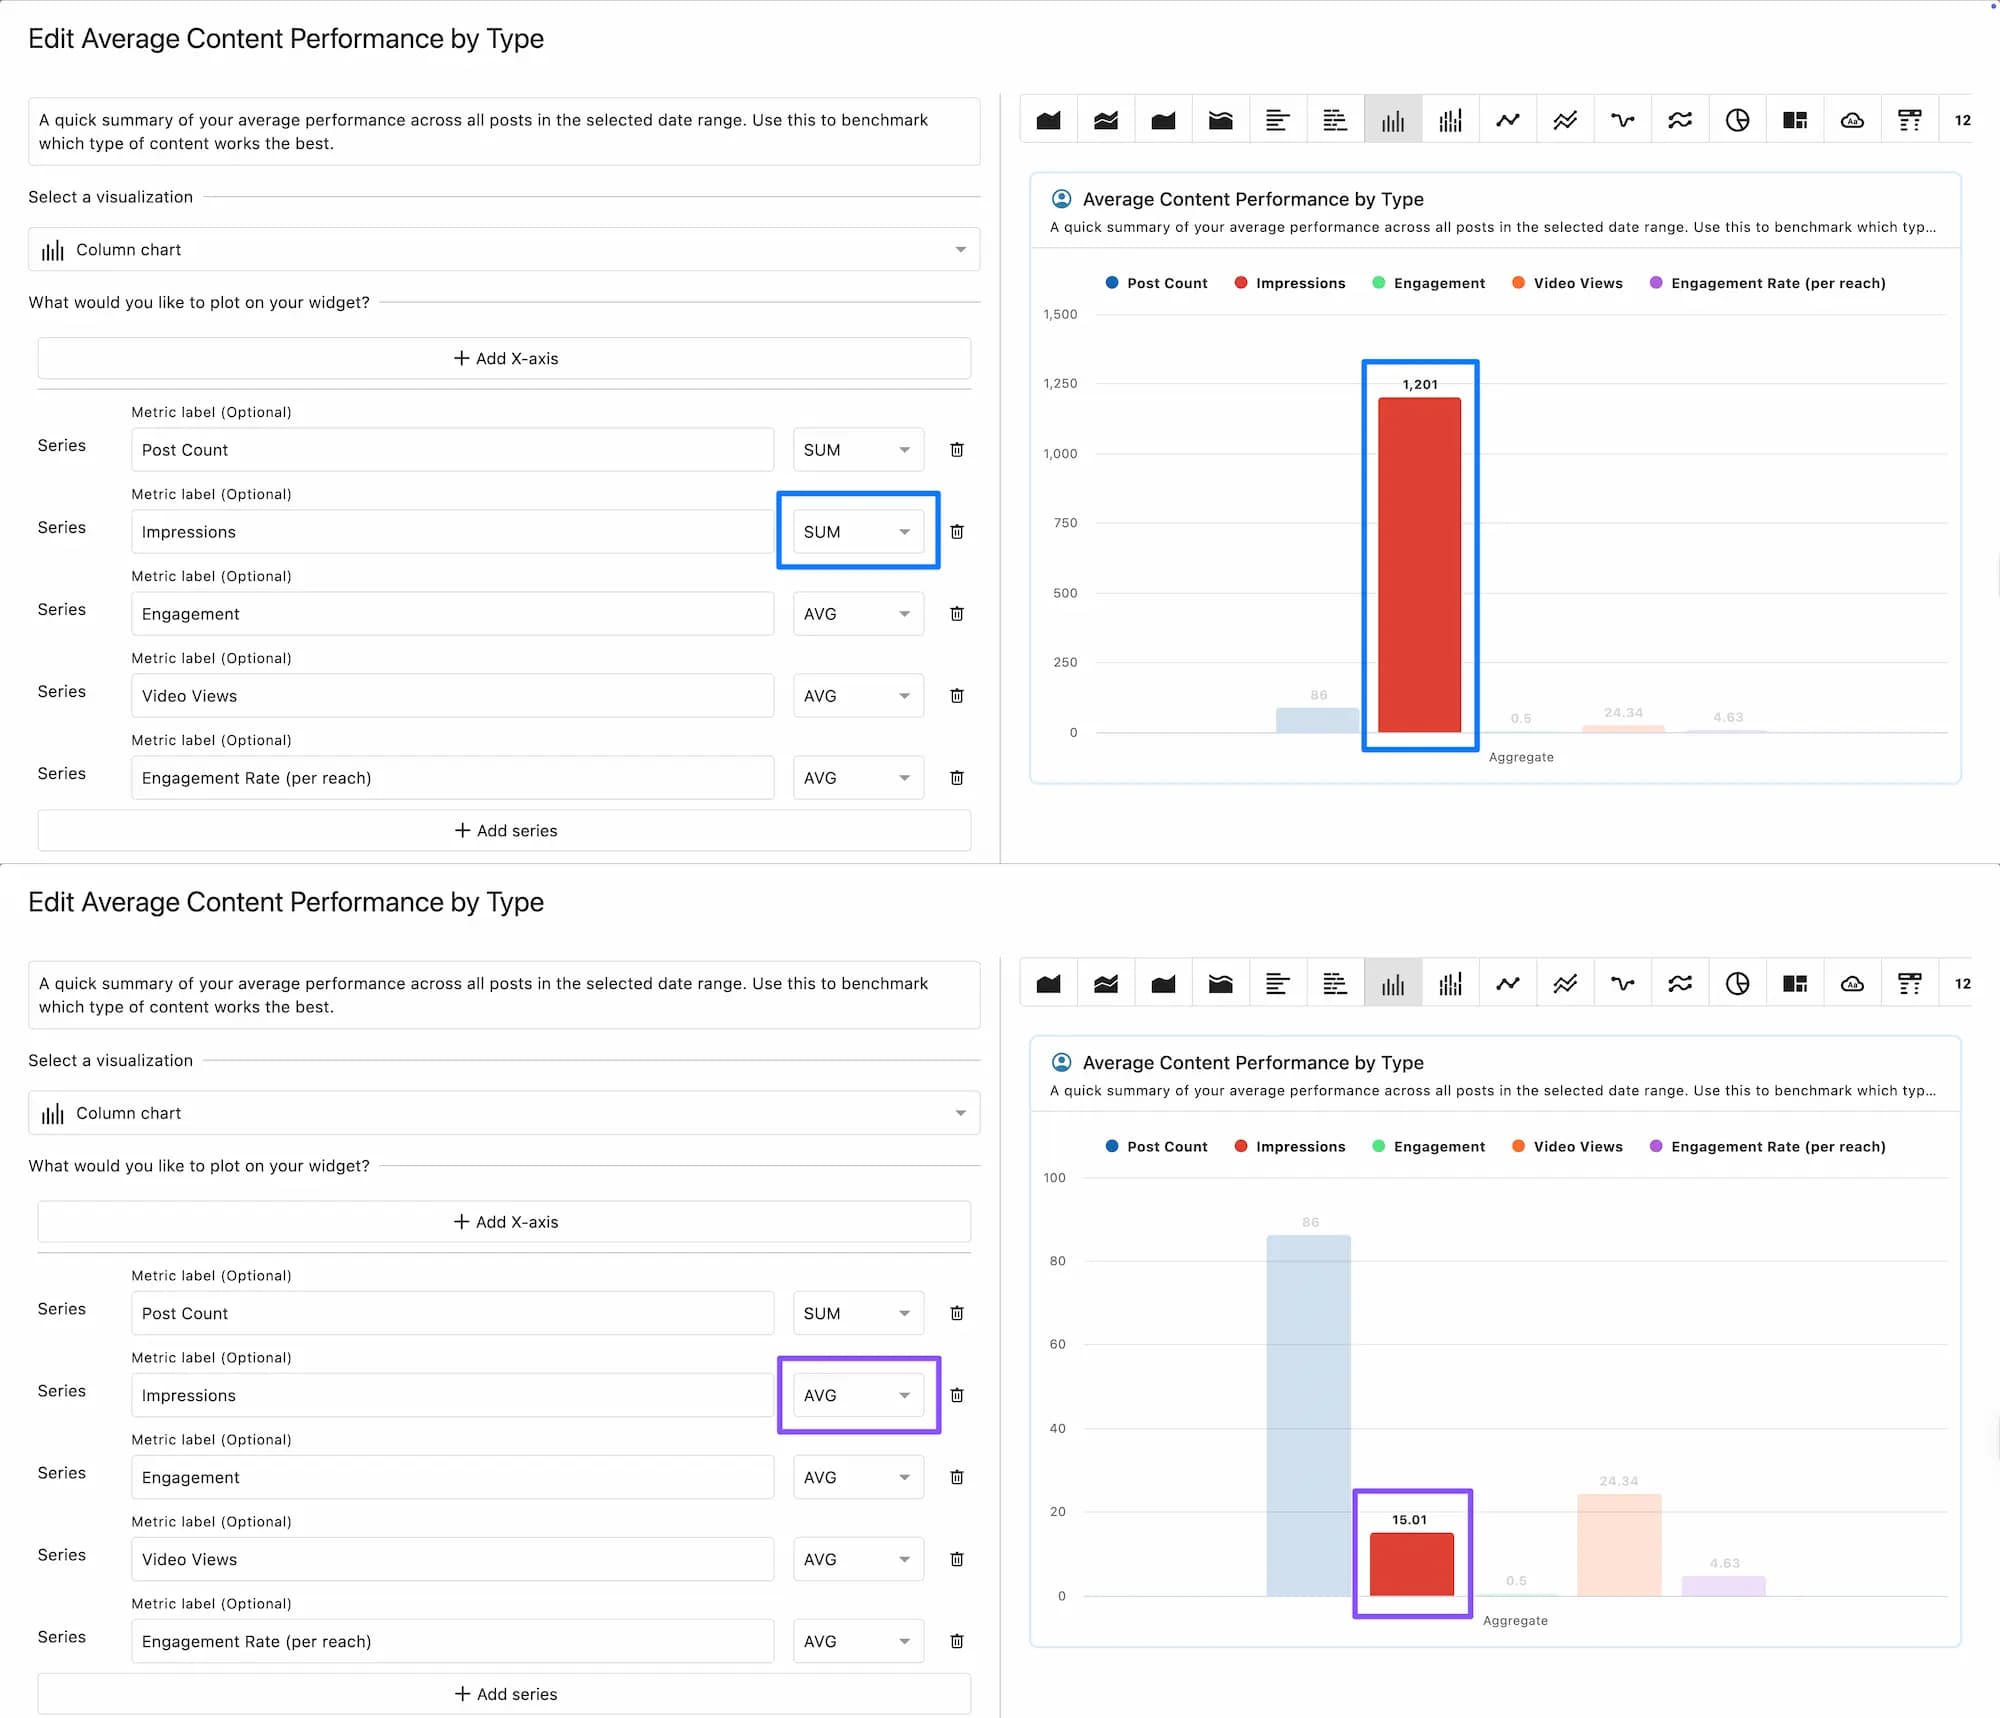
Difference Between Sum and Average
Some metrics let you choose between total and average, but most are post-related. Let's take "Post Reach" as an example to see the difference between total and average.
Example: If you published a total of 11 posts between August 1st and 10th, the total post reach is 10.
For sums: the value is 10
Average value: 0.91 (10 ÷ 11 ≒ 0.91, calculated by dividing the total post reach by the number of posts. *The actual calculation may be more complicated.)
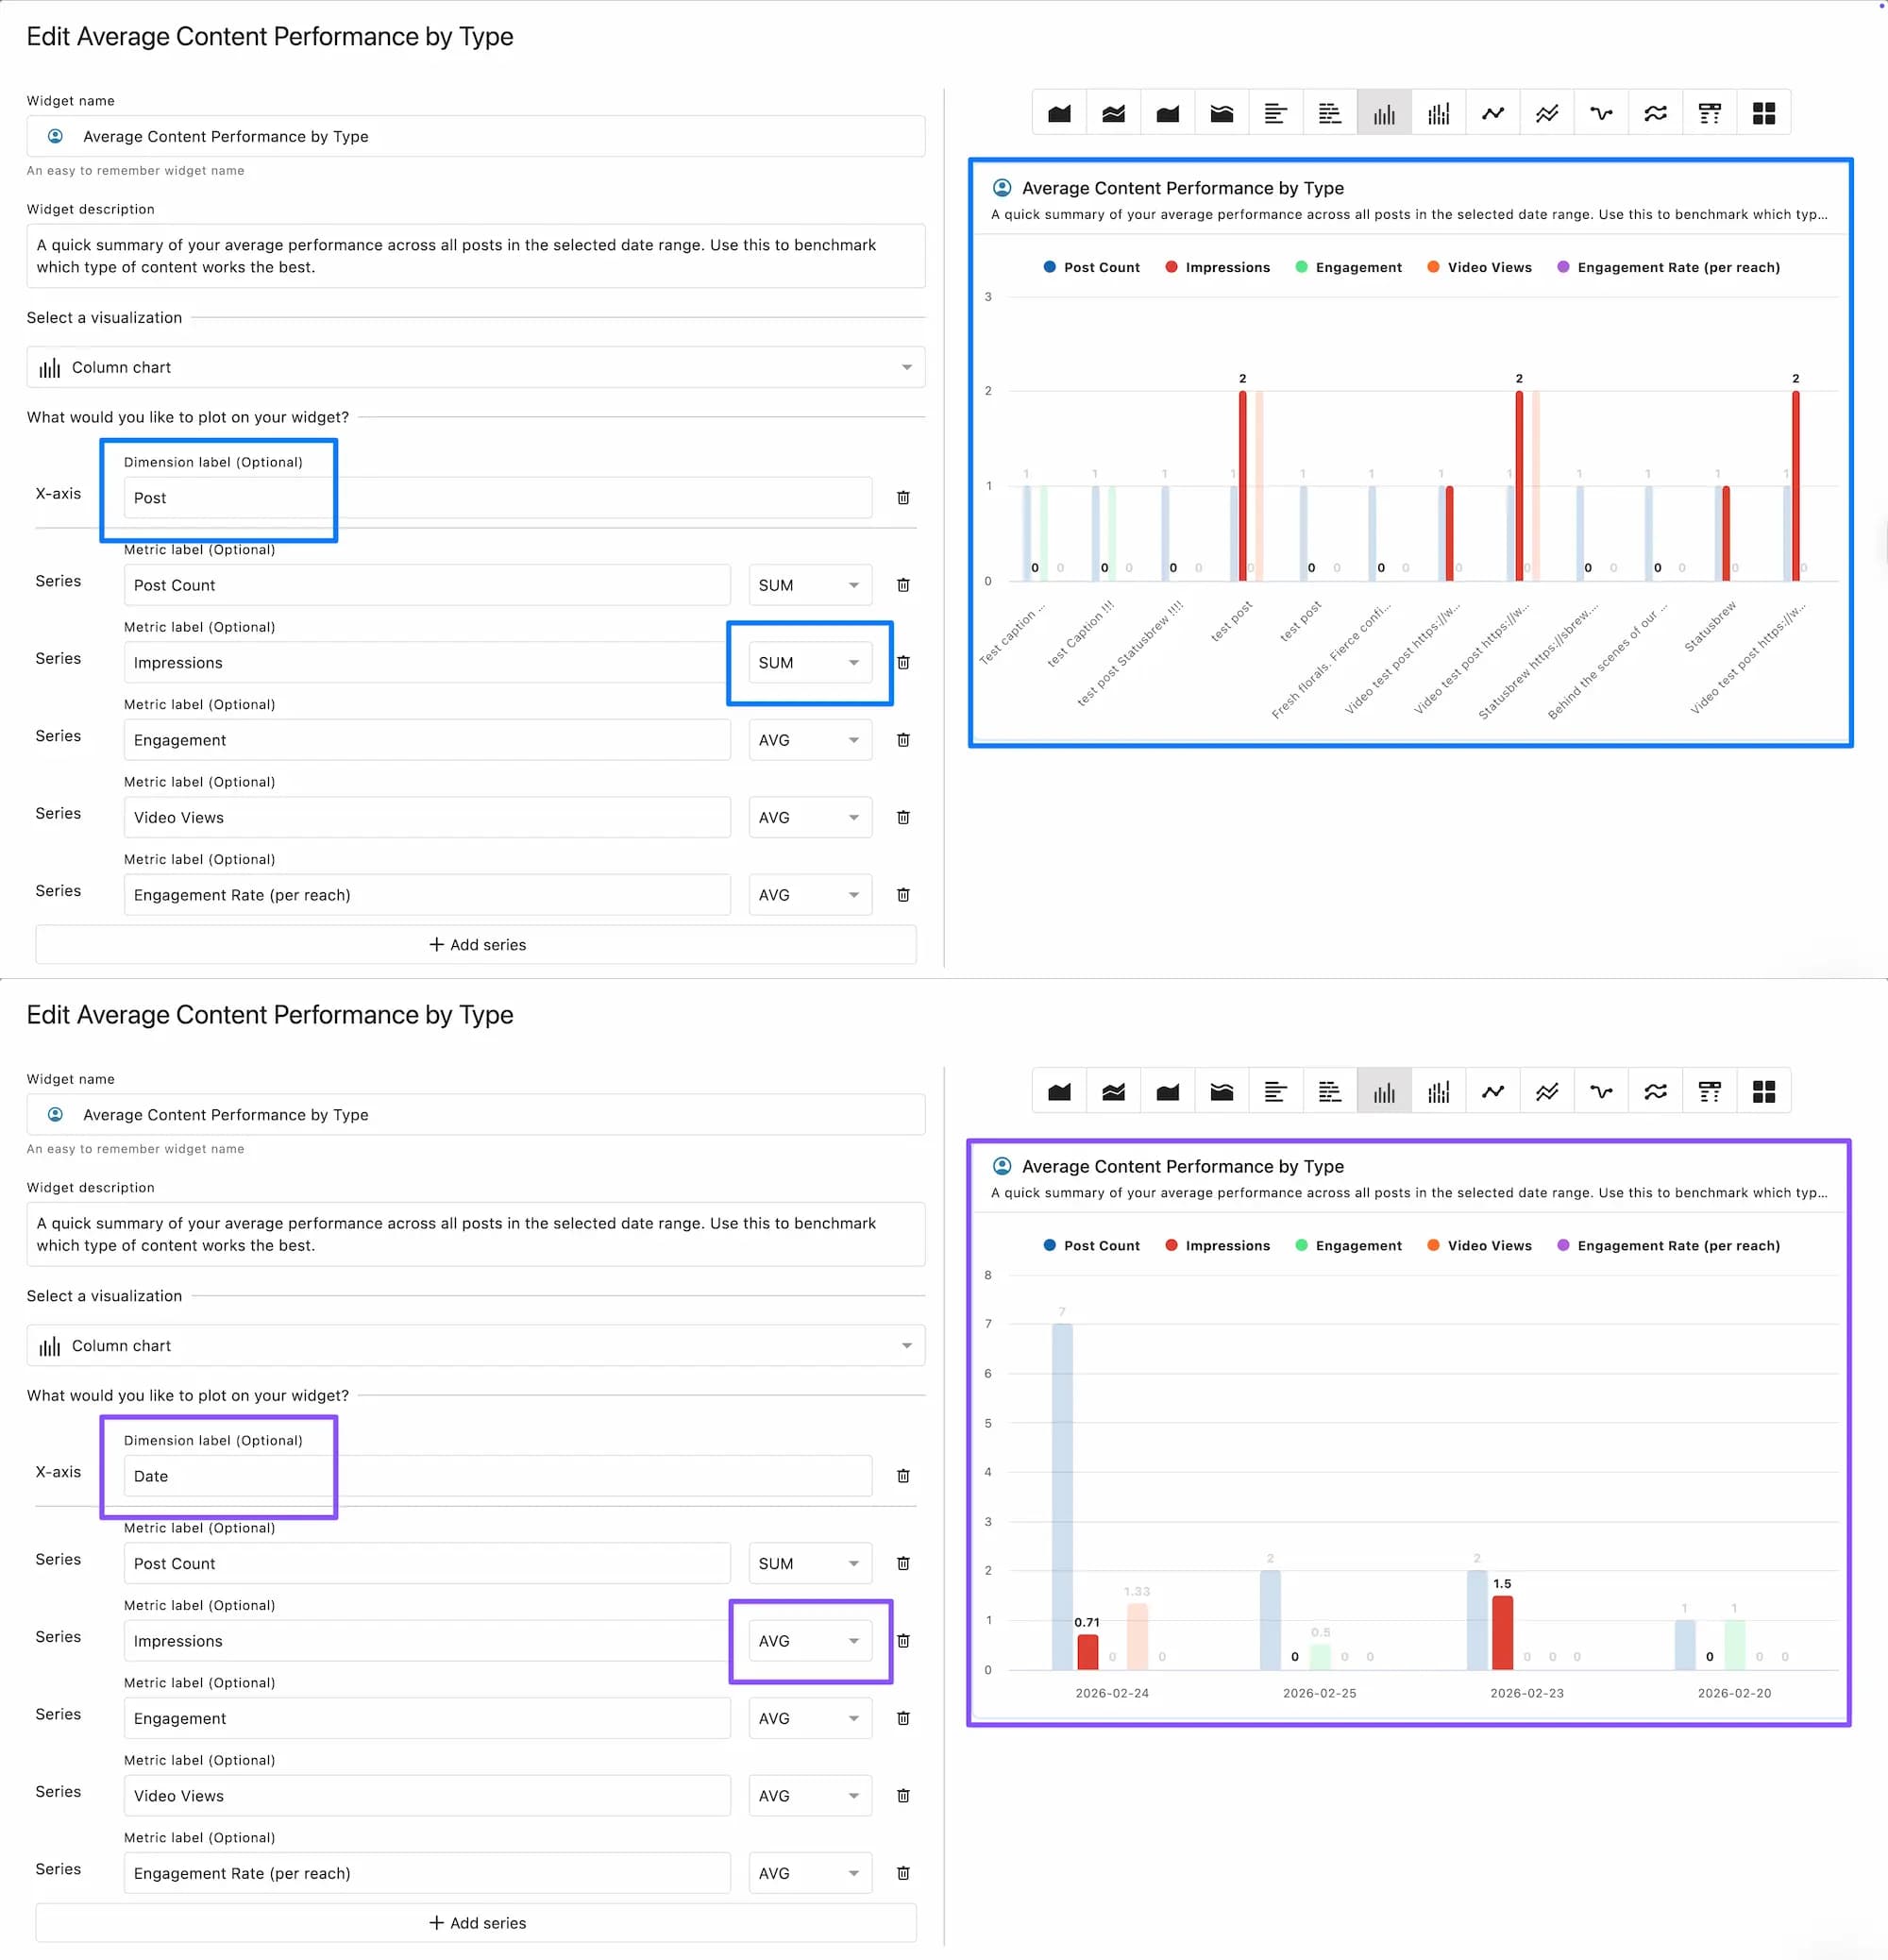
With both totals and averages, you can add dimensions to increase the granularity of your data.
For example, adding "Post" as a dimension will show the number of reaches per post, and adding "Date" will show the total or average number of reaches per day (for the average, it will be the number of reaches per post divided by the number of posts per day).
Using sums and averages
Many of the metrics for which you can select total/average are post-related metrics, competitor-related metrics , and some Instagram Stories-related.
Each has the following characteristics and can be used for different purposes.
Total Value: This helps provide an overall picture. It's also effective for understanding campaign results and for seeing at a glance whether your goals have been achieved. However, it's not suitable for comparative analysis because it depends on the number of posts and the period.
Average values: Suitable for comparing different conditions (e.g., comparing post reach during the day and at night, or comparing post impressions by day of the week). This is useful for checking efficiency and identifying areas for improvement when you want to achieve consistent results under different conditions. However, it has the disadvantage that it is difficult to detect sudden increases or abnormal values because it does not highlight them.
The difference between percentages and totals/averages
Some metrics let you choose between percentage and total, or between percentage and average.
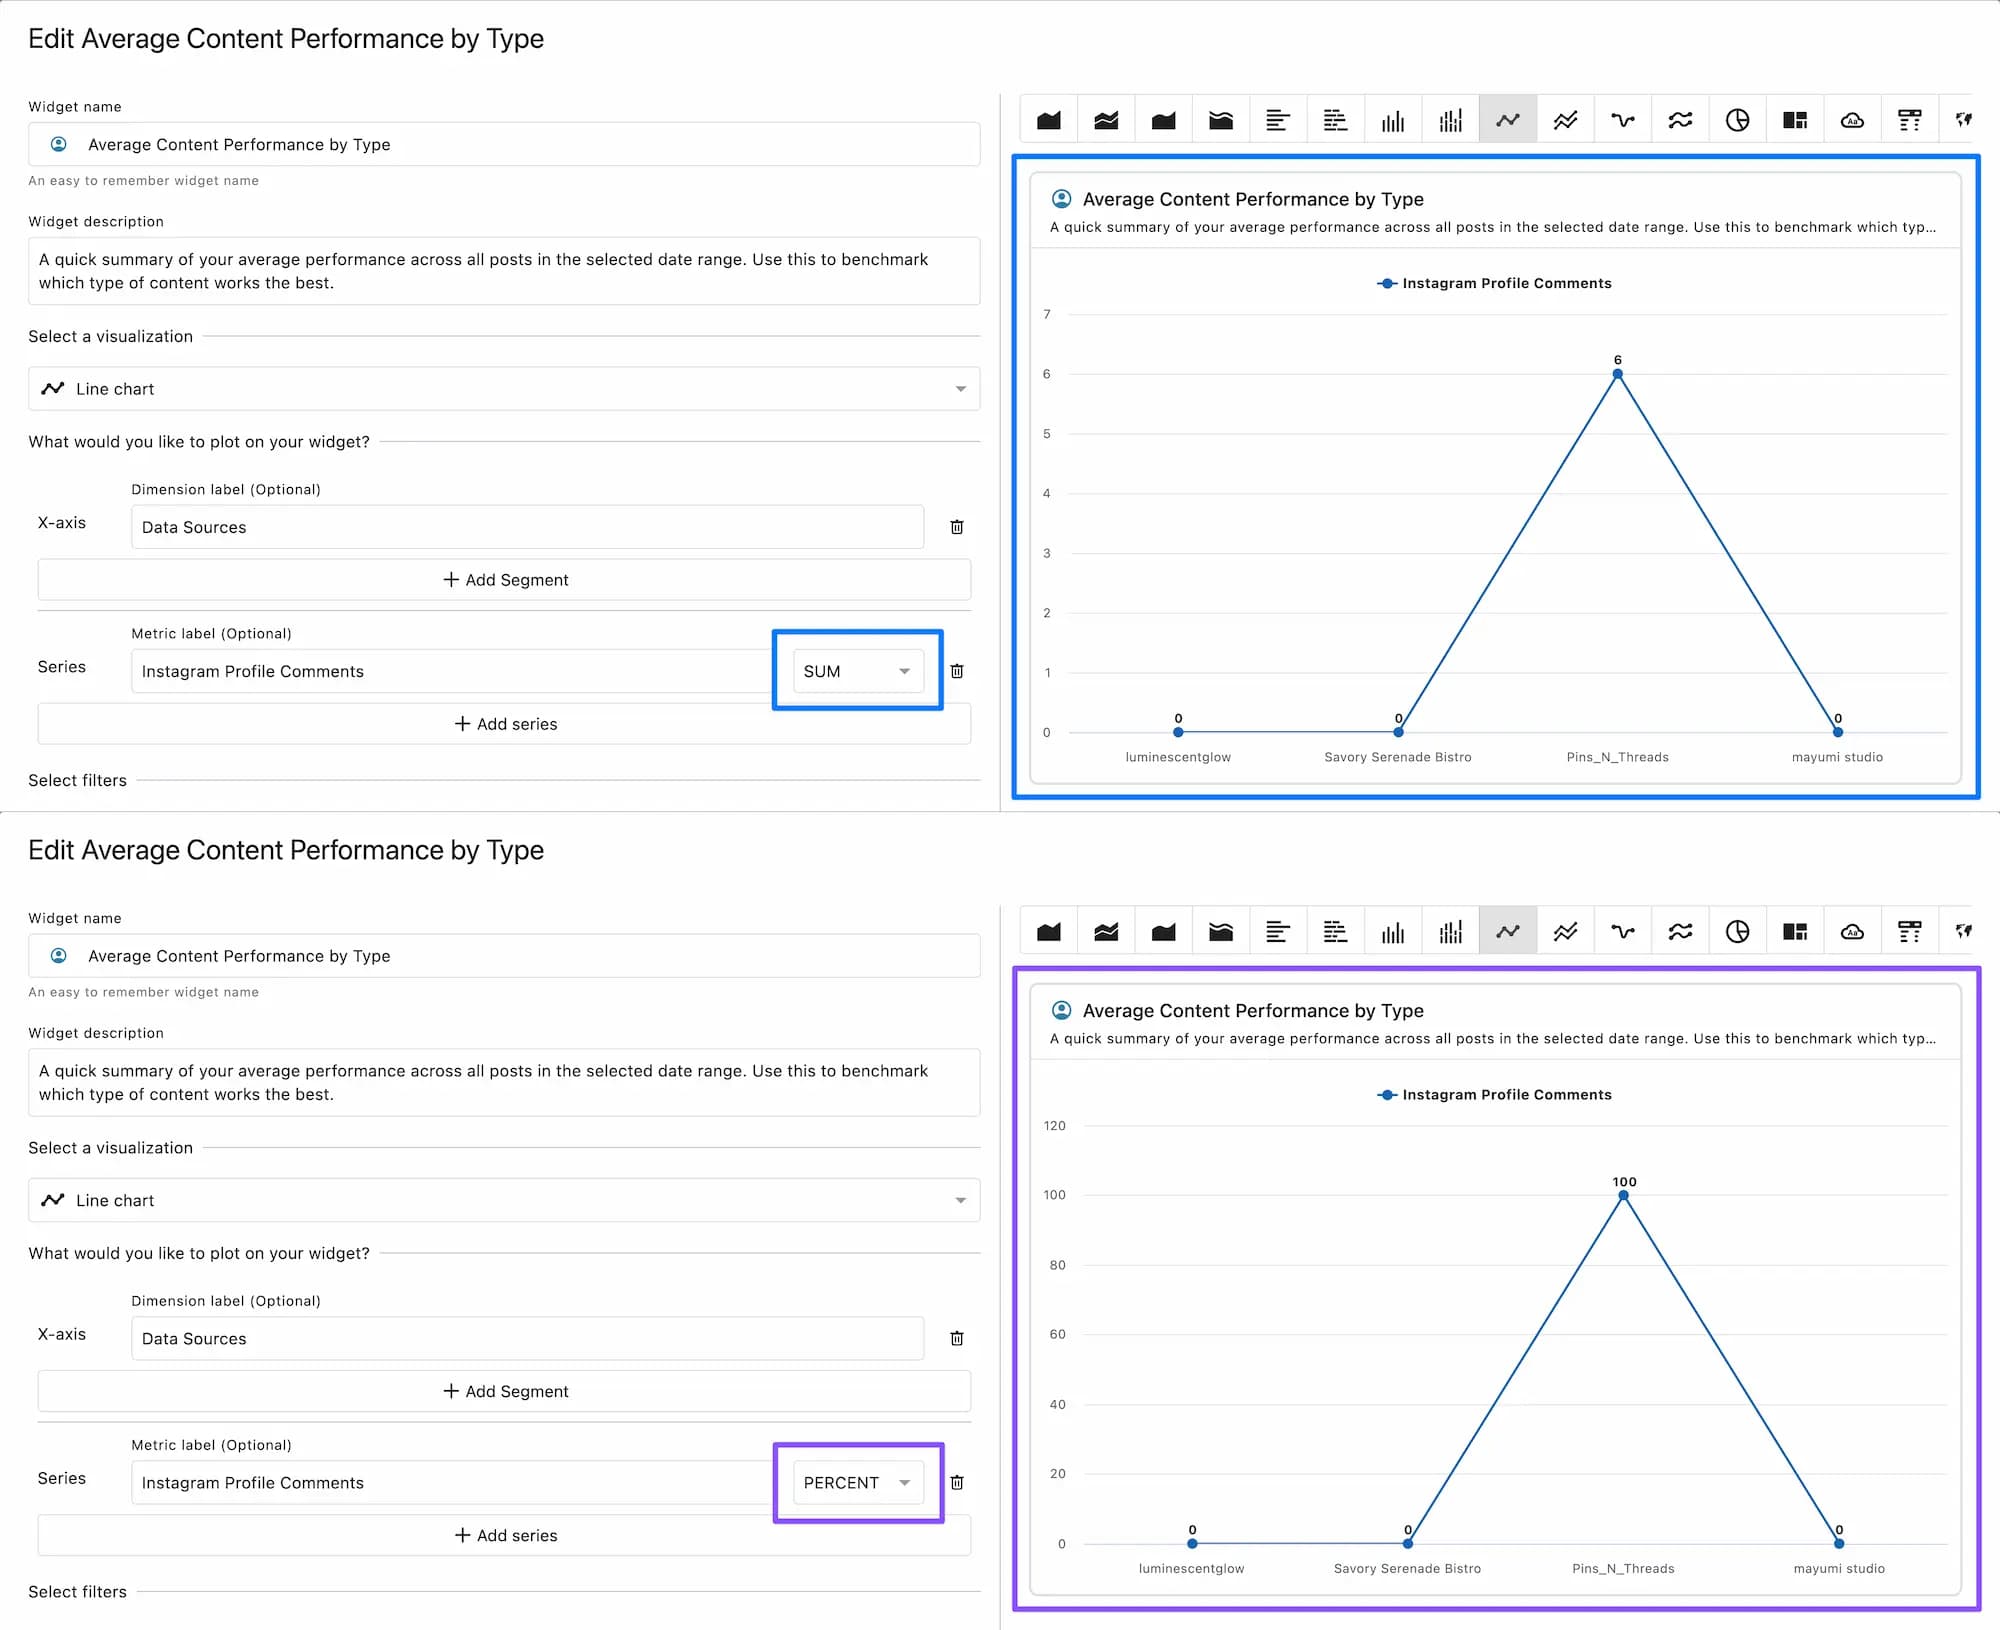
Let's take the example of "Instagram Profile Comments," where you can choose either percentage or total.
Example: From August 1st to 31st, there were 3 comments on your Instagram profile (1 on Reels and 2 on Stories).
The total value is 3, but adding "Content Type" as a dimension gives Reels: 1, Stories: 3
As a percentage, the value is 100 (%). When adding "Content Type" as a dimension, Reels is 33.33 (%), and Stories is 66.67 (%).
In this way, the total value represents the specific number of each parameter (the element added as a dimension), while the percentage shows the proportion of each parameter to the whole.
Using percentages and totals/averages
The ratio has the following characteristics:
Percentage: Suitable for understanding the composition ratio of the whole. (Example: Showing the percentage of Facebook page fans for each data source.) However, since percentages are relative to a population, they can be misleading when the population is small.
While the total and average are both absolute values, the percentage is a relative value. Both values are essential for analyzing social media performance, but even a large value like 80% can yield different results depending on whether the population is 10 or 1,000.
Percentages are useful for checking details and breakdowns, but you should be careful when using them alongside totals and averages.
Summary of usage
Total value: ➕ Understanding the overall picture ➖ Not suitable for comparison
Average value: ➕ Comparison under different conditions ➖ Unable to notice outstanding values
Percentage: ➕ Understanding the composition ratio to the whole ➖ Not suitable for large-scale analysis as it is a relative value to the population
For example, when reporting campaign results to a client, you can use totals to show overall performance, averages for detailed analysis, and percentages for specific examples to create a high-quality report.
As you can see, the totals, averages, and percentages have different properties, and it is not easy to combine them yourself within a limited amount of time.
That's why Statusbrew offers template widgets.
Template widgets are pre-configured with the metrics and dimensions you need to analyze a variety of topics, including top posts by network, sentiment ratios by keyword, and content performance by tag.
If you want to change from the average value to the total value, you can easily do so by following the steps below.
Change how values are calculated
You can change the metrics that have calculation options when you create or edit the widget.
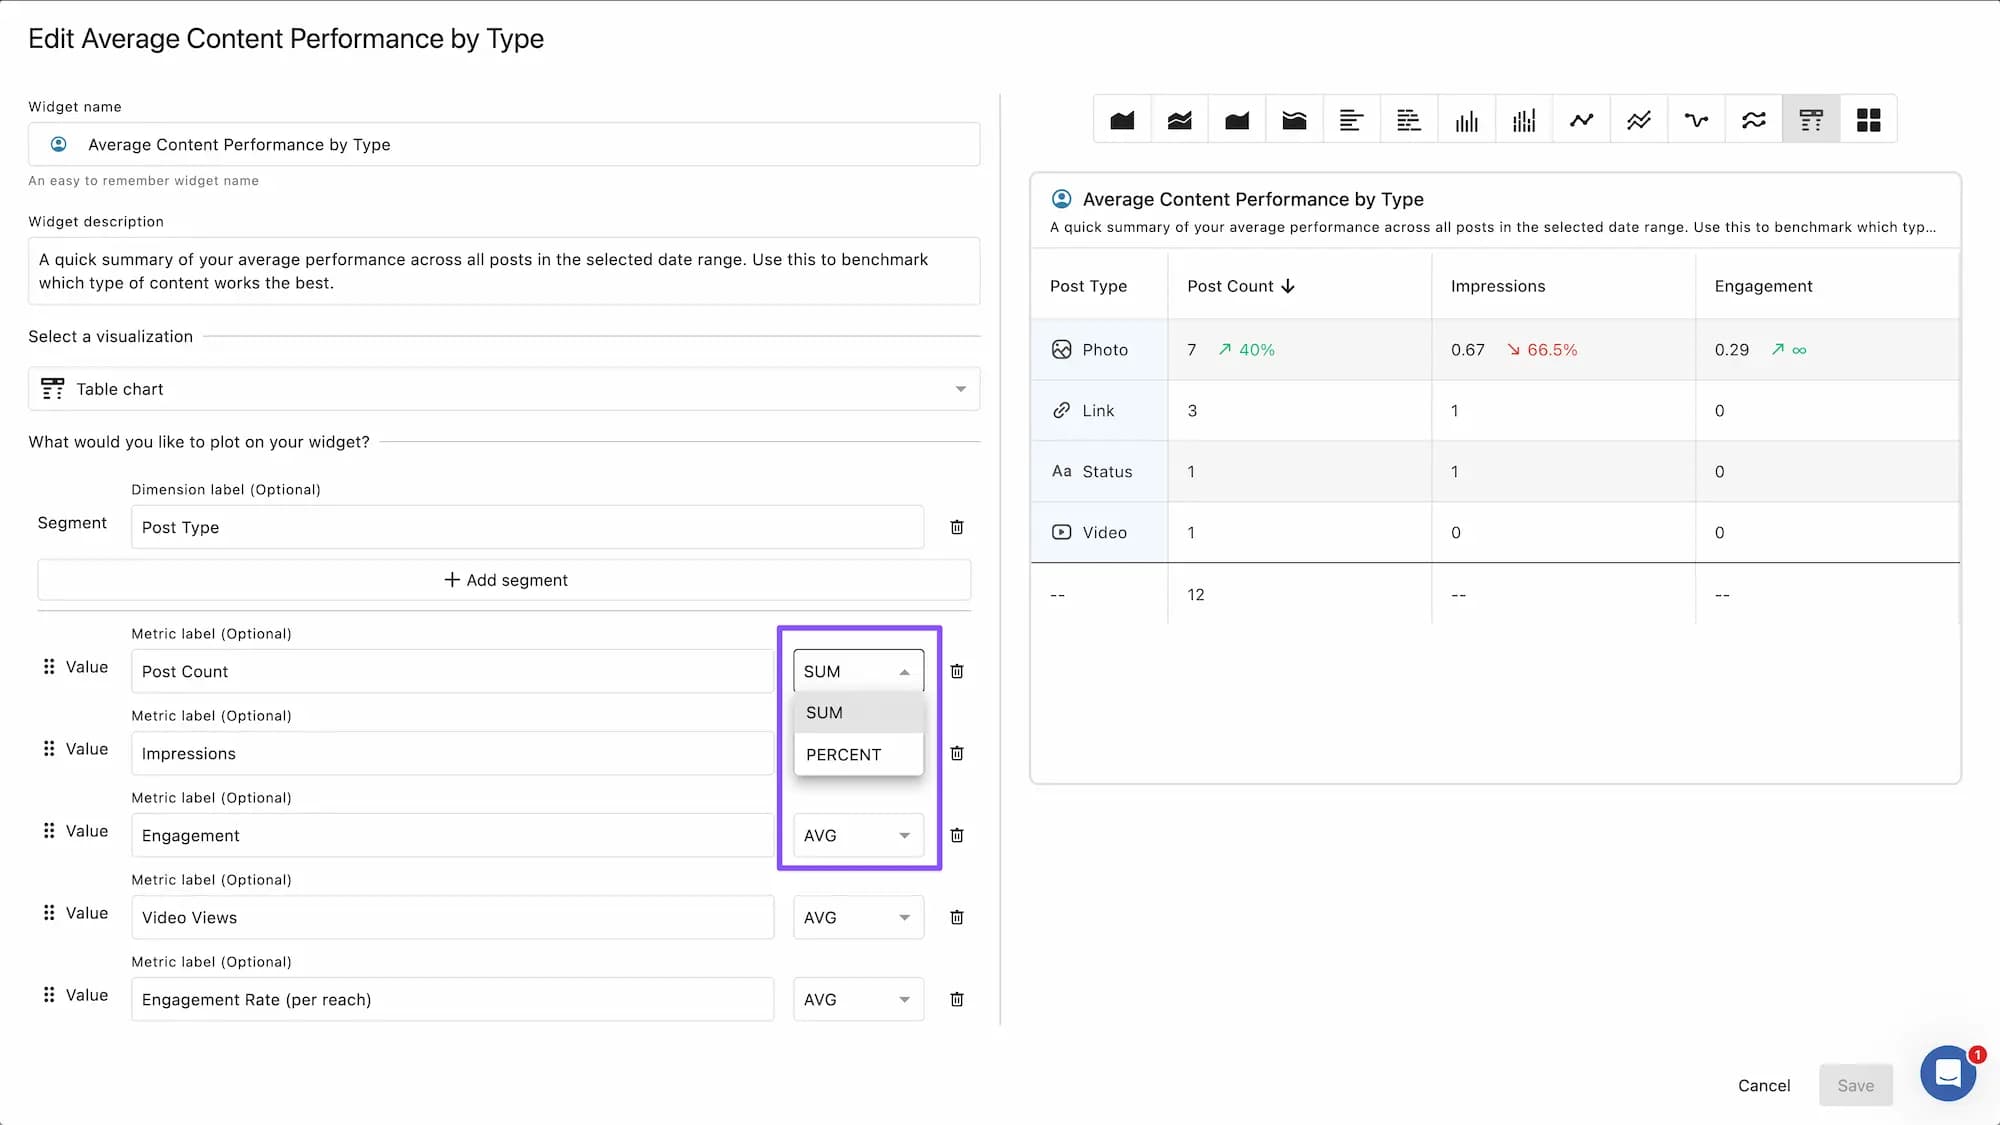
When creating a widget, you can select "SUM", "AVG", or "PERCENT" from the dropdown to the right of the metric name ( the options displayed will vary depending on the metric).
To modify a widget you've already created: Click the three-dot menu in the top right corner of the widget. Click >Widget Settings > Select "SUM", "AVG", or "PERCENT" from the dropdown menu to the right of the indicator name.