Data comparison in reports
Statusbrew's analytics reports allow you to compare data across different time periods.
Setting the comparison period
In the top right corner of the report screen.
Select the time period for the data you want to extract. You can choose an optional period (Last 7 days, Last 30 days, etc.) or a custom period.
Select a comparison period. You can compare with the previous data for the same period you selected above, or you can choose a custom period.
How to read the data
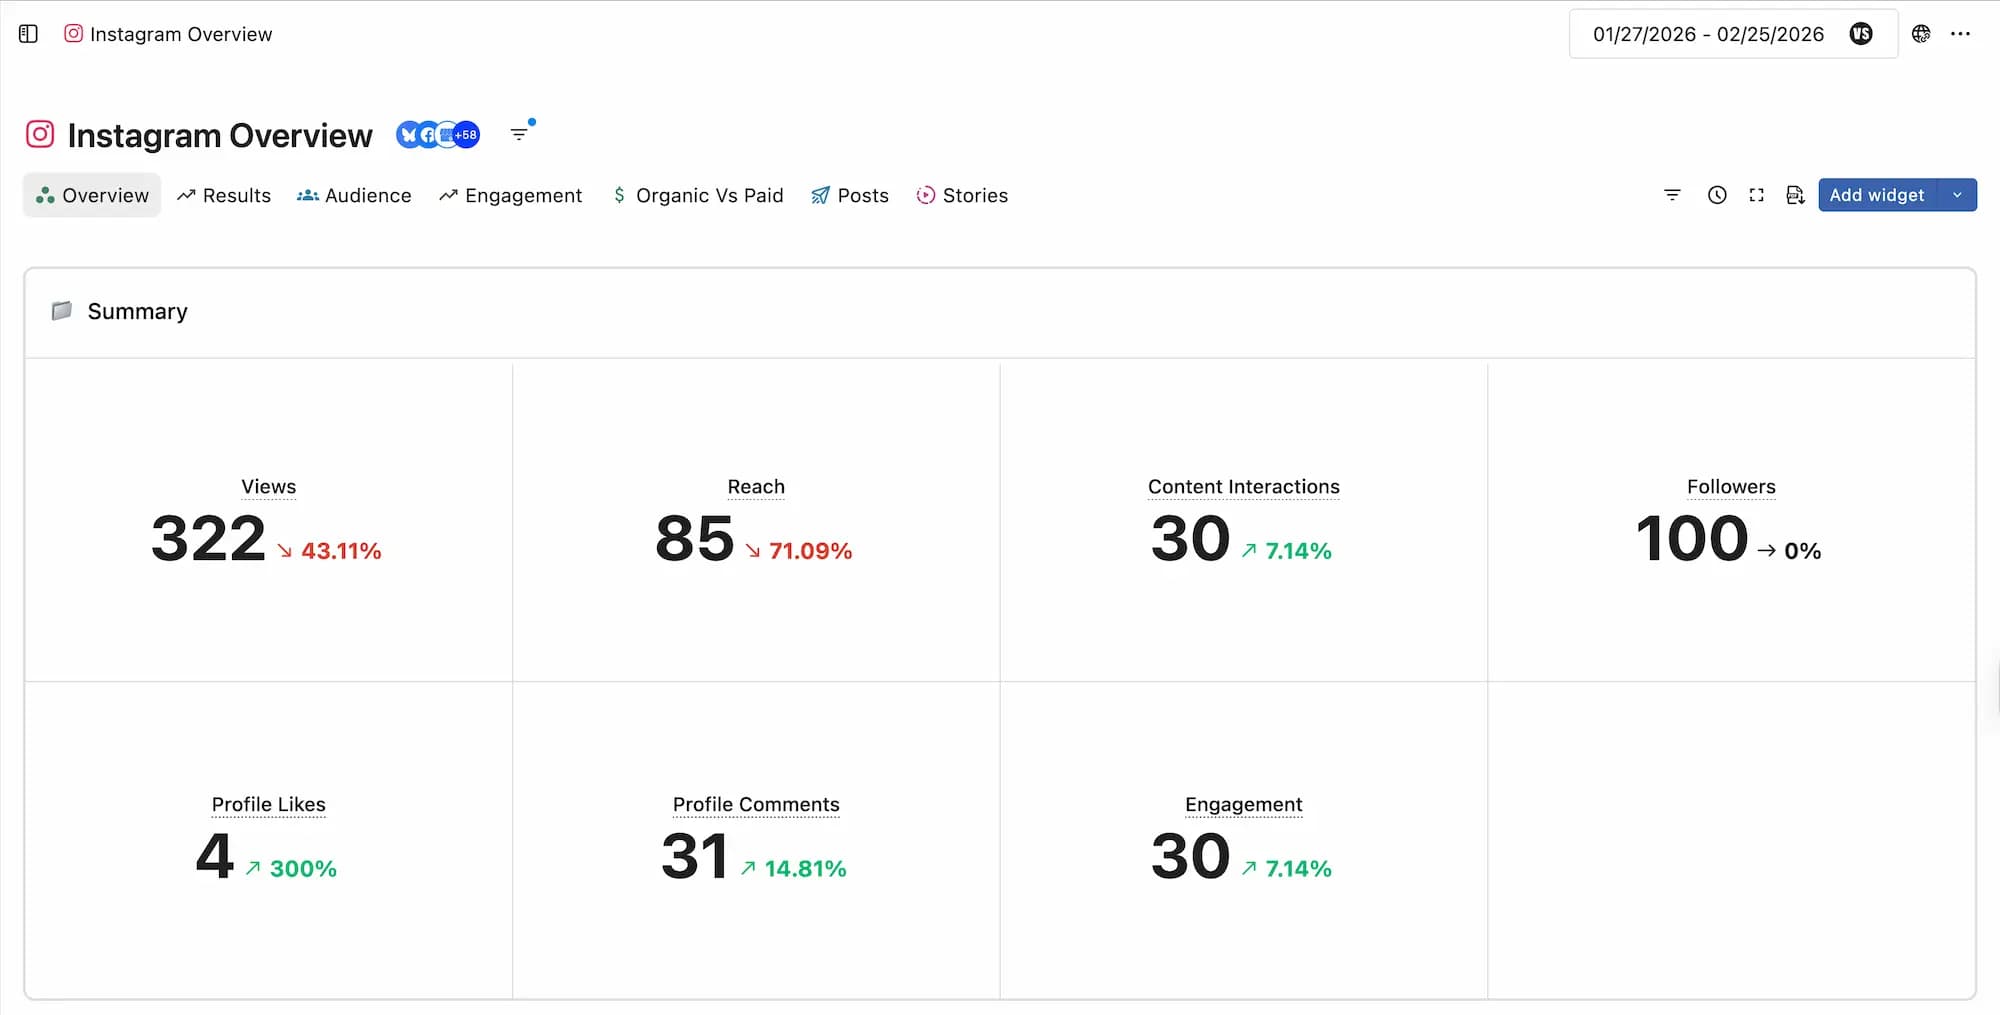
Once you set the comparison period, the graph will display the comparison data.
See the example image.
The numbers for "Instagram: Impressions," "Instagram: Reach," "Instagram: Likes," and "Instagram: Comments" increased compared to the set period.
Numbers with a + or a plus sign are displayed as a ↗ and the specific number is displayed in green.
On the other hand, the numbers for "Instagram: Number of Followers" and "Number of Published Posts" have decreased compared to the set period.
Negative numbers are displayed as ↘ and the corresponding number is displayed in red.
"Instagram: Profile Visits" shows "--" . This is what it will show if there is no data to compare.
Please see the image below.
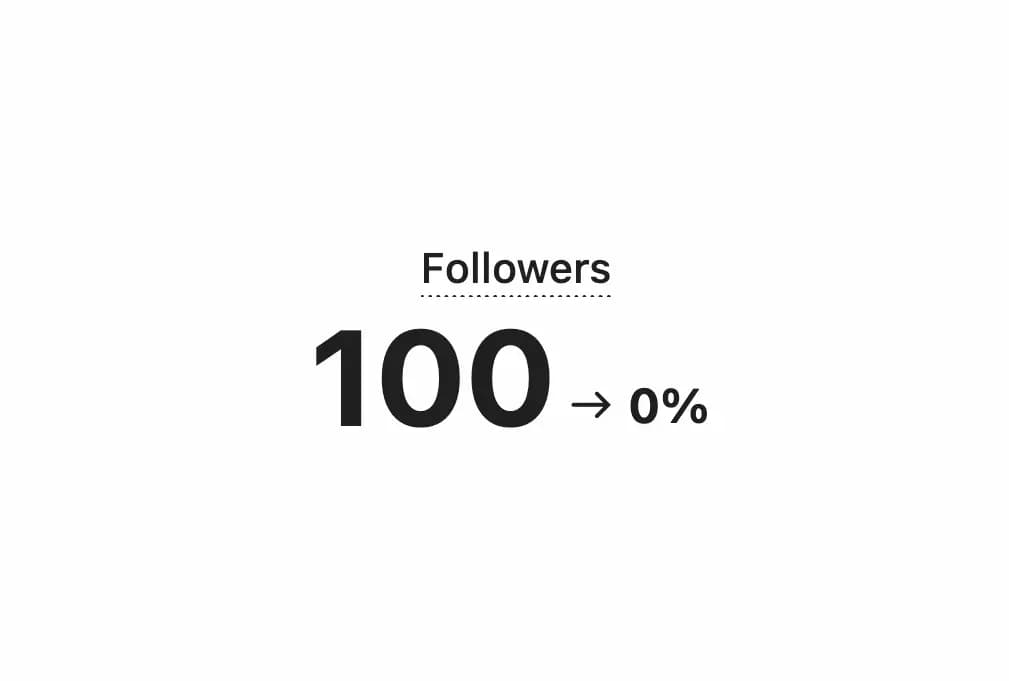
In this way, if there is no difference between the periods being compared and the data, it will be displayed as 0% .