Using AI to Build a Report
Building a report widget usually means knowing which metric to pick, which dimension to pair it with, and which visualization makes sense. The AI in Statusbrew's custom widget builder handles all of that for you. Just describe what you want to see in plain language, and the AI configures the widget instantly.
The AI is a great starting point but it can make mistakes. Always review the metric, dimension, filters, and visualization it selected before saving. You are in control: every field is editable after generation.
How Does It Work?
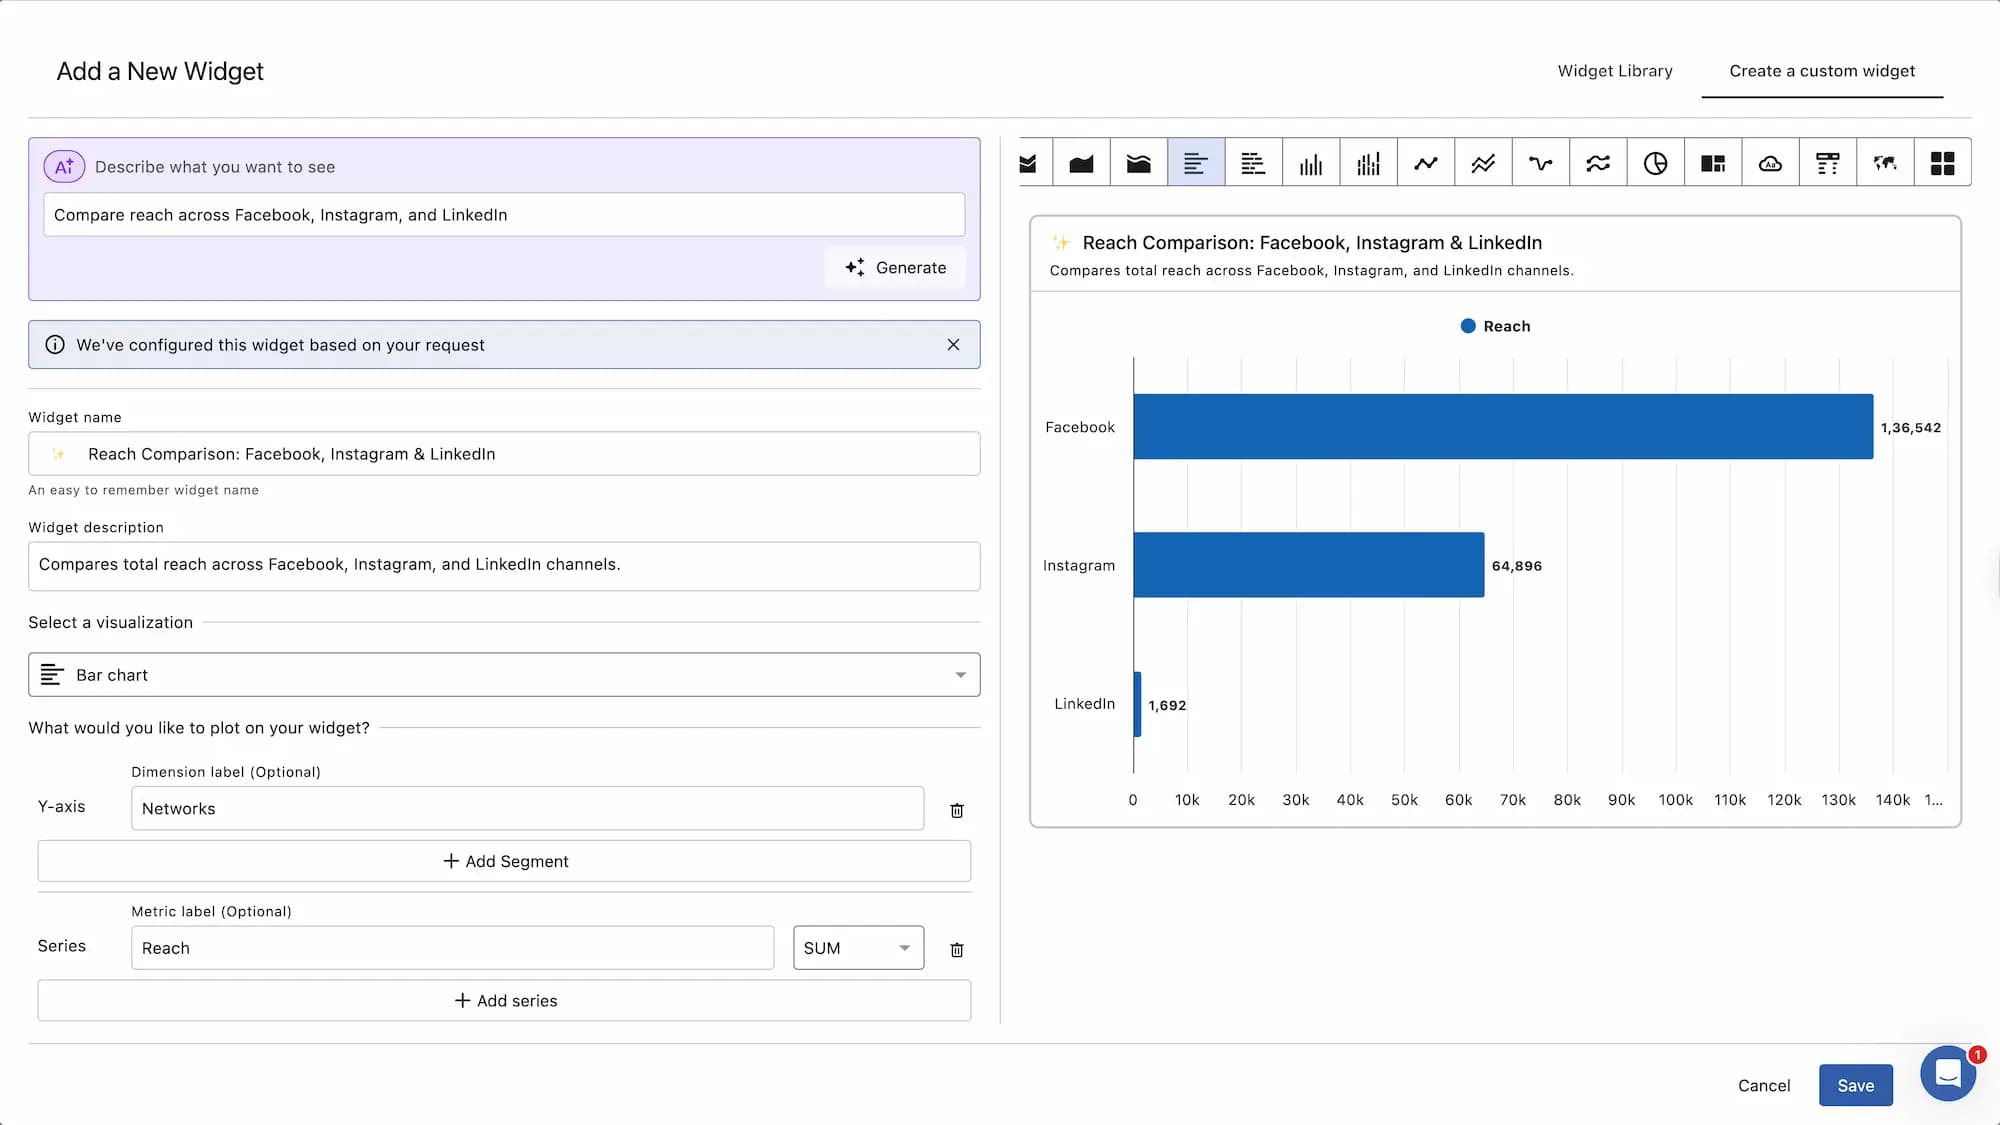
When you open the custom widget builder, you will see a Describe what you want to see field at the top. Type a plain-language description of the widget you want and click Generate.
The AI reads your description and automatically fills in:
Widget name and description
Visualization type
Metric(s)
Dimension(s)
Filters (including network filters based on what you mention)
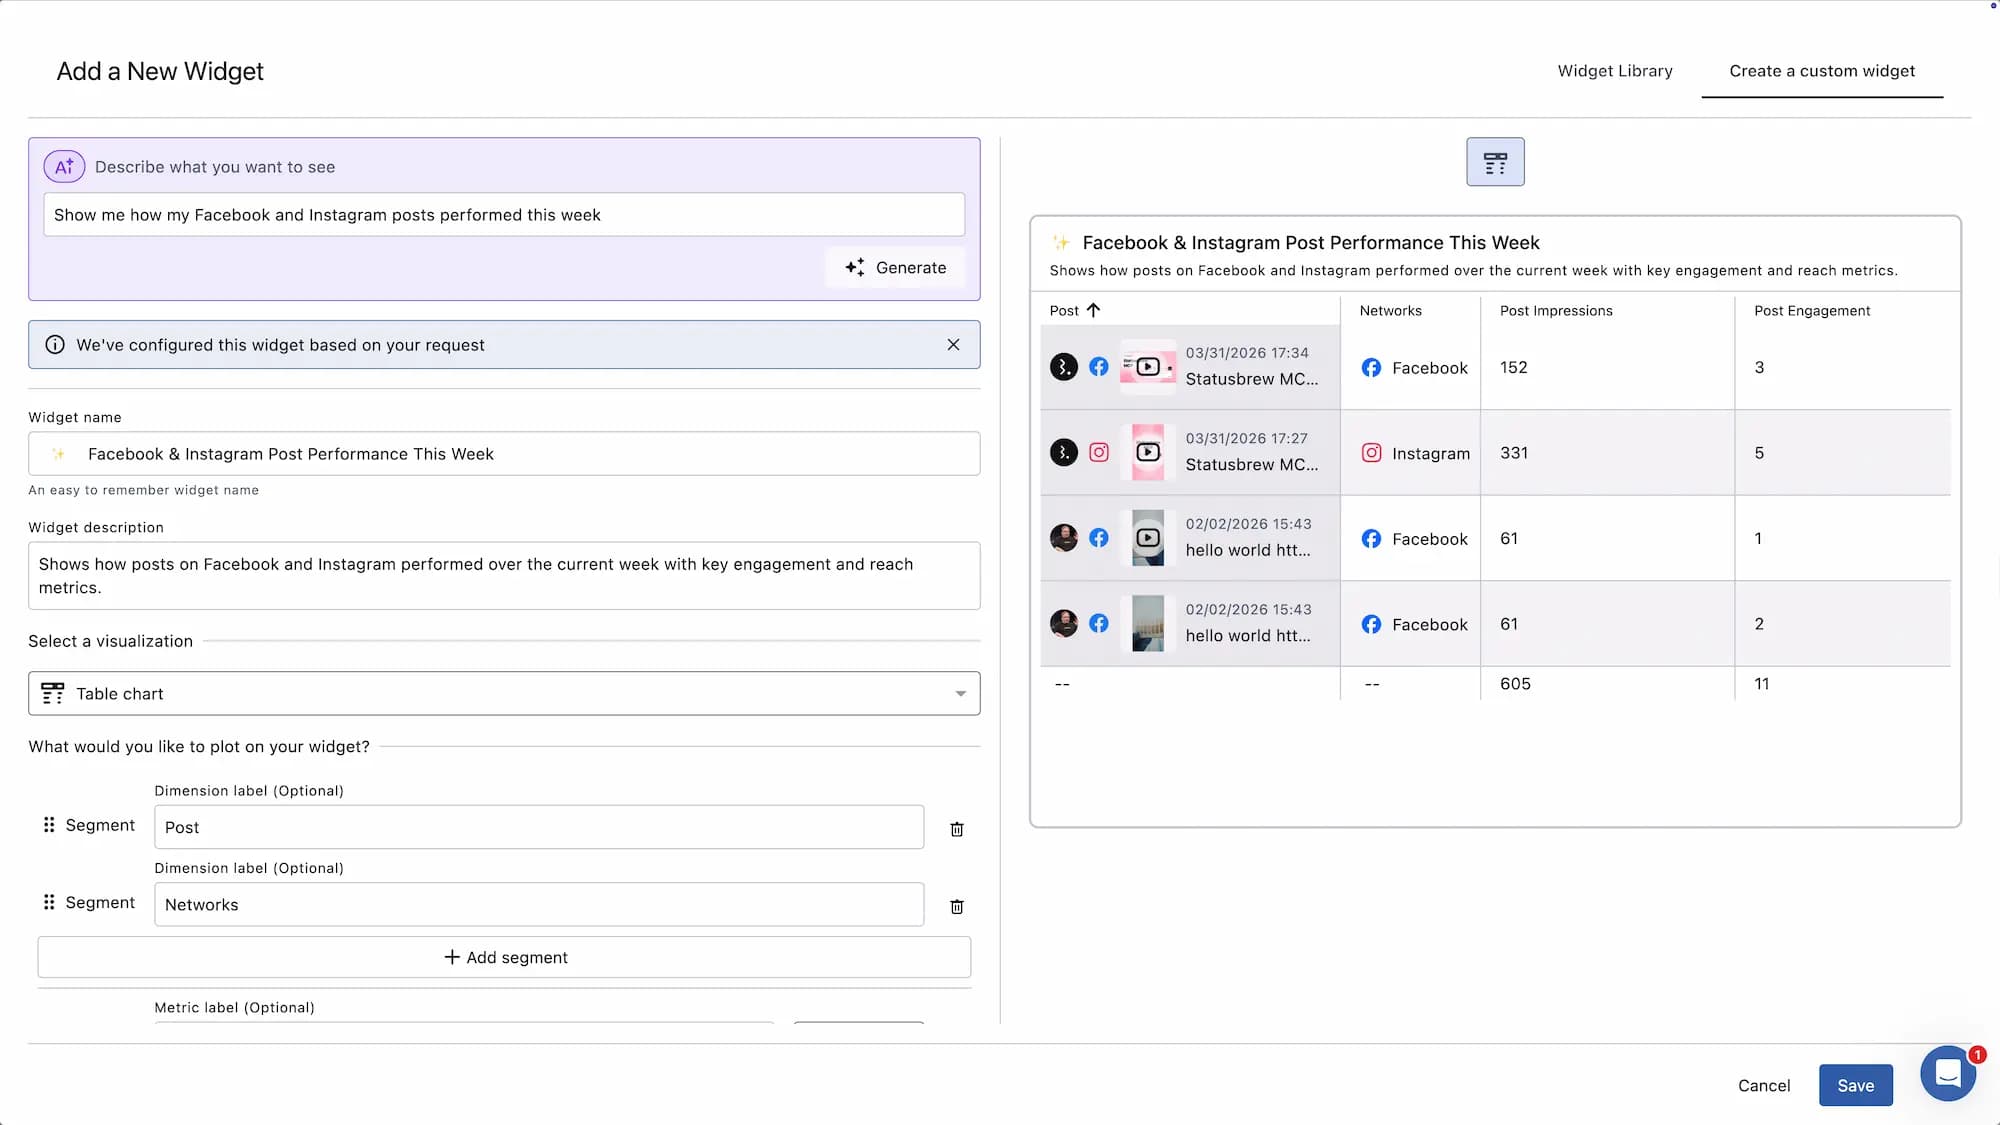
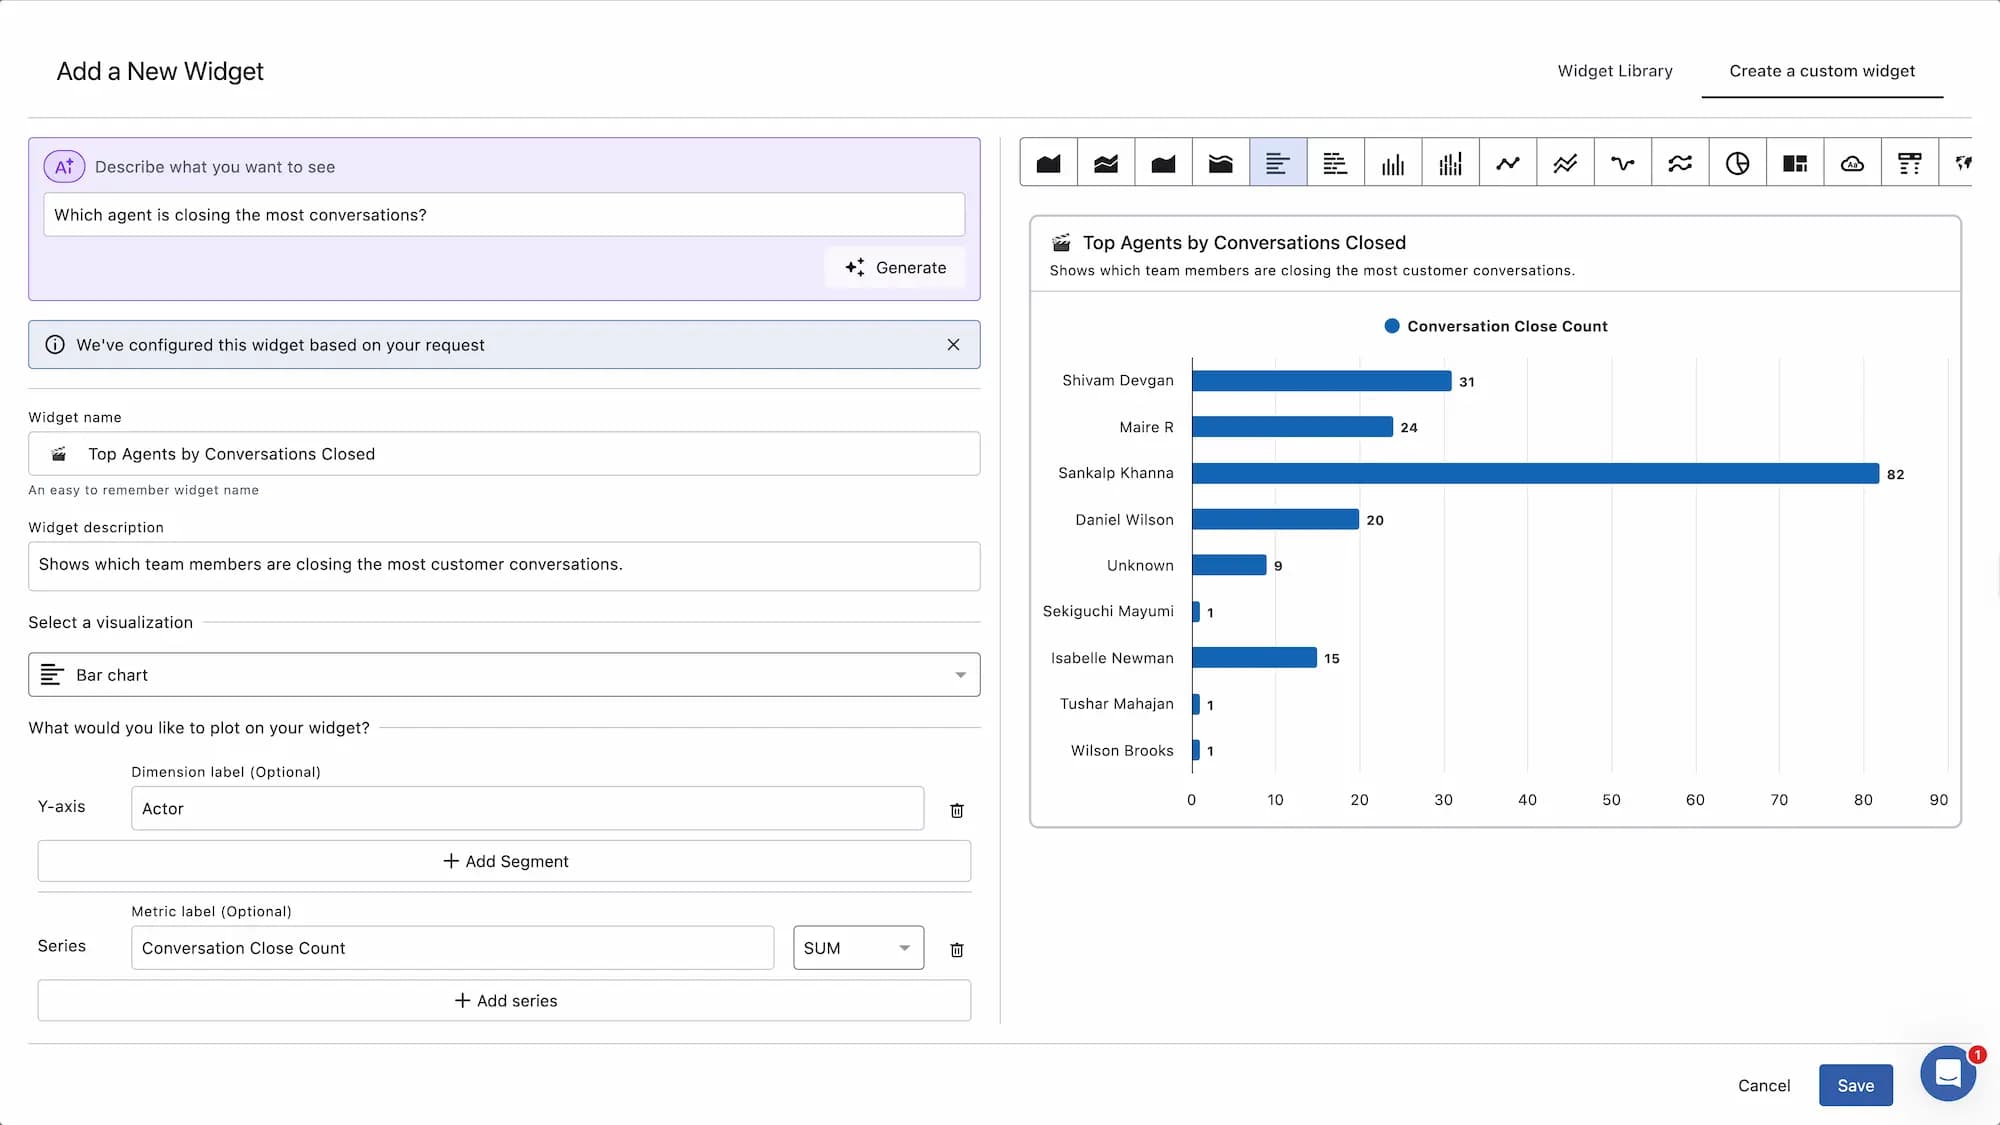
A confirmation banner appears when the AI has configured the widget: "We've configured this widget based on your request." All fields remain fully editable after generation. Review the live preview on the right and adjust anything before clicking Save.
How To Write A Good Description?
You do not need to use exact metric names or technical language. Write the way you would explain it to a colleague.
The three things that make a description work well:
The metric you care about: What you want to measure
The breakdown you want: by date, by network, by agent, by post, etc.
The network, if relevant: Facebook, Instagram, TikTok, etc.
The more specific you are, the better the result. A vague description like "show me engagement" will still produce a widget, but a specific one like "show post engagements for Facebook and Instagram broken down by post type" will produce exactly what you need.
You can specify a visualization type in your description if you have a preference. If you do not, the AI automatically picks the most relevant one. Either way, you can switch to any other visualization type after generating.
Example Descriptions
You can describe what you want in plain, everyday language. You do not need to use technical metric names. Here are examples that work well, organized by category.
Performance snapshots
Network-wise
Give me a Facebook overview for this month
Show me key Instagram numbers
Show me a LinkedIn performance summary
Give me a summary of how all my profiles are performing
Inbound overview

Give me an overview of conversations coming in this month
Show me a summary of inbound messages broken down by sentiment
How many conversations did we receive this month?
Paid performance

Give me a paid ads overview for this month
Show me a summary of my ad performance across campaigns
How are my ads performing this month?
Post performance
Plain language
Which of my posts got the most likes and comments this month?
Show me how my Facebook and Instagram posts performed this week
What type of posts get the most engagement?
Which posts got the most reach this month?
Show me my top 10 posts by engagement
More specific
Show post impressions, post reach, and post engagements for Facebook and Instagram, broken down by post type
Top 10 posts by post engagement rate on Instagram, broken down by post
Show posts published broken down by author and network
Audience growth
Plain language
How is my follower count growing over time?
Am I gaining or losing followers on Facebook and Instagram?
How is my audience growing across all my profiles?
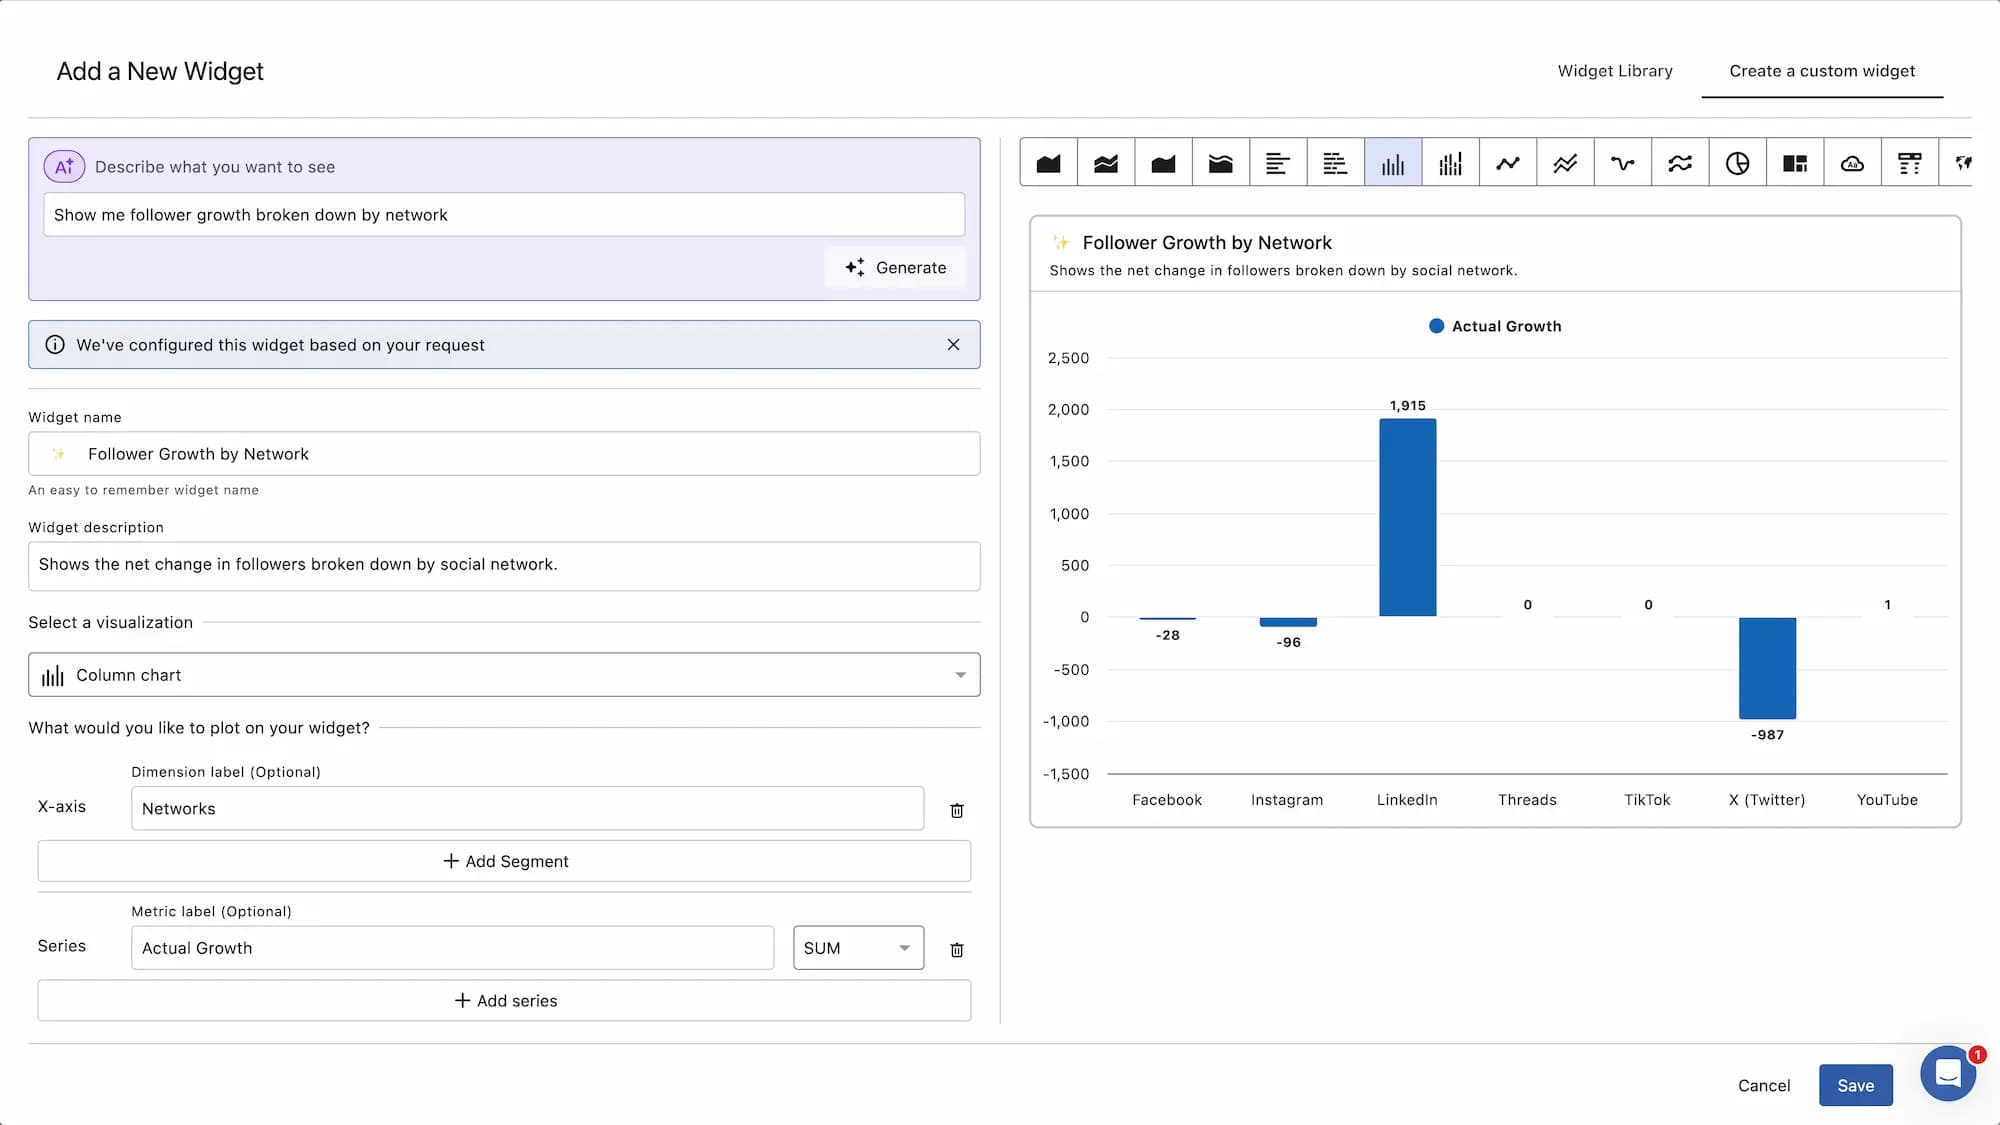
Show me follower growth broken down by network
More specific
Compare actual growth across all connected profiles, broken down by network, over time
Show followers gained and unfollowers for Facebook and Instagram, broken down by network
Reach and impressions
Plain language
How many people are seeing my content on Facebook?
Show me my reach and impressions across all profiles
Compare reach across Facebook, Instagram, and LinkedIn
More specific
Show post impressions and post reach broken down by post type
Show impressions and reach broken down by network over time
Customer service
Plain language
How fast is my team responding to conversations?
Which agent is closing the most conversations?
Show me conversations by sentiment this month
More specific
Show total conversations received and conversations closed, broken down by agent
Compare average conversation response time and resolution time, broken down by agent
Show total conversations received, broken down by sentiment over time
For paid reporting
Plain language
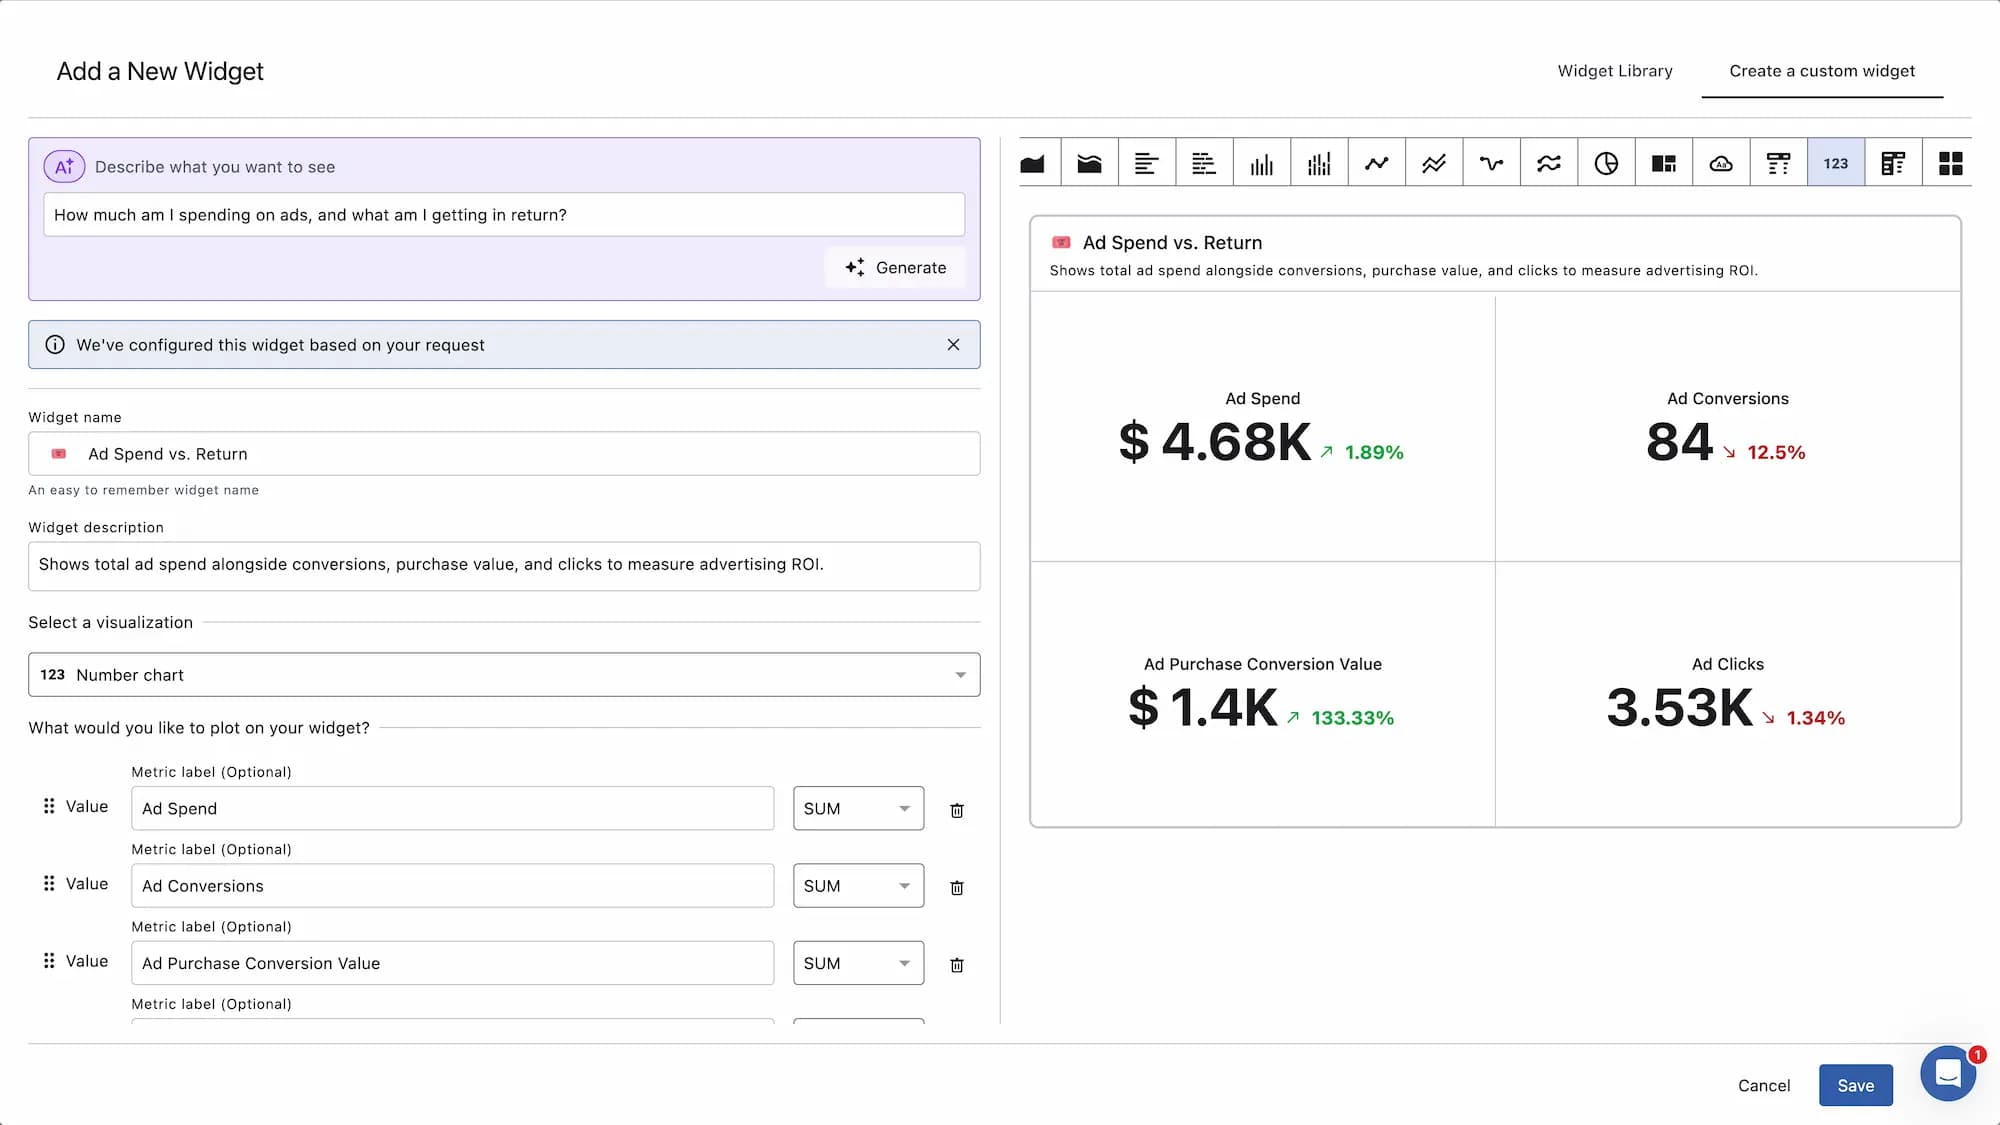
How much am I spending on ads, and what am I getting in return?
How are my ad campaigns performing?
More specific
Show ad spend, ad impressions, and CPM broken down by ad campaign
Compare CTR and link click rate for Facebook and Instagram ads, broken down by ad campaign
When Does The Manual Builder Work Better?
For the following scenarios, you will get the most accurate results by building the widget manually. The Statusbrew team is actively working on reducing the need for manual intervention so the AI can handle these automatically in the future.
Comparing organic vs paid performance
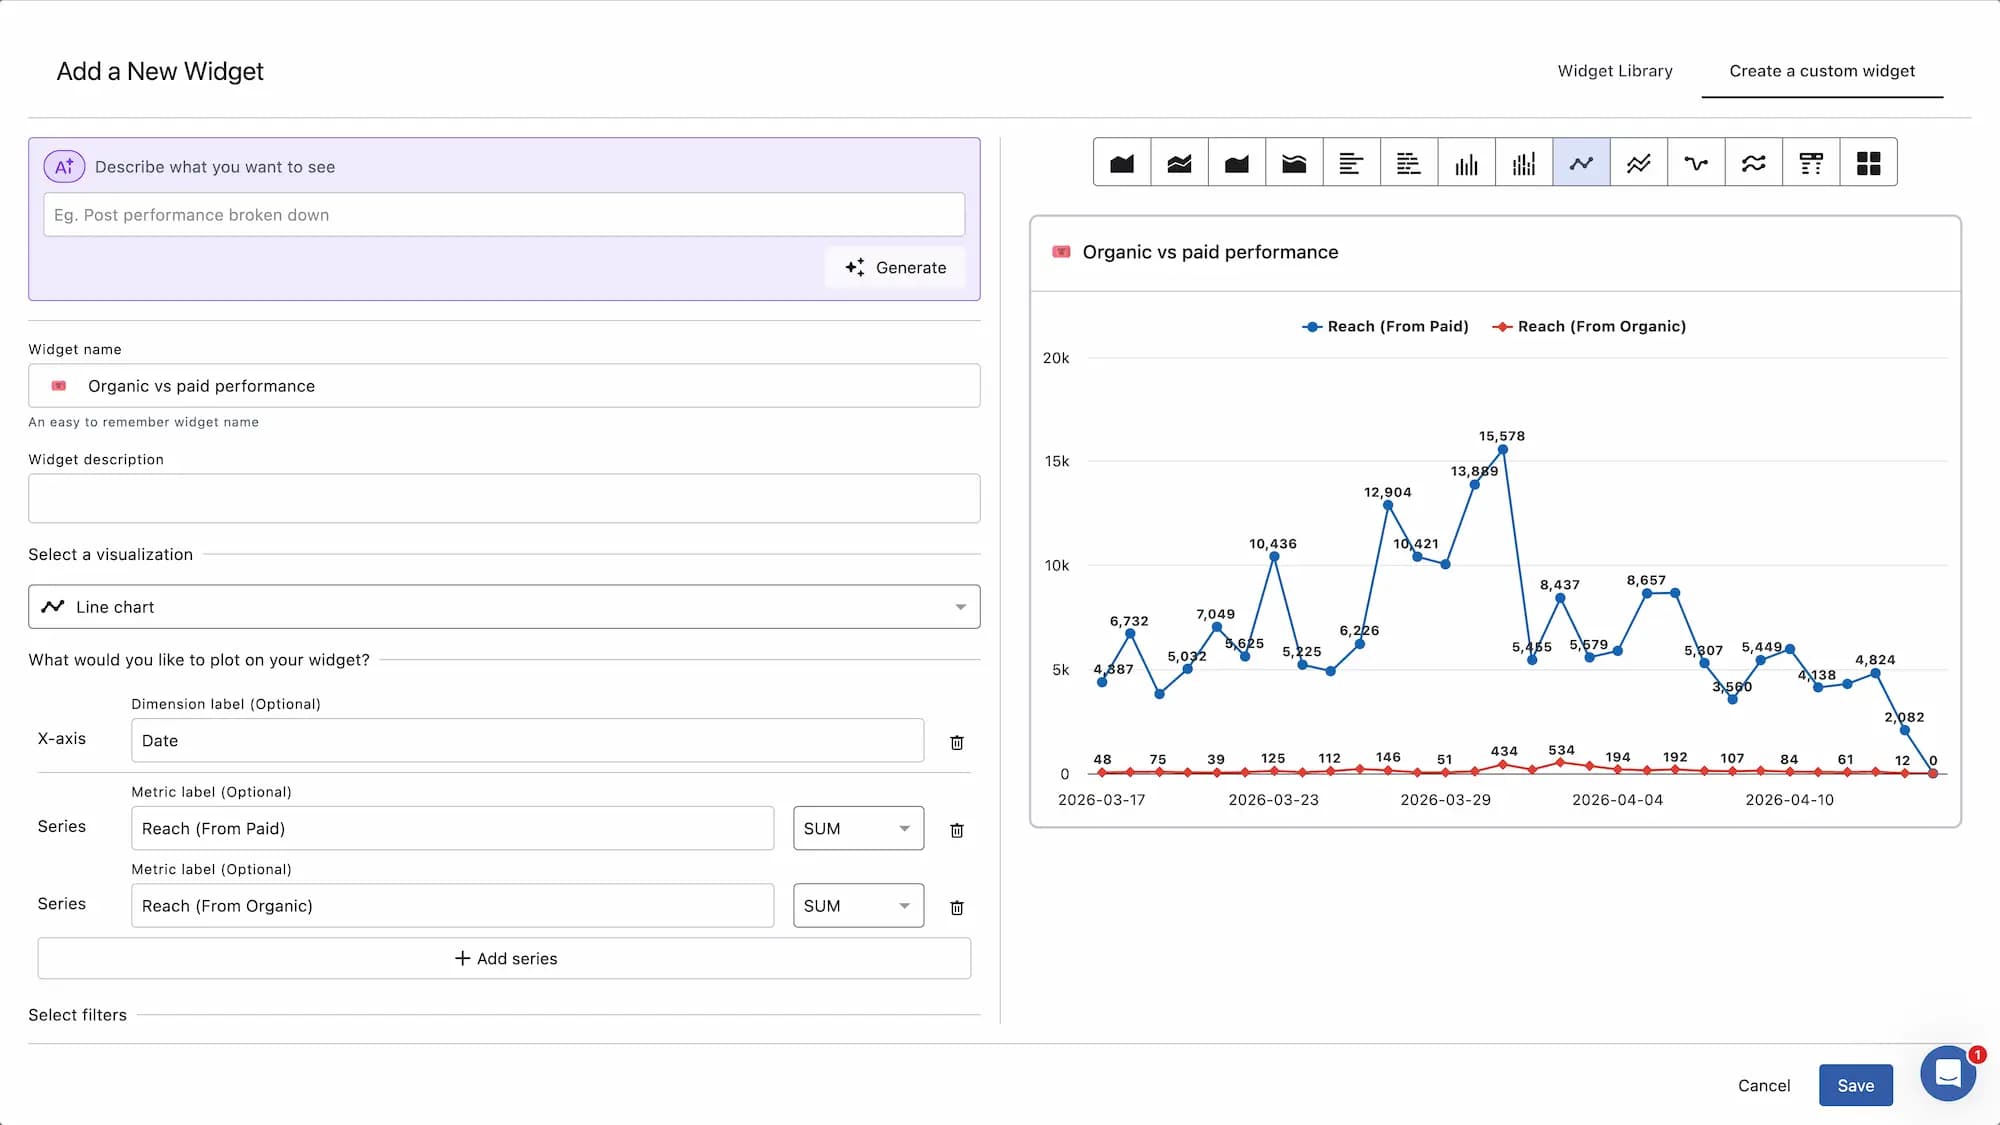
If you want to compare how your organic content is performing versus paid, build this manually for best results.
Go to Reports, click Add widget, select Create a custom widget. Select Reach (From Organic) and Reach (From Paid) as metrics, set the dimension to Date, add a network filter if needed, then click Save.
Go to Reports, click Add widget, select Create a custom widget. Select Impressions (From Organic) and Impressions (From Paid) as metrics, set the dimension to Date, add a network filter if needed, then click Save.
Network-specific metrics
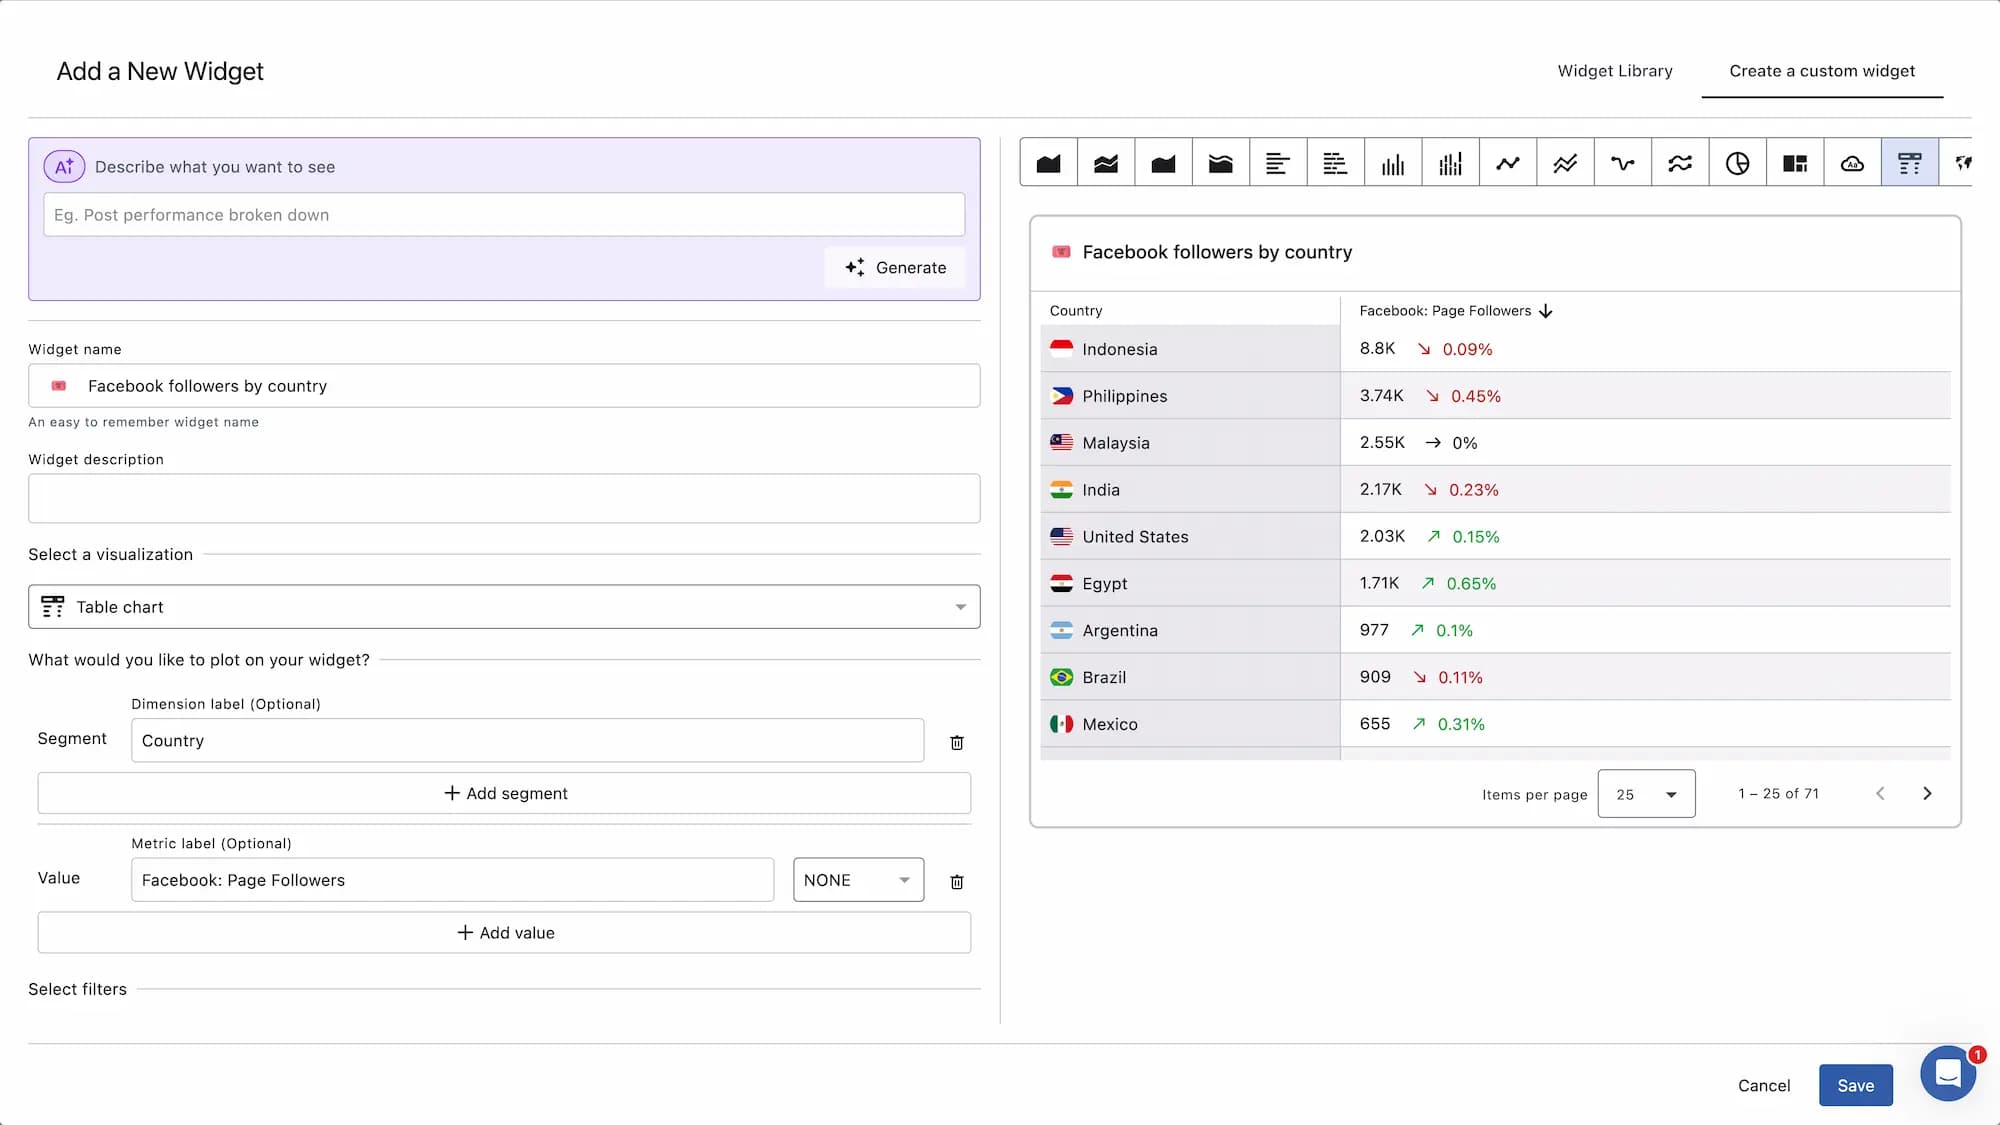
If you want to see network-specific data, such as company page performance, follower demographics, or Stories metrics, build it manually for best results.
Go to Reports, click Add widget, select Create a custom widget. Select Facebook: Page Followers as the metric, set dimension to Country, sort by Facebook: Page Followers in descending order, set max rows to 5, then click Save.
Go to Reports, click Add widget, select Create a custom widget. Select Views (From Story) and Reach (From Story) as metrics, set the dimension to Date, then click Save.
Go to Reports, click Add widget, select Create a custom widget. Select LinkedIn: Followers (Organic) and LinkedIn: Followers (Paid) as metrics, set the dimension to Country, then click Save.
Competitor metrics
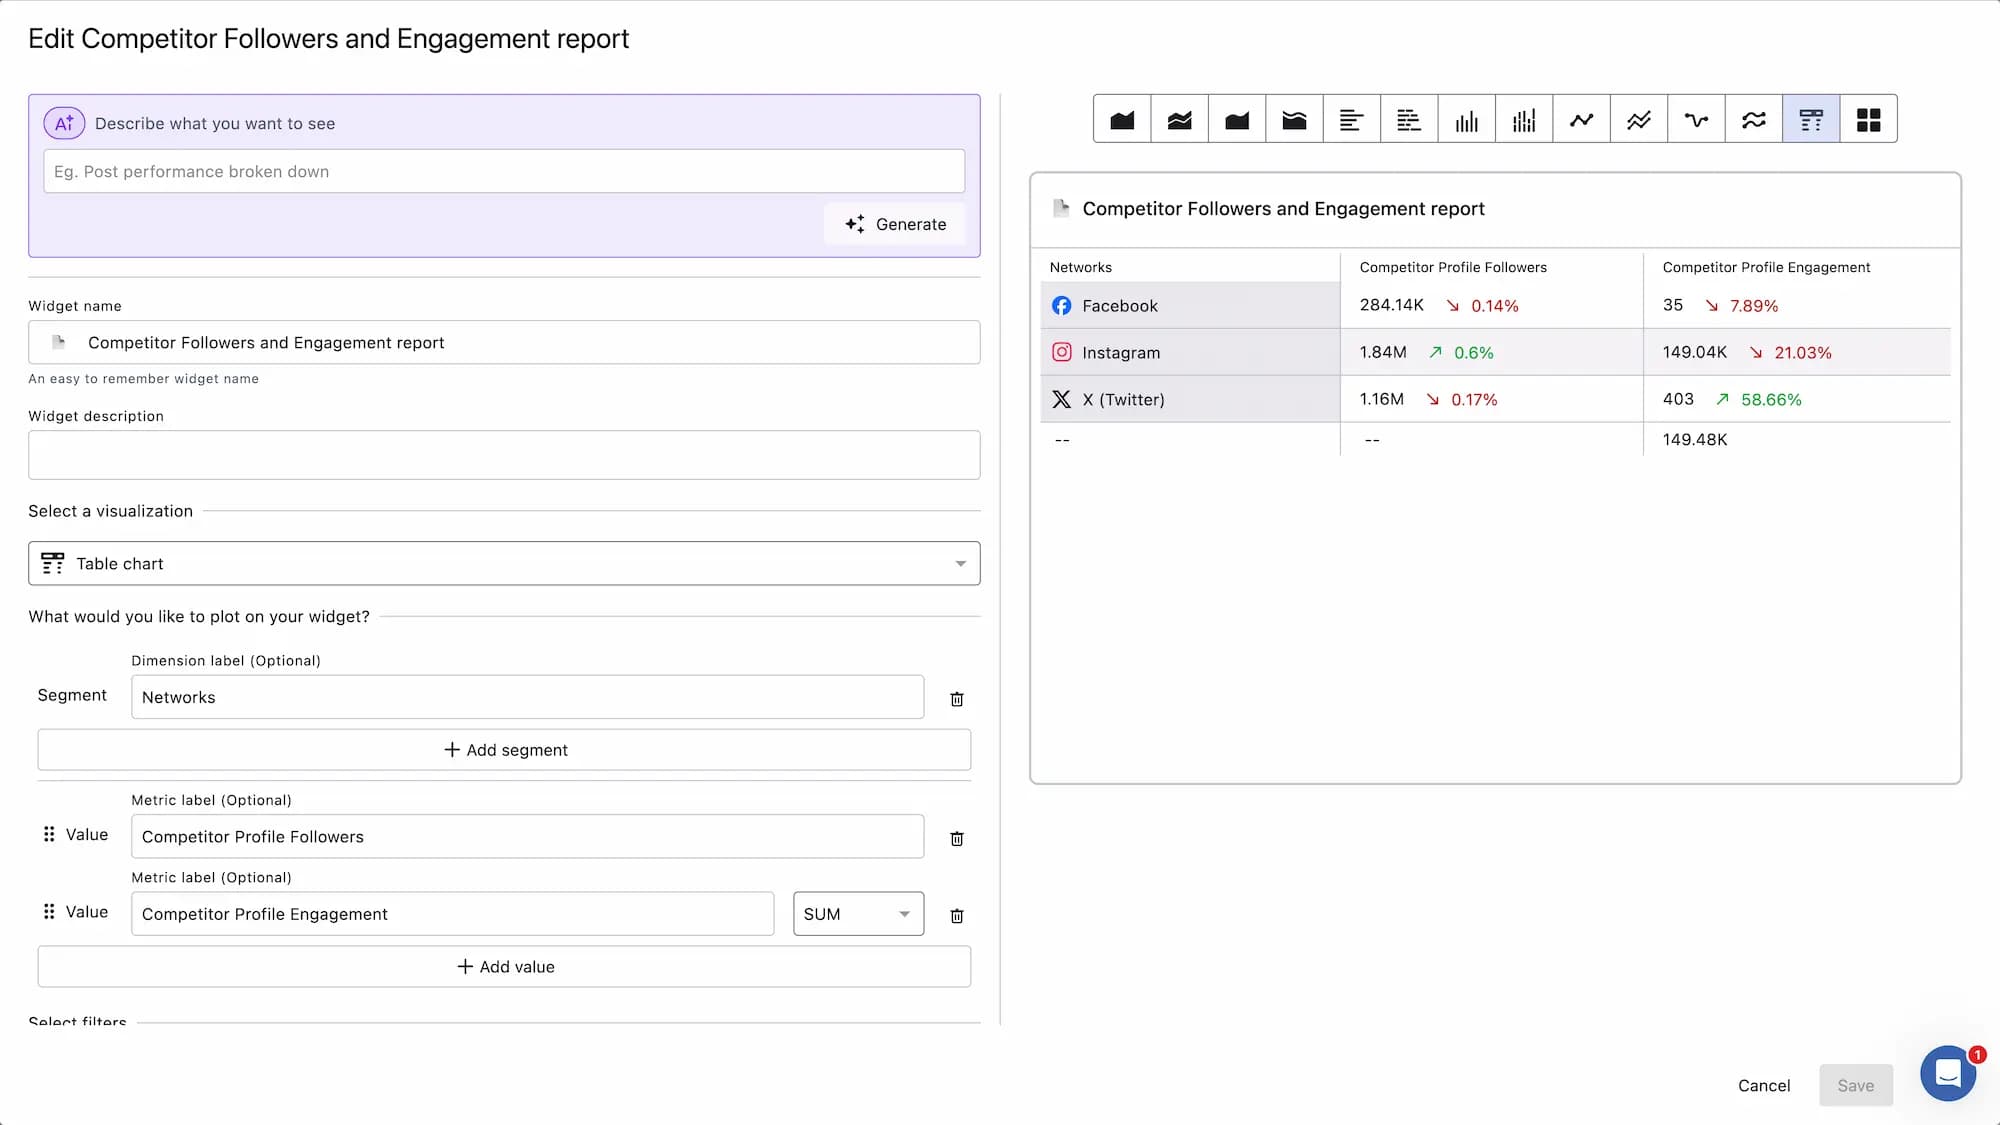
If you want to track how your competitors are performing, build this manually for the best results.
Go to Reports, click Add widget, select Create a custom widget. Select Competitor Profile Followers and Competitor Profile Engagement as metrics, set the dimension to Network, then click Save.
Go to Reports, click Add widget, select Create a custom widget. Select Competitor Post Total and Competitor Post Impressions as metrics, set the dimension to Post Type, then click Save.
Video performance at the post level
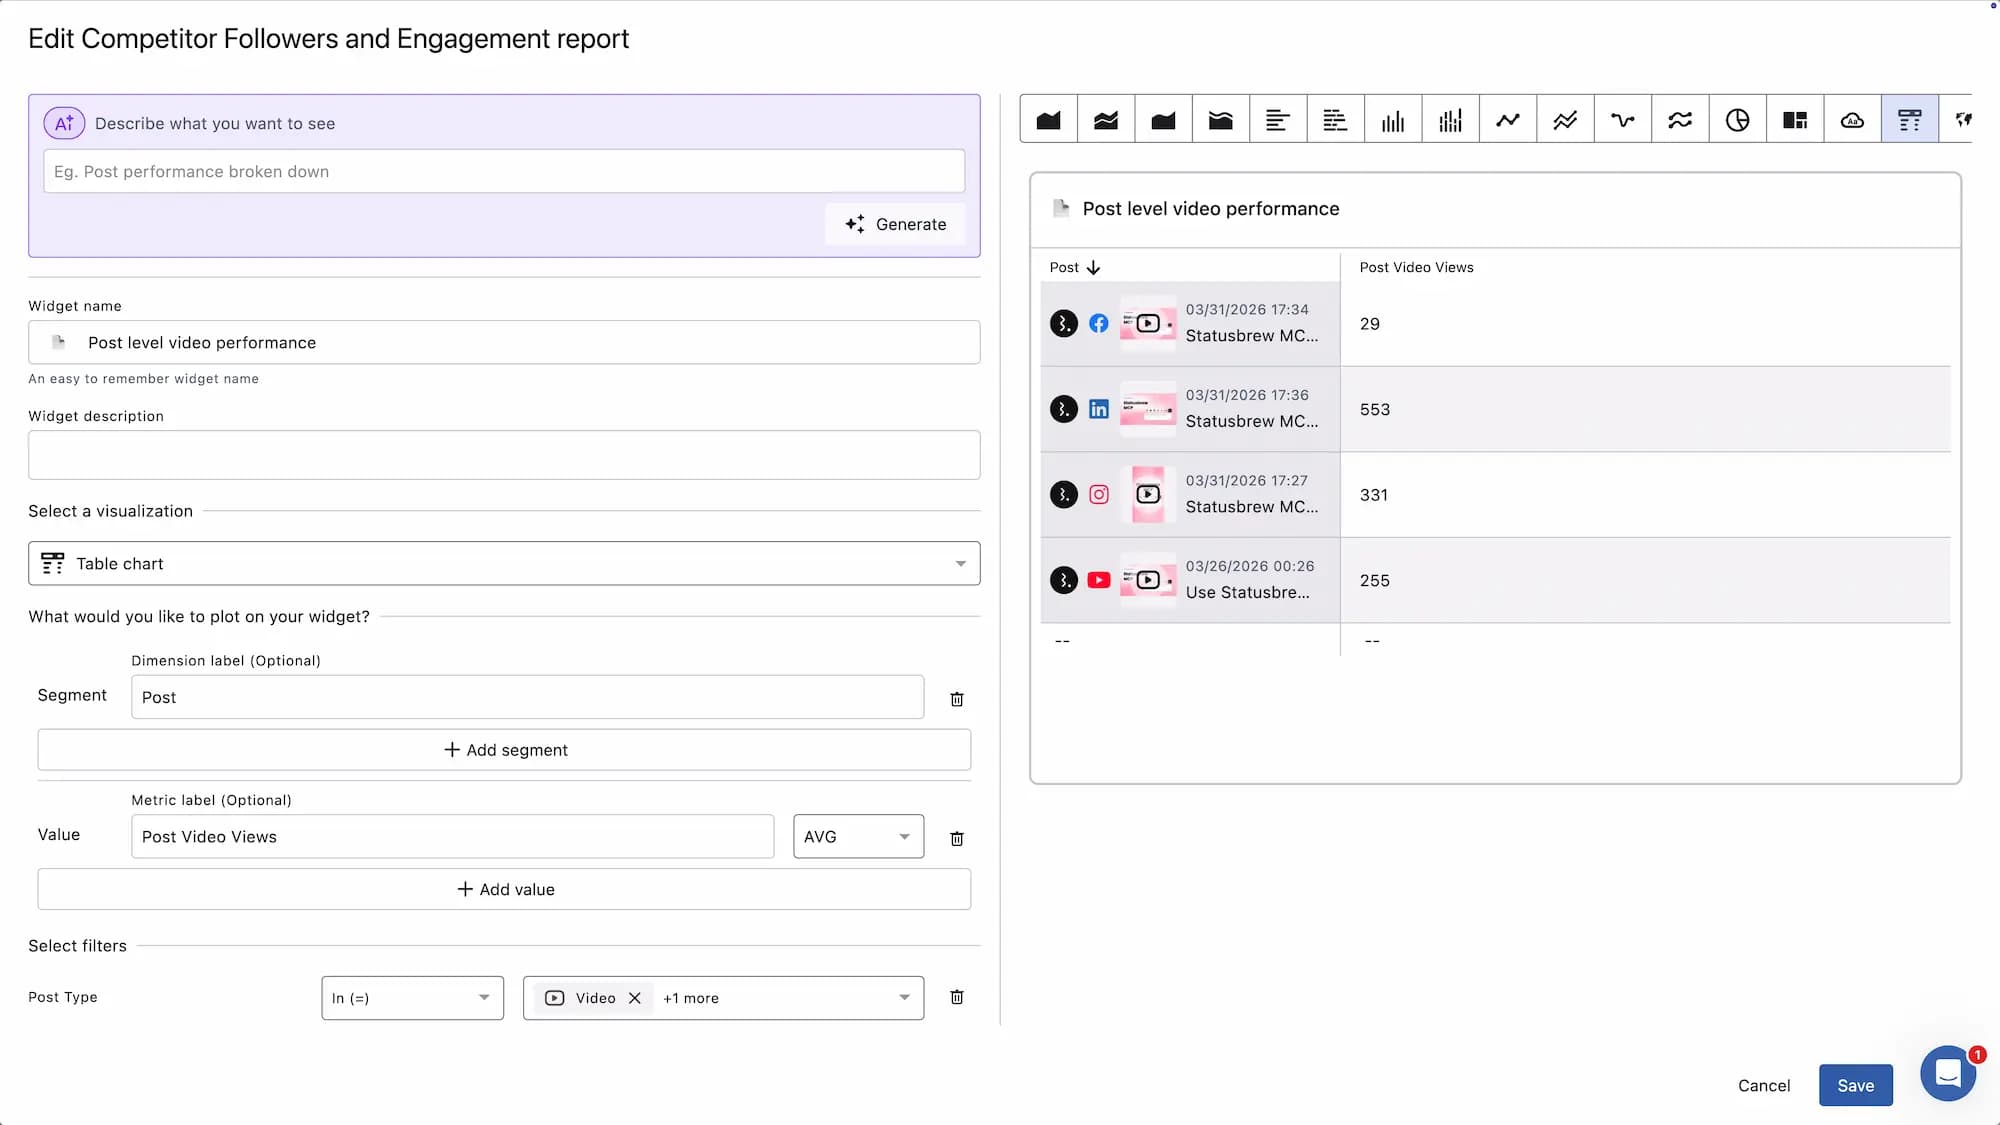
If you want to see how individual video posts are performing, build this manually for best results.
Go to Reports, click Add widget, select Create a custom widget. Select Post Video Views as the metric, set dimension to Post, add a Post Type filter (select Video, Reel, or both depending on the network), sort by Post Video Views in descending order, then click Save.
Go to Reports, click Add widget, select Create a custom widget. Select Post Video Watched Total (in seconds) as the metric, set dimension to Post, add a Post Type filter (select Video, Reel, or both depending on the network), sort by Post Video Watched Total (in seconds) in descending order, then click Save.
What Happens After You Generate?
The AI configures the widget but does not save it. You stay in the widget builder with all fields editable. From here you can:
Change the visualization type from the icons at the top of the preview
Add or remove metrics and dimensions
Adjust filters
Add sorting
Update the widget name or description
When everything looks right, click Save to add the widget to your report.
If the widget preview shows "unknown", simply save the widget. All the relevant information will show and the widget works well.
If the widget shows less data than expected after saving, check the date range selected on your report. The reporting period controls what data the widget pulls. Adjust it using the date range picker on your report canvas.
If the generated widget is not what you expected, refine your description and click Generate again. Each generation replaces the previous configuration.
FAQs
Does the AI automatically pick the visualization type?
You can specify a visualization type in your description if you have a preference. If you do not, the AI automatically picks the most relevant one. Either way, you can switch to any other visualization type after generating.
Do I need to know the exact metric name?
No. Plain language works well for most widgets. You can always select the metrics manually and build your widget.
Can I edit the widget after the AI generates it?
Yes. All fields are editable after generation. Nothing is saved until you click Save.
What if the AI gets the metric wrong?
AI can make mistakes. You can always build the widget manually instead. Every field is editable, so you have full control over the final result.
Why does the widget preview show "unknown"?
Simply save the widget. All relevant information will be displayed, and the widget works well.
Why is my widget showing no data after saving?
Check the date range selected on your report. The reporting period controls what data the widget pulls. Adjust it using the date range picker on your report canvas.
Is this available on all plans?
The AI widget generator is available on Premium and above.