Edit a report
Use the Edit Report feature to create more useful and efficient reports.
Let's take a look at how to edit a report below.
Editing Report Settings
1. From Statusbrew home page, Open a report .
2. From the left panel, click to open the report you want to edit.
3. Three-dot menu on the top right of the screen Click on Select Edit Report.
icon
Report Name
Report Overview
Data Source
Collaborators
can be edited.
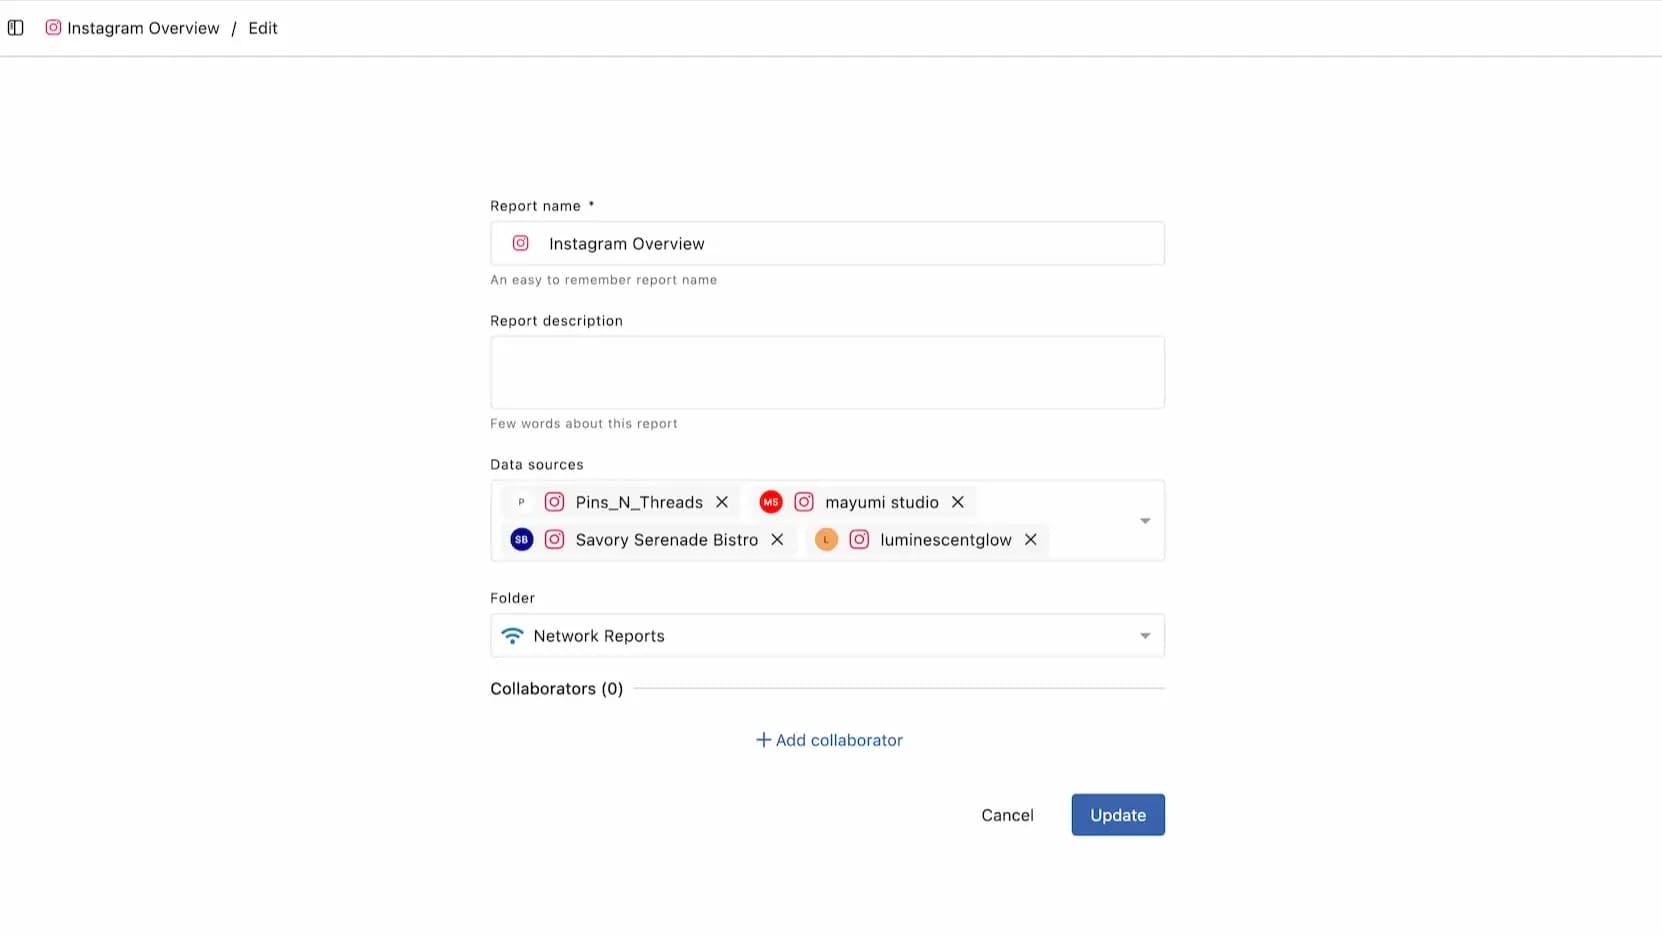
Once you've made your changes, click Update to save them.
Adding widgets
In the left panel of your report , click to open the report to which you want to add a widget.
Click Add Widget at the top of the screen .
Use templates from the widget library or create and save custom widgets .
Note: Currently, widget templates are only available on the English platform. Therefore, when installing a template, you will need to temporarily switch your language settings to English.
Editing a Widget
You can edit widgets that you have already created.
In the left panel of your report , click to open the report that contains the widget you want to edit.
The three-dot menu at the top right of the widgets section Click Select the widget settings .
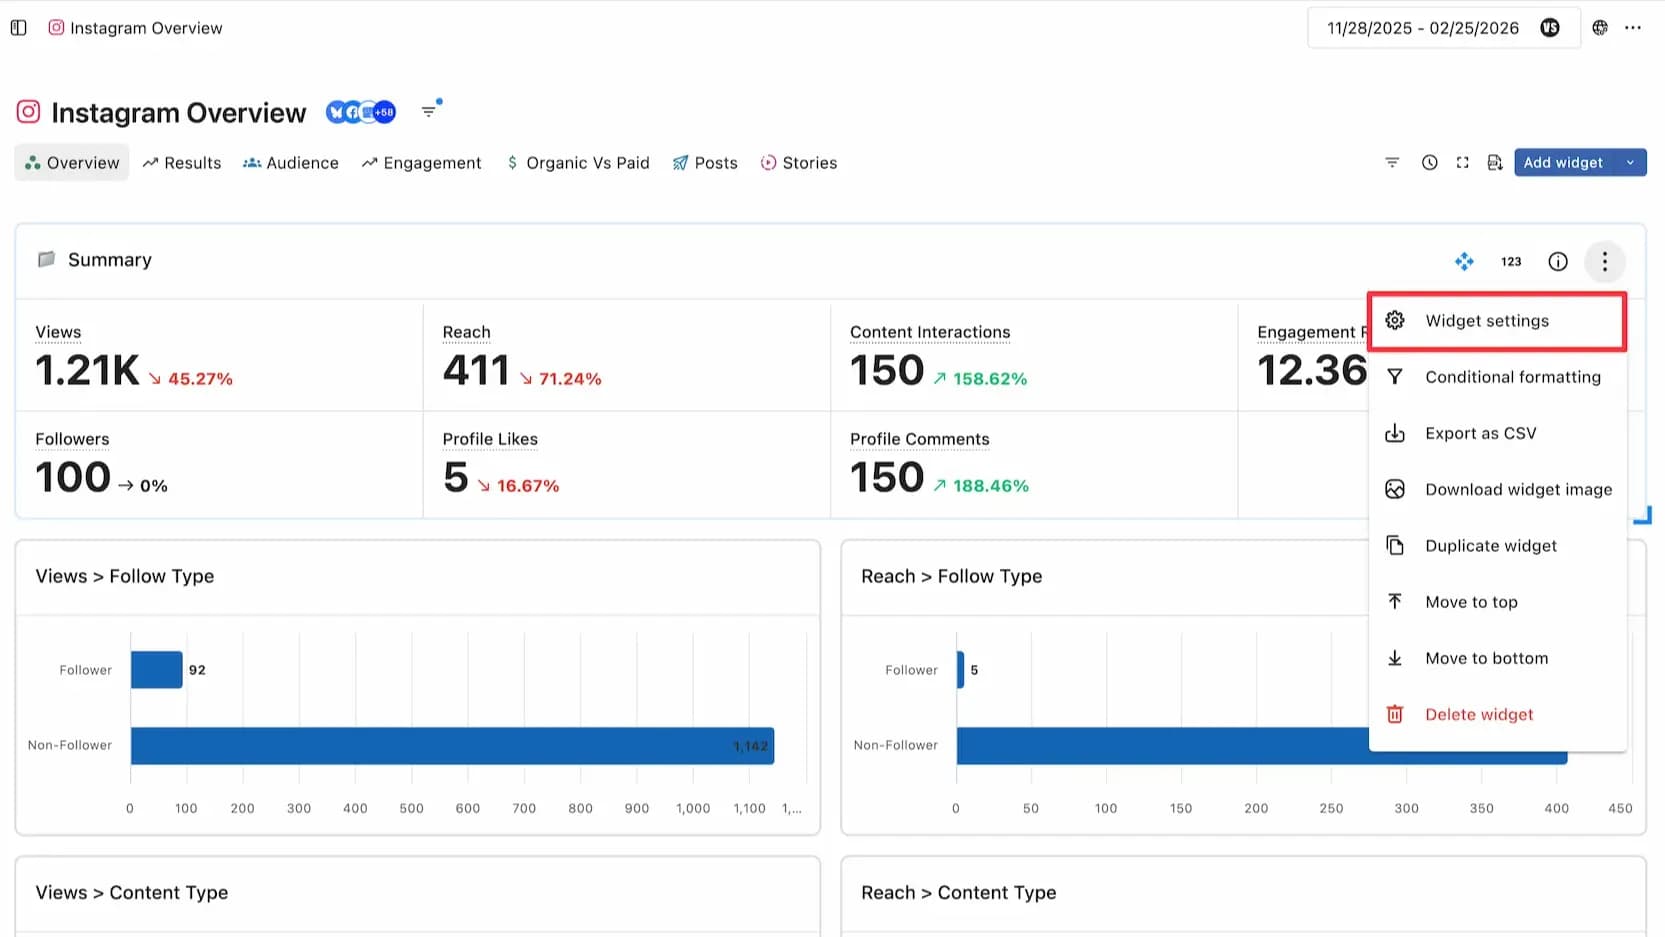
Widget Name
Widget Overview
Visualization
Metrics
Dimensions (Segments)
Filter
sort
Table charts only : Define the maximum number of rows
Define the widget settings
can be edited.
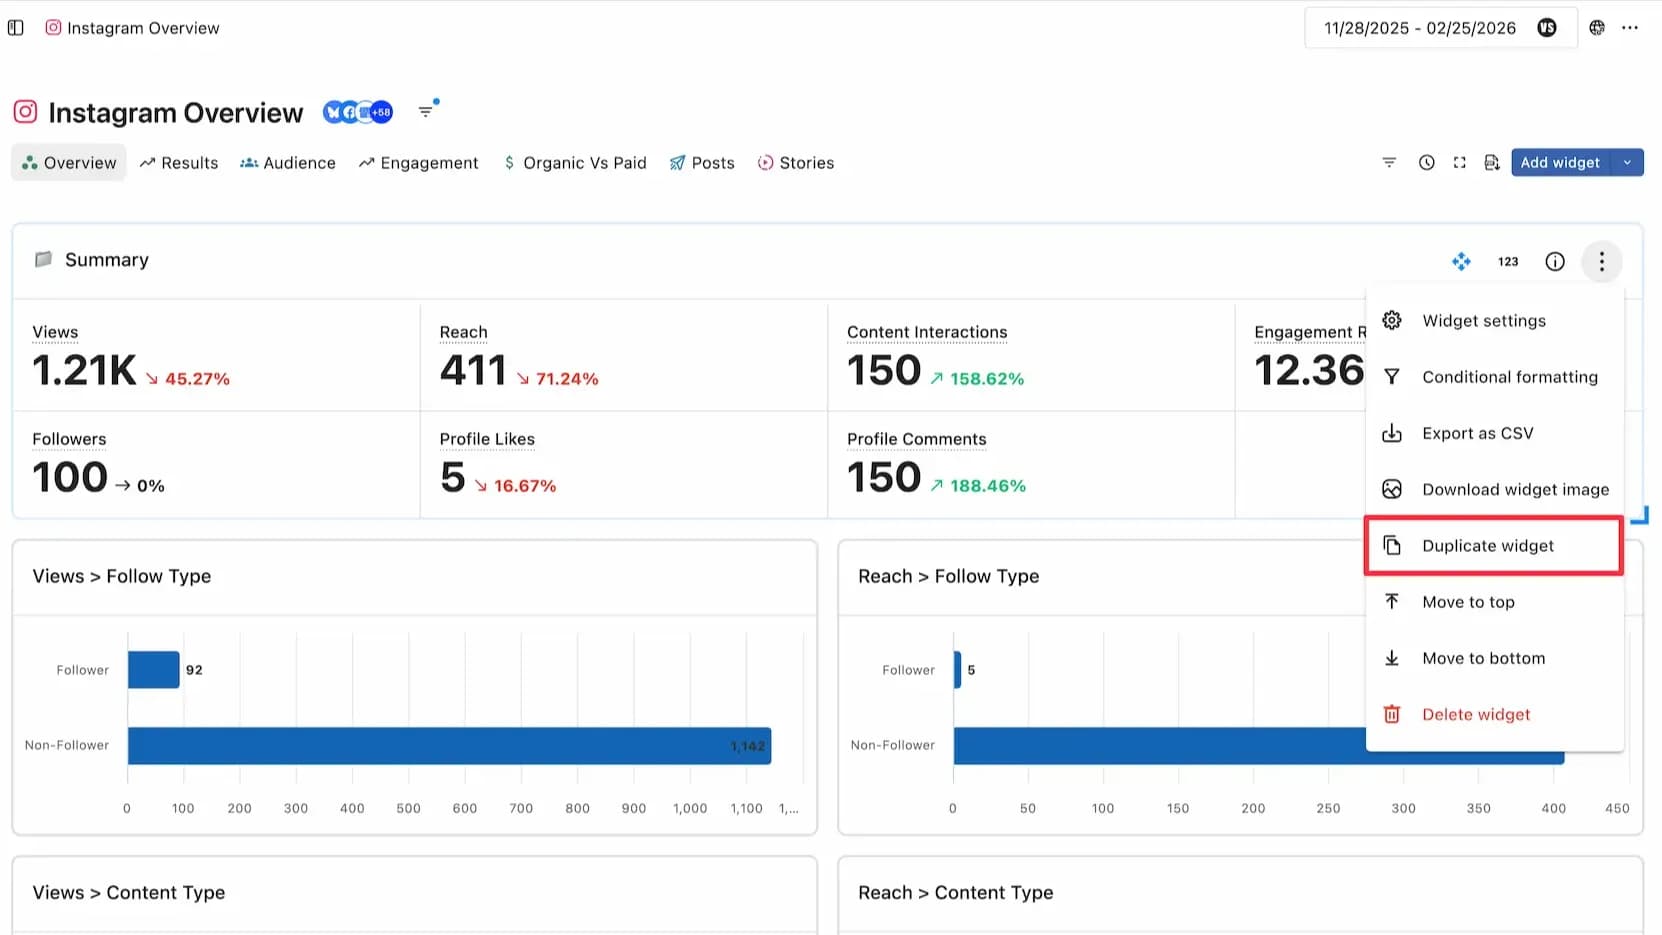
Duplicating a Widget
You can duplicate a widget, and then make small changes to filters, dimensions, etc. to create a similar widget that you can tweak to suit your needs.
Report
In the left panel of the Reports page, click to open the report that contains the widget you want to remove.
The three-dot menu at the top right of the widgets section, Select Duplicate Widget .
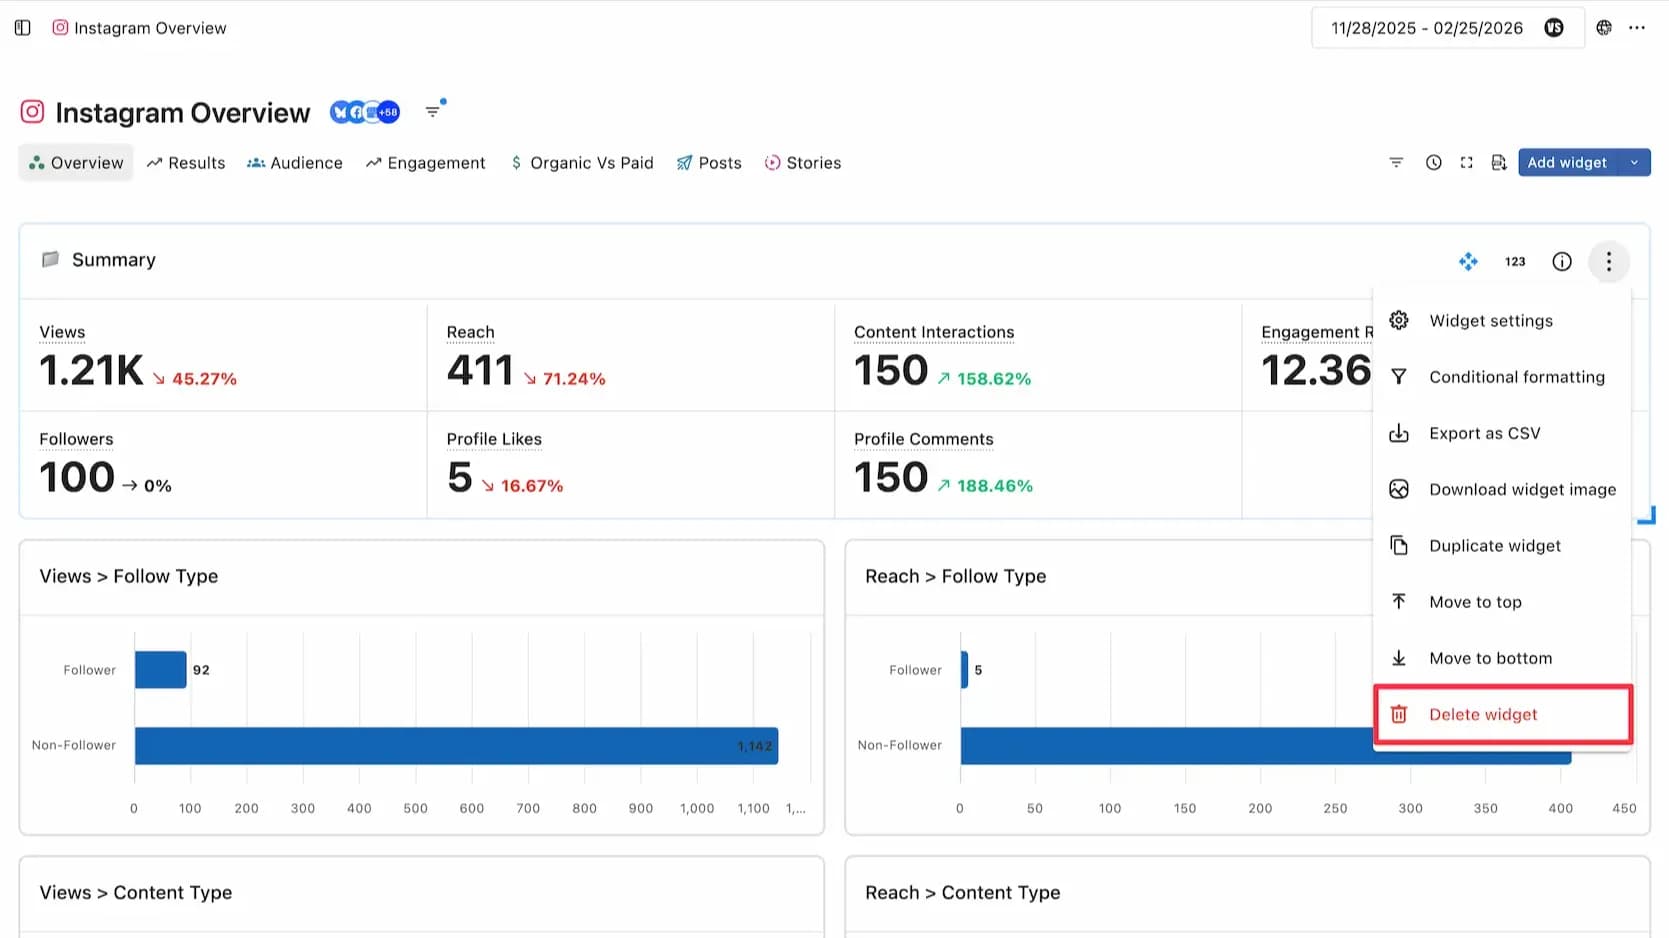
Deleting a widget
In the left panel of your report , click to open the report that contains the widget you want to remove.
The three-dot menu at the top right of the widgets section, Select Remove Widget .
Conditional Formatting
This feature allows you to quickly identify data and patterns by coloring cells that correspond to specific values. For example, you can set a cell to display yellow if the number of posts is over 100.
This function is available when you select the table chart and number chart data method.
Click the three dots in the top right corner of the widget and select the filter setting .
Top righticon.
Select the metric you want to apply from the dropdown.
Next, you can define the value by entering a specific number and selecting one of the operators: Equal to, Greater than, or Less than.
Also, select the color that will be displayed in the cell if the above conditions are met.