Social media reporting is very important for your team, clients, or yourself.
And you need to personalize it (every time) for these people.
But personalization is expensive, awfully time-consuming, and not the most exciting part of the job.
Surely, in 2026, with all the AI and GPTs, social media analytics tools can do it for you?
Well, some of them can. Maybe!
But which one? How do you decide?
At my previous startup, I drowned myself in analytics tools, using BI Tools (Tableau, Looker Studio), Product Analytics Tools (Amplitude, Mixpanel), and whatever else I could find.
Surely picking a social media reporting tool should've been straightforward? (Boy, was I wrong.)
So, after trying everything that was recommended on G2, Gartner, Reddit, Facebook Groups & IRL.
Here's the compilation of the 15 best social media analytics tools (IMHO).
We would also consider how standardized things are, how much you can personalize, and what it will cost.
TLDR: The market is filled with standardized (cute?) reporting, but there are only a few building executive, operational, strategic, or real-time dashboards.
What Are Social Media Analytics Tools?
Social media analytics tools aggregate different social channels in one dashboard and help you track key metrics like reach, impressions, likes, comments, shares, engagement rate, click-through rate, profile follows/unfollows, and website visits.
These tools are essential to measuring the performance of your social media posts and campaigns. They also offer insights into trending ideas, the best times to post, hashtag suggestions, and audience sentiment.
Comparison - Best Social Media Analytics & Reporting Tools
Tool | Pricing | Supported Network |
|---|---|---|
Statusbrew | $129/month, 3 users, 10 social profiles | Facebook, Instagram, TikTok, LinkedIn, Threads, X (Twitter), YouTube, Bluesky WhatsApp, Pinterest, Reddit, GMB, App Store, Play Store |
Sprout Social | $199/seat/month, 5 social profiles | Facebook, Instagram, TikTok, LinkedIn, Threads, X (Twitter), YouTube, Pinterest, Reddit, GMB, Yelp, Shopify, TripAdvisor |
Hootsuite | $99/month, 1 user, 10 social profiles | Facebook, Instagram, X (Twitter), TikTok, LinkedIn, Pinterest, YouTube, Threads, Reddit, GMB, WhatsApp, Google Analytics (web), Adobe Analytics |
Buffer | $5 per month per social channel | Instagram, Facebook, Twitter, LinkedIn, TikTok, Threads, Bluesky, Mastodon, YouTube, GMB, Pinterest |
HubSpot | $890/month, 3 users, 50 social accounts | Facebook, Instagram, X (Twitter), LinkedIn, YouTube |
Brandwatch | Custom Pricing | Facebook, Instagram, X (Twitter), LinkedIn, TikTok, WhatsApp, YouTube, Reddit, forums, blogs, GMB, Tumblr, reviews, news |
15 Best Social Media Analytics Tools in 2026
Let’s explore the features of some top social media analytics software, including the metrics you can track and the social networks they support.
Statusbrew
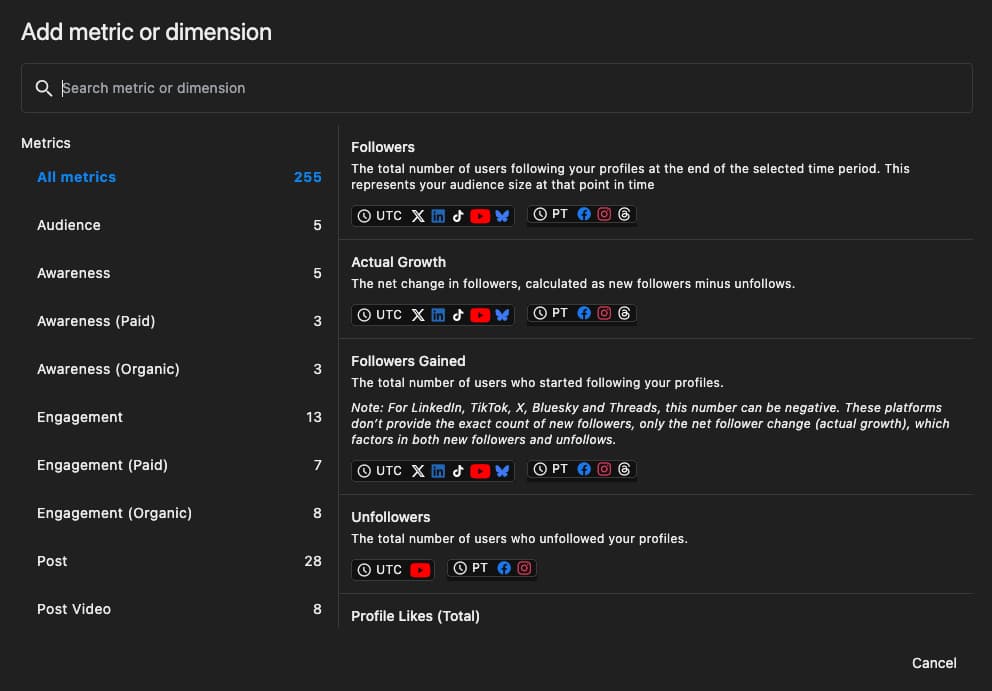
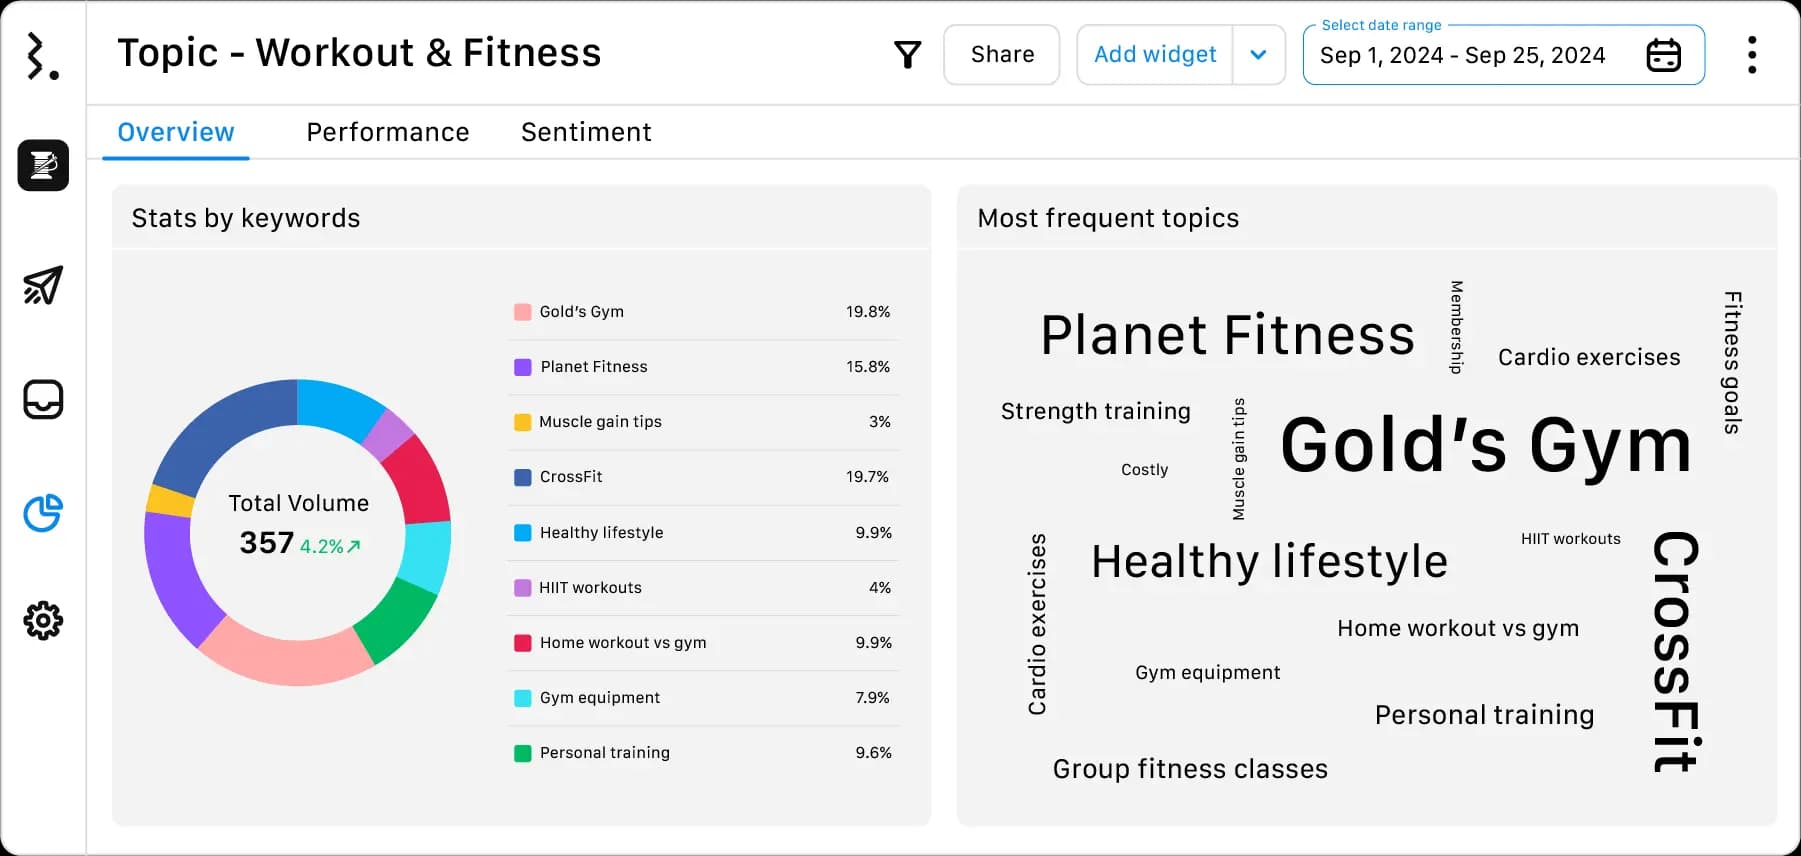
Statusbrew is a flexible social media analytics tool that offers advanced, accurate reports of your social media content performance and brand visibility. You can use 250+ KPIs (tracked by Statusbrew) to create an actionable plan to boost engagement.
You can leverage pre-built 20+ reporting templates for different use cases and industries.
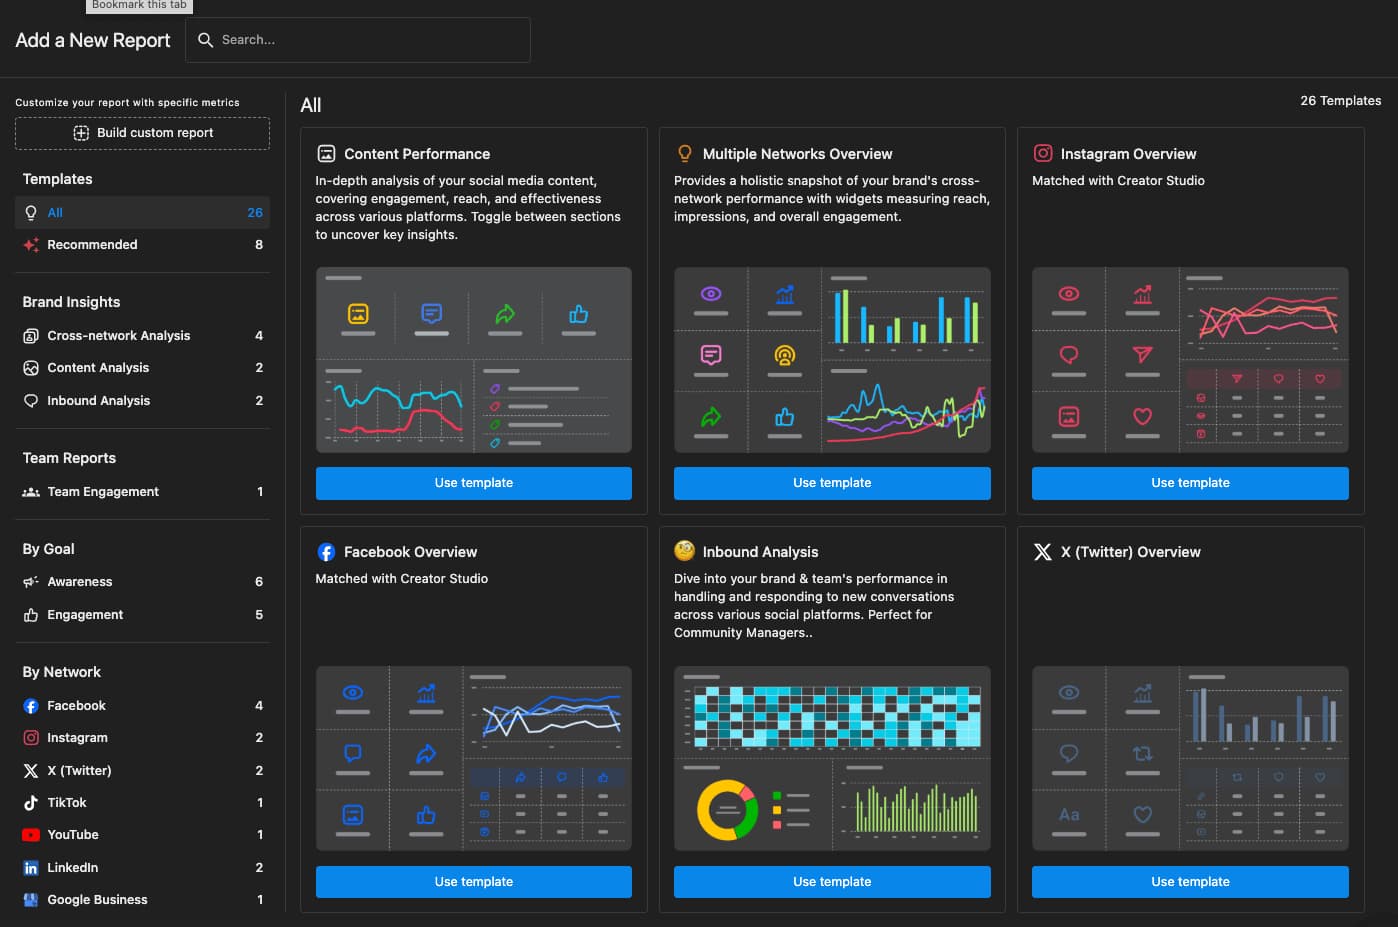
These templates are fully customizable with widgets and data visualizations to tailor your reports to meet specific needs and preferences.
📽 Watch the video below to get the look and feel of Statusbrew's social media analytics tool.
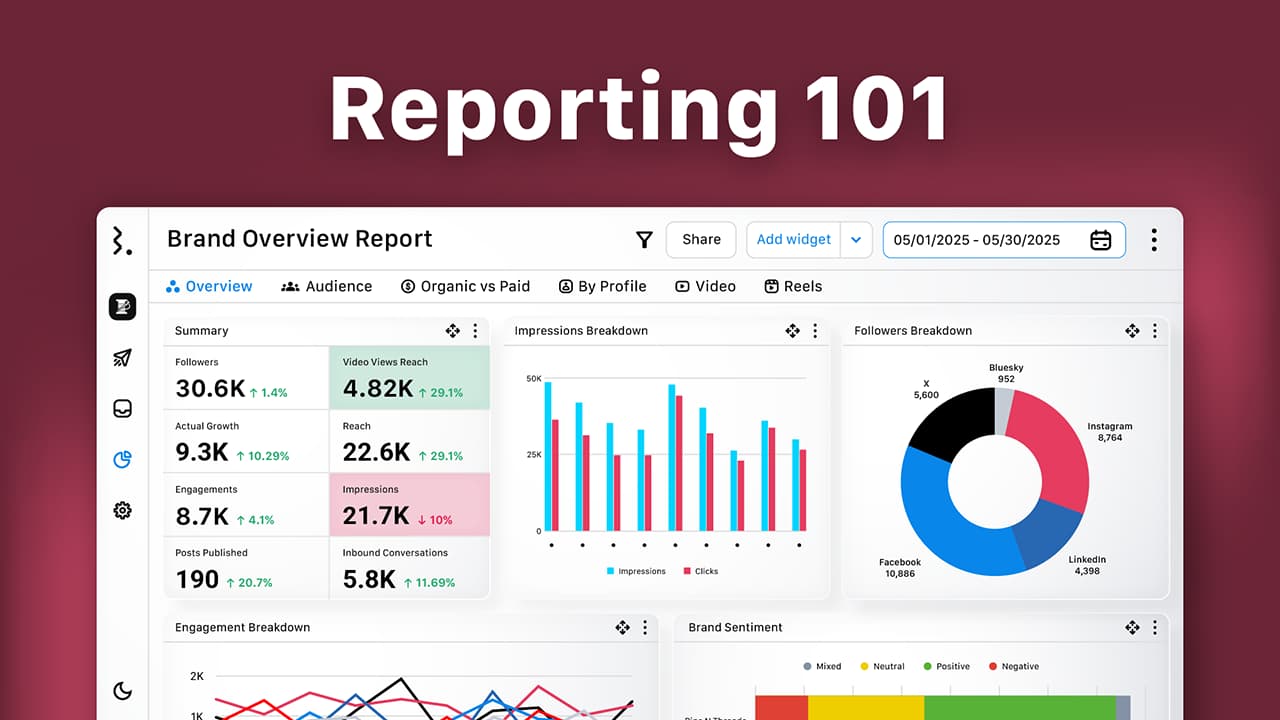
You can break down your analytics by social networks, profiles, posts, content types, geography, sentiment, tags, and more.
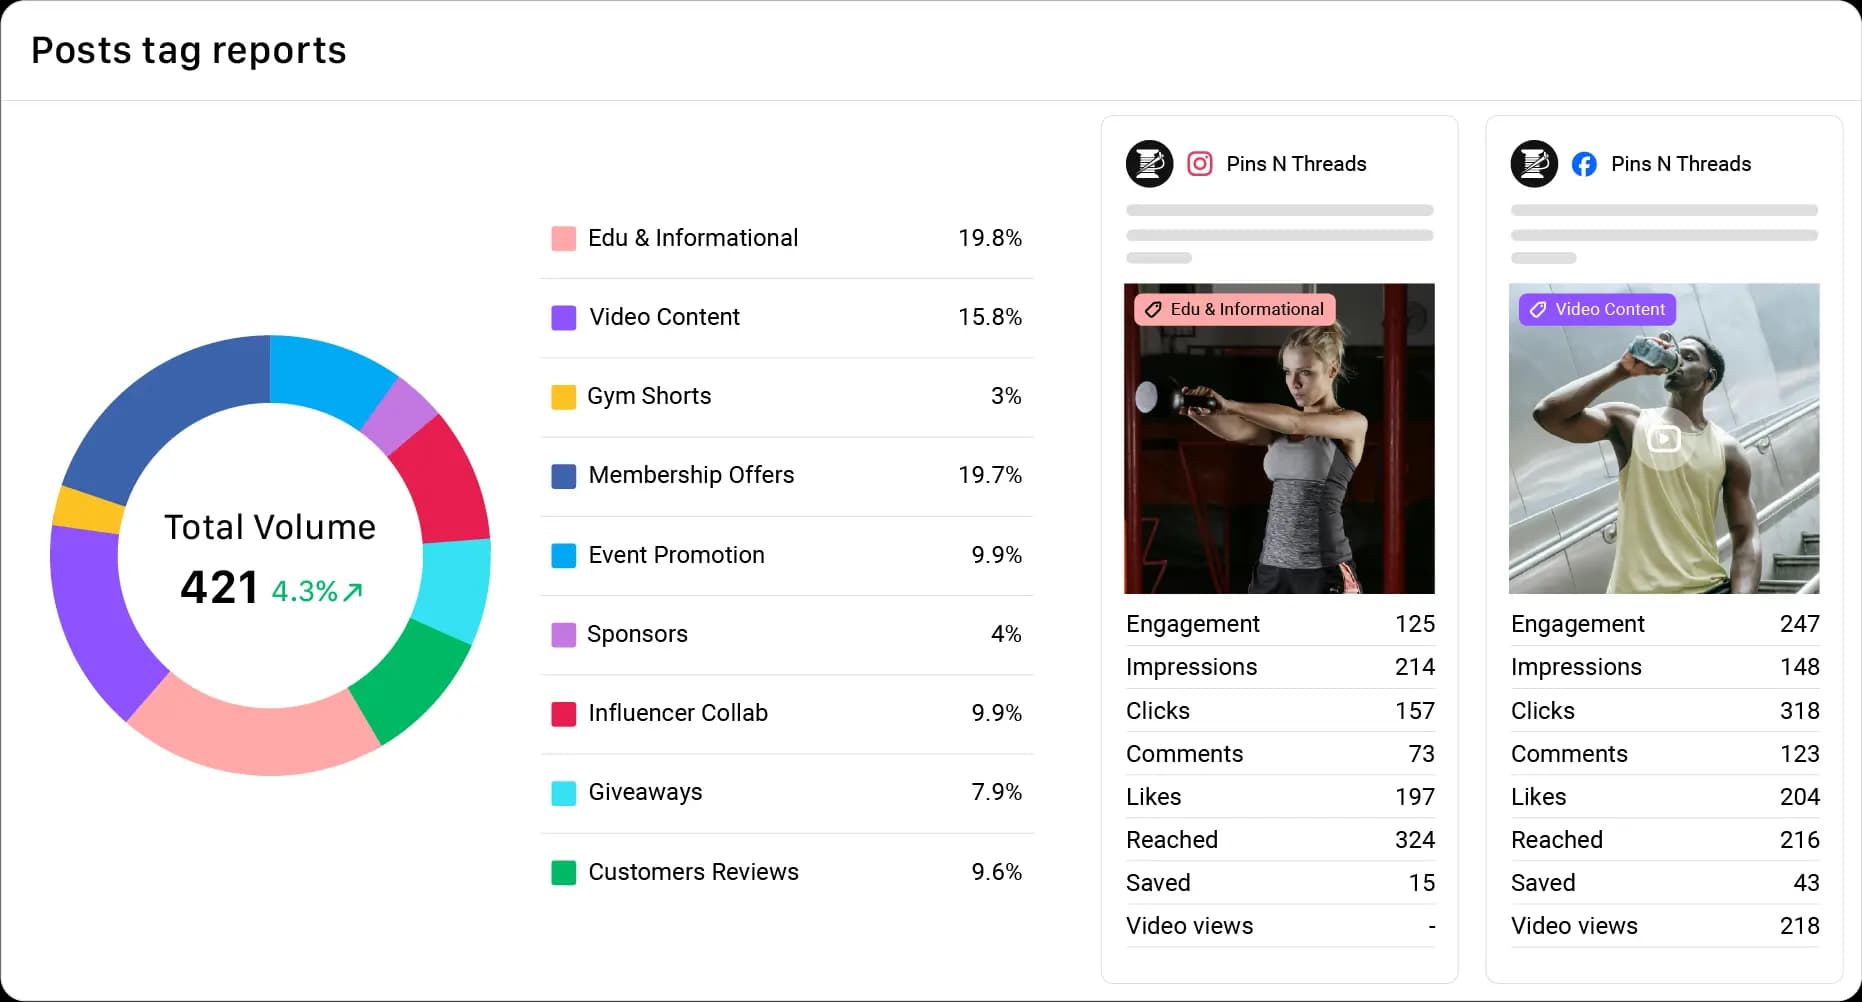
And categorizing content and engagements with internal tags/labels provides aggregated data for specific types of posts, engagements or users.
As a social media team manager, you can monitor your team’s social conversations and identify top performers based on response times and tickets closed.
Platform's brand monitoring tools track conversations about your brand, audience, industry, competitors, or keywords on Reddit and X (formerly Twitter).
You can easily export your data as PDF or CSV files and integrate it with other tools.
You can schedule daily, weekly, or monthly reports to be automatically sent to both internal and external stakeholders.
You can lock the date range, set an expiration date for the link, and delete sections to ensure that all recipients view only the important data.
White-labeling is also possible, which is helpful for social media marketers and agencies.
Top KPIs out of 230+ tracked in Statusbrew
Post-performance report: Interactions, engagement rate and more
Network overview: Followers gained, impressions, overall growth of each network (which is growing the fastest
Reputation breakdown: Brand mentions, reviews, average rating
Paid vs. organic reports (Facebook + LinkedIn)
Audience Sentiment
Audience demographics: Location, age, gender
Competitor audience growth analysis compared to yours
Industry trends: Trending keywords, your share of volume
Story analytics: Reach, impressions, engagement, clicks
Supported social media platforms: Facebook, Instagram, TikTok, LinkedIn, Threads, X (Twitter), YouTube, WhatsApp, Pinterest, Bluesky, Reddit, GMB, App Store, Play Store.
Customer support: Statusbrew provides human-only support, and you can chat with the team right now to understand how the Statusbrew analytics feature stands out.
Pricing
Starts from $129 per month, 10 social profiles, 3 user seats
Free 14-day cardless trial
Migration assistance
❤️ What you'll get:
Lifetime Data Retention
Customizable Analytics
No Long Contracts
No Hidden Addons or Upselling
Anxious about Data Migration?
We can set up reporting dashboards for you, along with up to 18 months of data backfill.Sprout Social
Sprout Social is also a great reporting tool that helps you track key performance metrics across social media channels, identify market trends, and measure your campaign ROI.
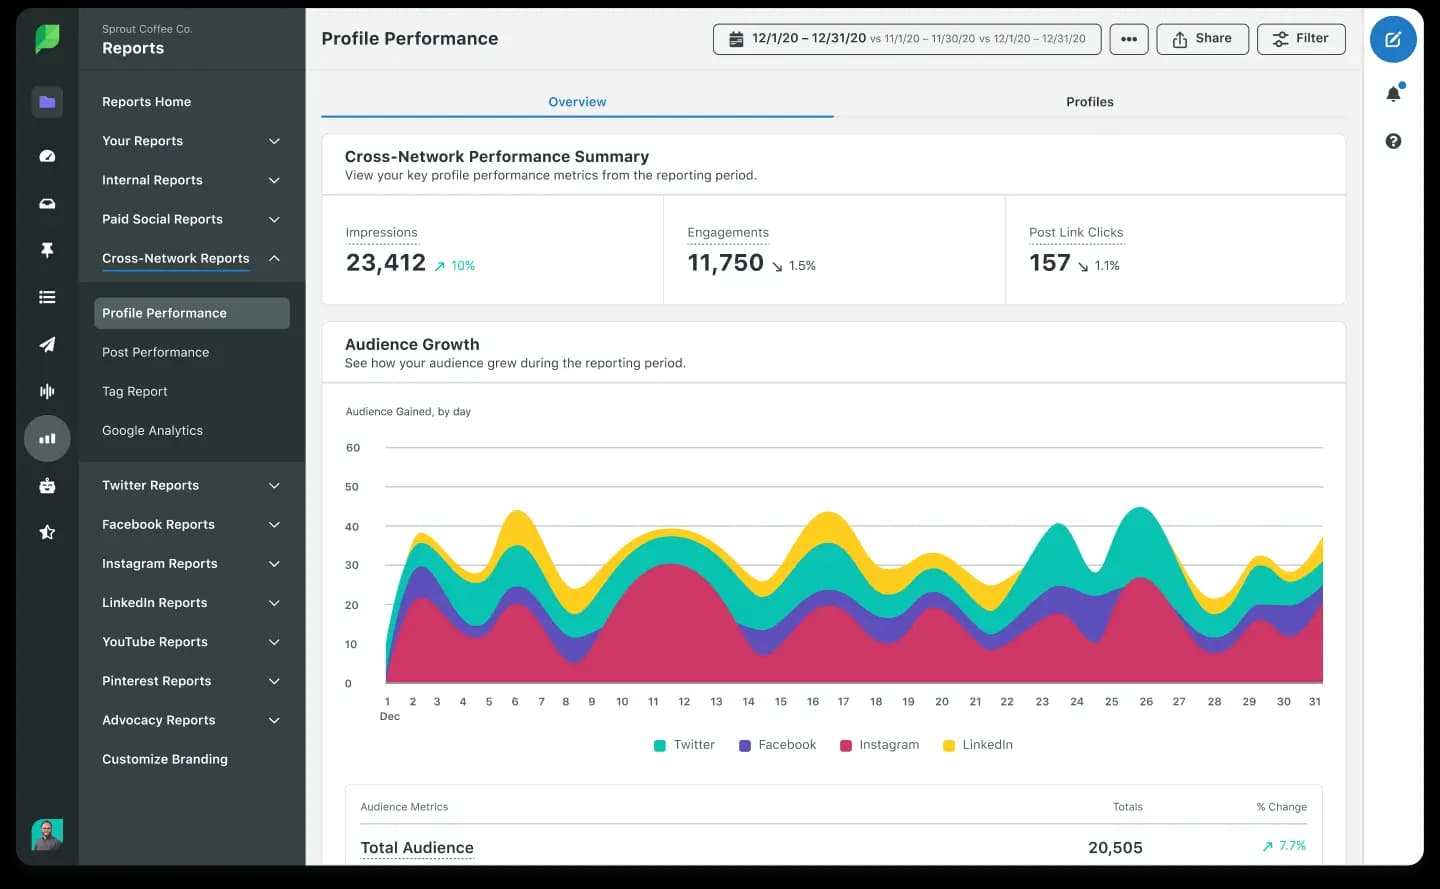
For a more granular view, you can even dive deeper into each social media profile’s performance, including impressions, engagement, clicks, and audience growth.
Sprout Social also lets you track post-level analytics.
Conduct competitor analytics and review your paid vs. organic social media performance data to plan and optimize your future strategy.
Beyond pre-built templates, Sprout Social’s Premium Analytics tools let you choose relevant KPIs that best fit your business goals to create a custom report. You can quickly share them with your clients or stakeholders via dynamic shareable links.
Advanced filtering based on tags, content, and message type helps you highlight metrics that matter most for different social media posts.
Its Listening tool provides insights into audience demographics, industry influencers, campaign performance, share of voice, and brand sentiment analysis.
Top KPIs you can track using Sprout Social
Network-specific, cross-network, and post-level insights: Impressions, engagements, clicks, audience growth, reactions, comments, shares, etc.
Competitor analysis
Paid vs. organic performance data
Top hashtags/keywords tracking for X (Twitter), Instagram
Social listening metrics: Brand conversations, sentiment research, influencer recognition, customer feedback
Paid post analytics: Top-performing channels, top campaigns via video views, conversions, impressions, and engagement
Team activity report: Response times, completed cases
Supported social media platforms: Facebook, Instagram, TikTok, LinkedIn, Threads, X (Twitter), YouTube, Pinterest, Reddit, GMB, Yelp, Shopify, TripAdvisor
Pricing
Starts from $199/seat/month, 5 social profiles
A 30-day free trial
🌱 Learn more about Sprout
1. Top Sprout Social Alternatives for Brands 2. Sprout Social Pricing Breakdown
Hootsuite
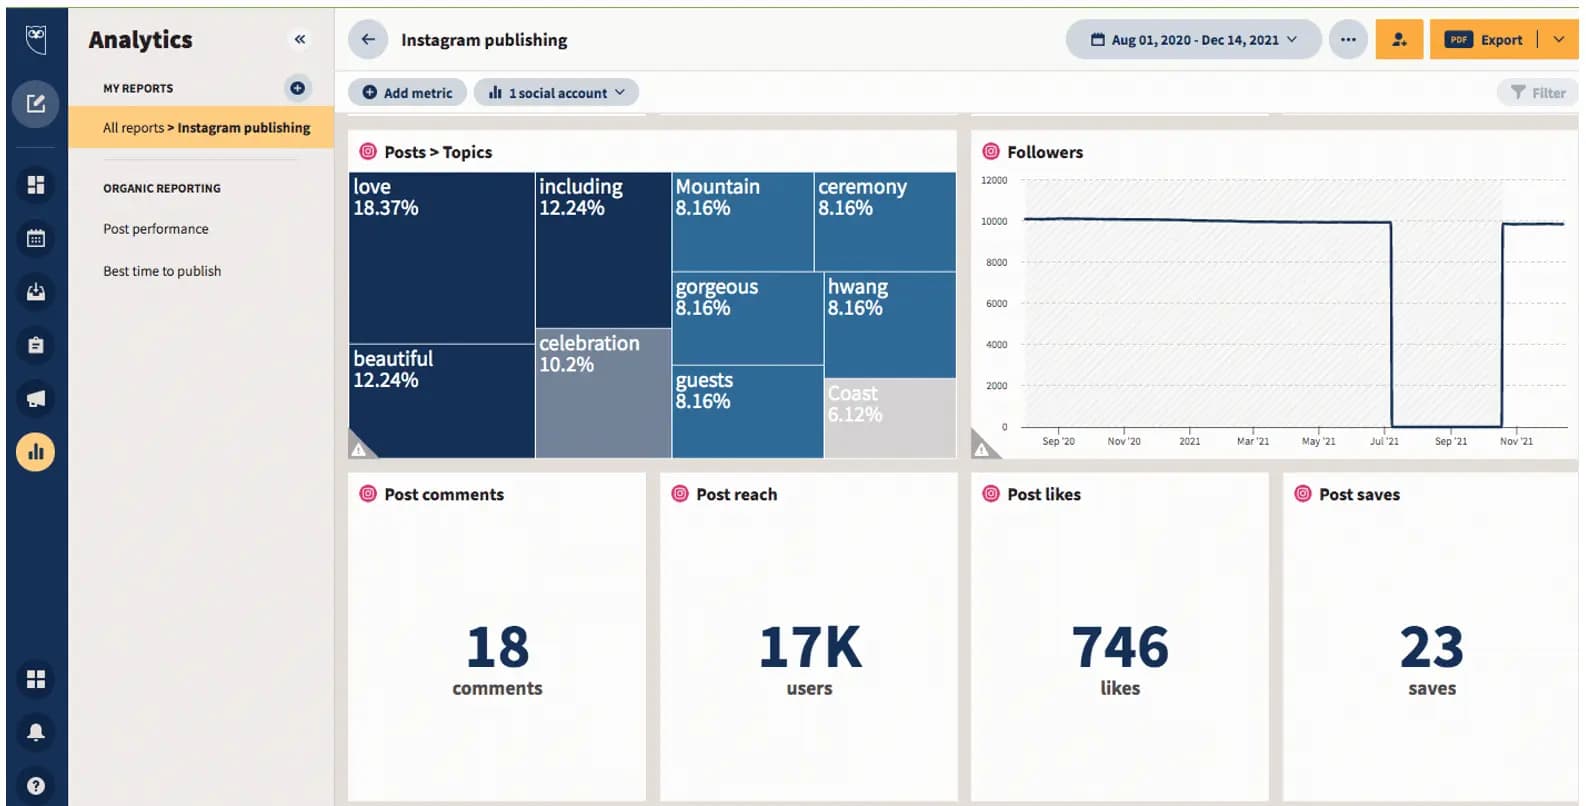
Hootsuite offers a complete picture of your social media performance by consolidating data across platforms into a single view. This includes tracking metrics like reach, engagement rate, video views, follower growth, website clicks, and engaged users.
Identify your top campaigns that delivered the most leads and conversions and compare them against your competitors.
Find the best time to post on each social media account based on your target audience’s active times and unique historical data. Posting at optimal helps you drive more engagement and clicks.
Hootsuite’s new AI, OwlyWriter AI, lets you find and repurpose your top-performing posts in seconds.
See how your social media posts contribute to your website traffic and leads. With its Industry Benchmarking feature, you can also see how your results compare to average performance stats within your industry.
Hootsuite’s social listening tool tracks conversations about your brand, industry, and competitors.
You can build custom reports and export data in different formats such as PDF, CSV, and XLSX to suit your specific needs.
Monitor your team’s productivity through response times and resolution times for assigned posts, mentions, and comments across platforms.
Top KPIs you can track using Hootsuite
Profile/page-level performance metrics: Follower growth over time, profile visits, engagement rate, negative feedback rate
Post-level performance metrics: Reach, impressions, engagement rate, clicks, comments, shares, saves, video views, video reach
The best time to post
Competitor analysis for up to 20 competitors
Top-performing posts
Best days of the week, performance and revenue-wise
Trending hashtags
Paid ads performance on Facebook, Instagram, X (Twitter), and LinkedIn
Supported social media platforms: Facebook, Instagram, X (Twitter), TikTok, LinkedIn, Pinterest, YouTube, Threads, Reddit, GMB, WhatsApp, Google Analytics (web), Adobe Analytics
Pricing
Starts from $99/month, 1 user, 10 social profiles
A 30-day free trial
🦉 Learn more about Hootsuite
1. Top Hootsuite Alternatives for Agencies 2. Hootsuite Pricing
Note: Sprout Social and Hootsuite are great tools. If you plan to hire one, I suggest you read our Sprout Social vs. Hootsuite comparison blog to understand which best suits your requirements.
Buffer
Buffer helps you measure your social media performance and get in-depth insights into specific social profiles. These include your follower growth, audience, impressions, and engagements.
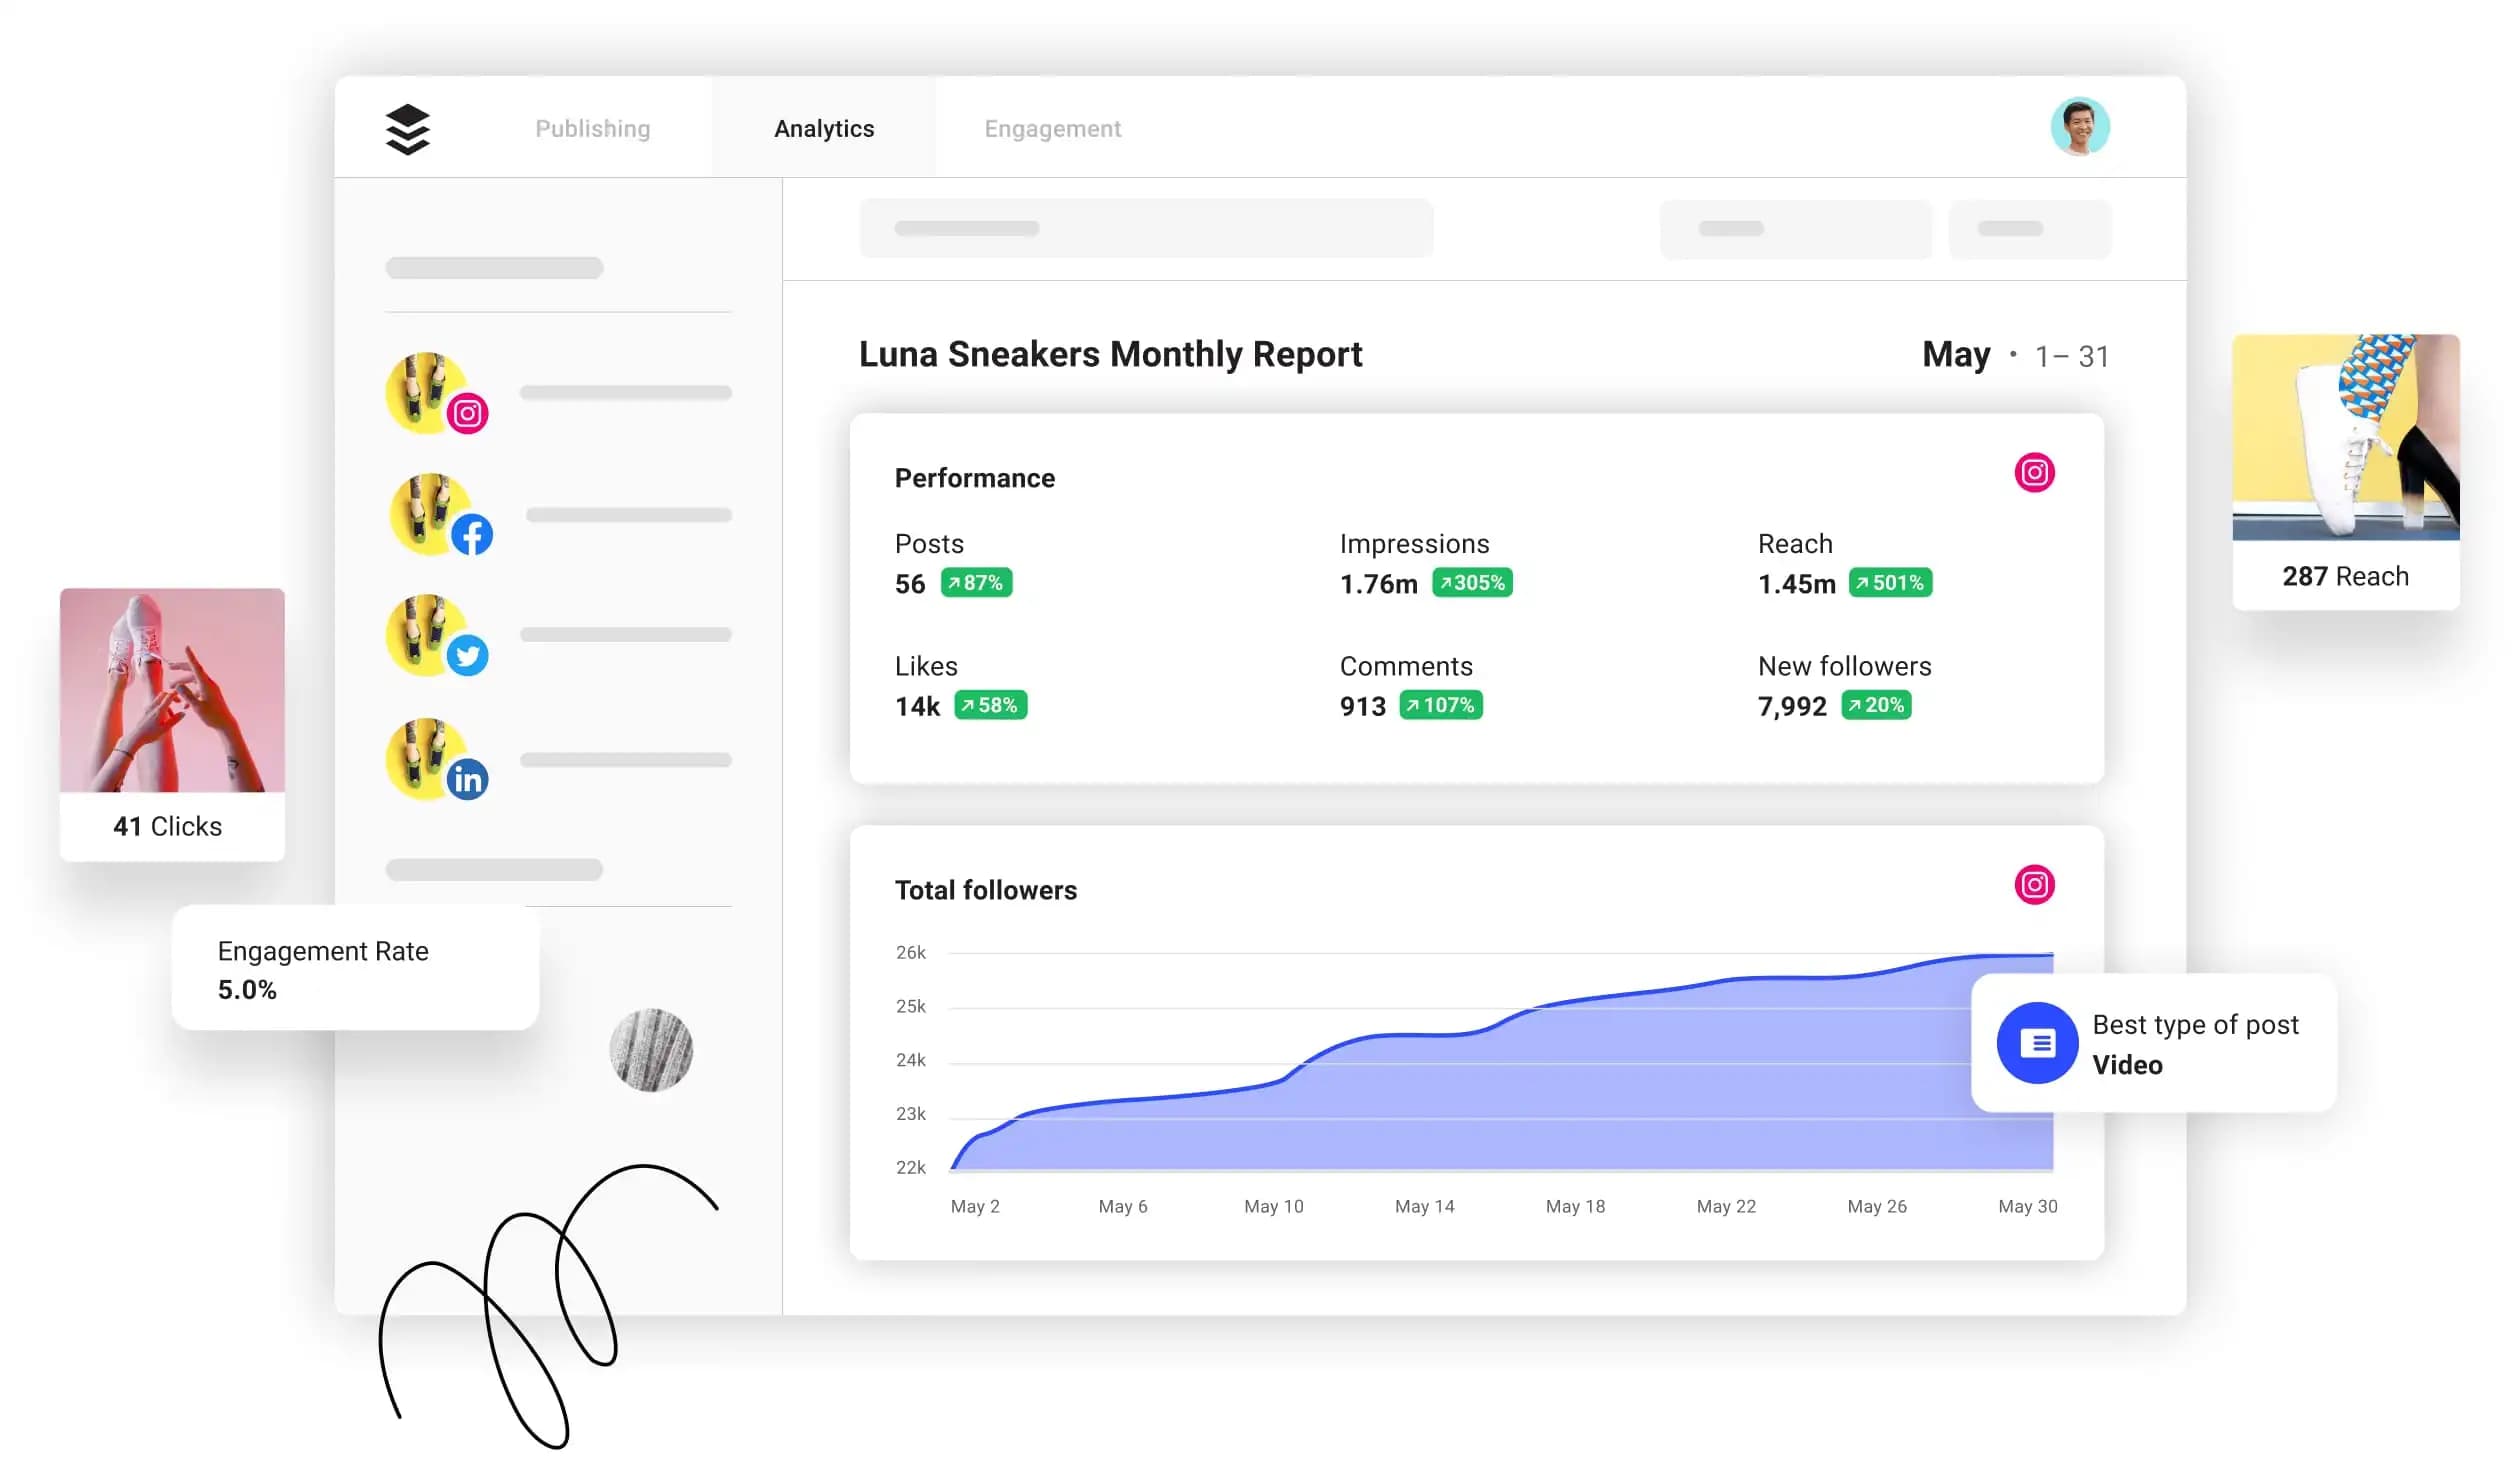
Check the individual performance of your posts, Stories, and hashtags to analyze what types of content perform best.
Create custom reports by adding metrics and charts from multiple social channels. Buffer also lets you create white-label reports and download them as PDF.
Top KPIs you can track using Buffer
Account analytics: Follower growth, engagement rate, impressions
Stories and post analytics: Reach, impressions, likes, comments, engagement rate, Story completion rate
Hashtag performance data
Audience demographics: Age, gender, location
The best type of post: Text, video, image, or link
The best time to post
The best frequency to post for maximum engagement
Boosted post insights
Supported social media platforms: Instagram, Facebook, Twitter, LinkedIn, TikTok, Threads, Bluesky, Mastodon, YouTube, GMB, Pinterest
Pricing
Starts from $5 per month per social channel
Try for free for 14 days
🔷 Looking for alternatives to Buffer?
HubSpot
HubSpot's social media software offers a detailed view of how social media influences your bottom line. It lets you monitor and compare performance across social media channels, accounts, campaigns, and publishing times.
You can monitor your brand’s social mentions to gauge how your audience perceives your business and content. Your team can identify critical interactions and respond quickly to avoid trouble.
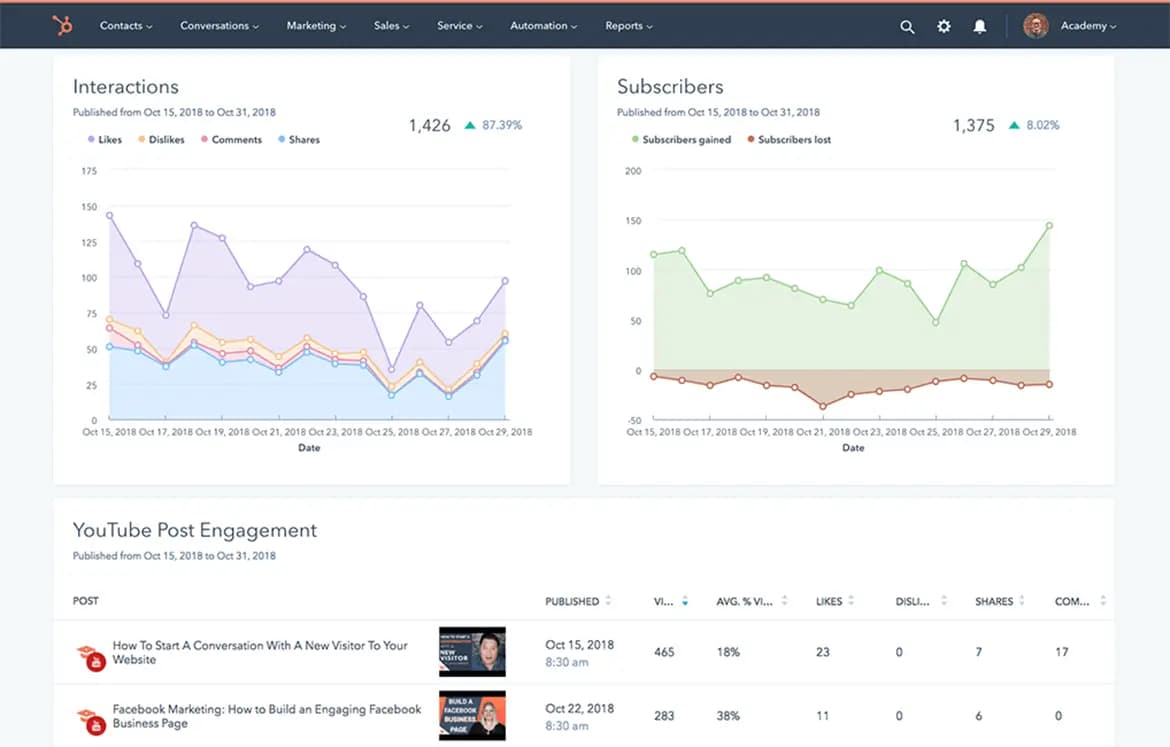
HubSpot’s YouTube reports shed light on how your audience interacts with your videos, including likes, comments, shares, and watch times.
Associate your social posts with relevant marketing campaigns to see how they impact your overall marketing strategy.
Top KPIs you can track using HubSpot
Post-specific data (for the first 30 days of publishing it): Impressions, likes, reactions, replies, shares
Clicks on shortened URLs when you post via HubSpot
Top 10 performing social media posts: Filter them by most clicks, interactions, impressions, or shares
Audience report: Follower count, follower growth over time
YouTube account analytics: Subscribers count, video views, watch times, shares, likes/dislikes
Supported social media platforms: Facebook, Instagram, X (Twitter), LinkedIn, YouTube
Pricing
Starts from $890/month, 3 users, 50 social accounts
Try free for 30 days
Databox
Databox is a centralized analytics and reporting platform that brings all your performance data - social media and beyond - into one place.
With real-time dashboards, 120+ integrations, and powerful automation, it’s built to help marketers, agencies, and teams deliver executive-ready reports without manual work.
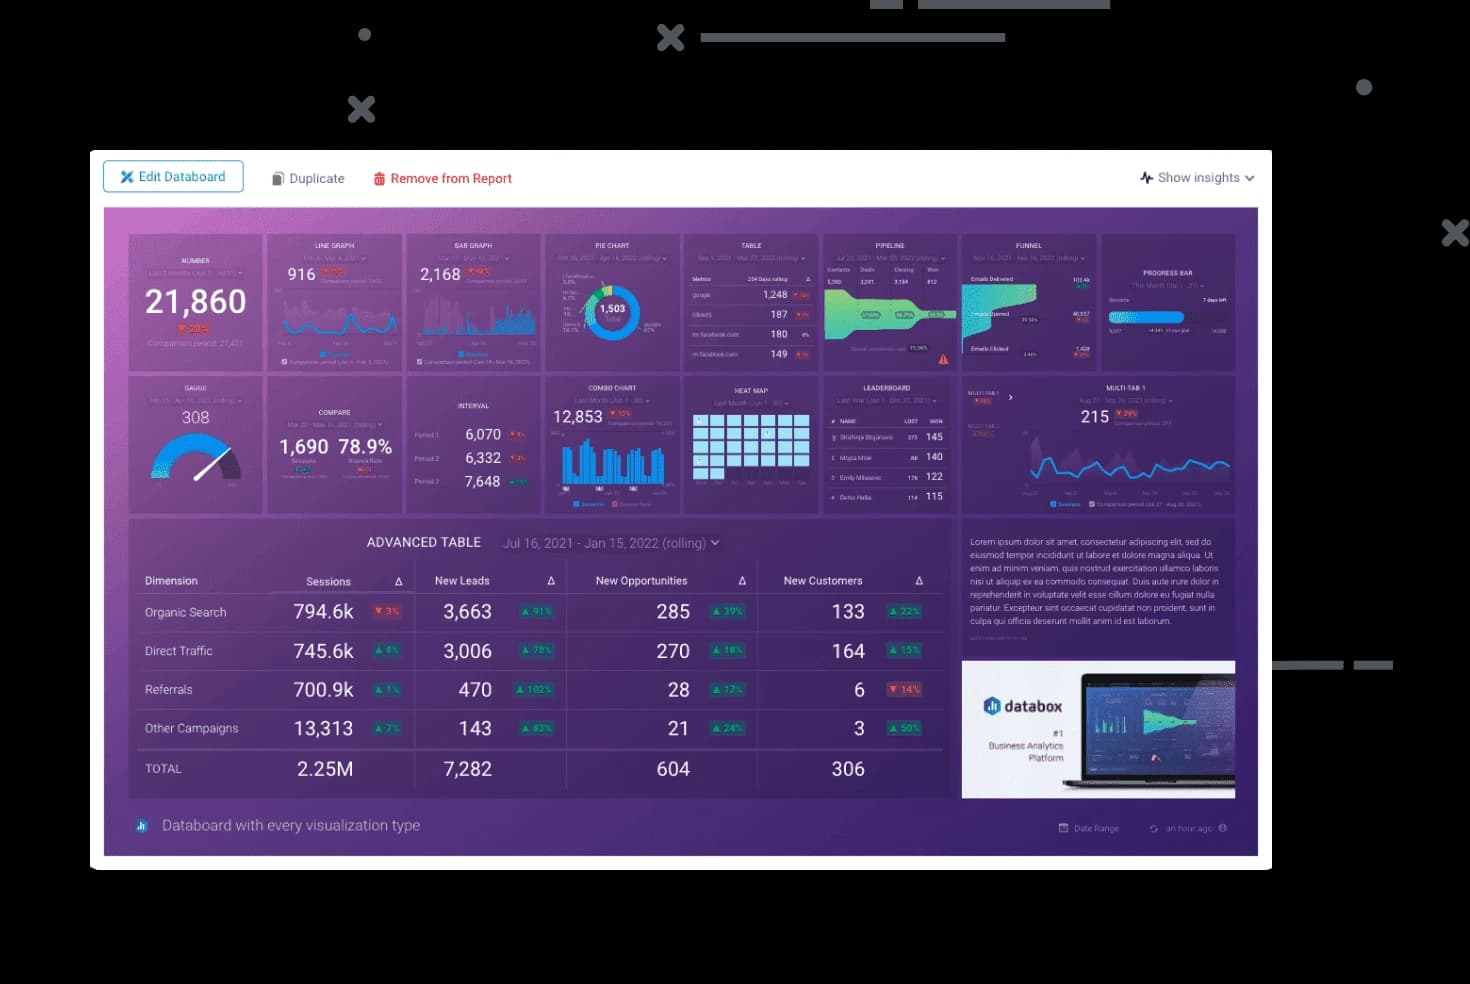
Databox dashboards are built for speed and simplicity.
Once your dashboards are set up, Databox automates the rest. You can schedule reports to send automatically - daily, weekly, or monthly - via email or Slack. Or, share a live dashboard link with clients or teammates so they always have real-time data at their fingertips, without needing to log in.
Top KPIs you can track using Databox
Social-driven website sessions, new users, and bounce rate
Assisted conversions & revenue attributed to each social network (multi-touch)
Leads and deals by original source (organic social, paid social, email, search, referral)
Engagement-per-post—impressions, clicks, reactions, comments, shares—benchmarked vs. industry median
Ad-creative performance (CTR, CPC, ROAS) shown next to the creative asset
Traffic-source trend lines (WoW / MoM) to surface emerging opportunities
Supported platforms
Social: Facebook, Instagram, X (Twitter), LinkedIn, YouTube, TikTok, Pinterest, Reddit
Web and marketing: Google Analytics, HubSpot, Shopify, and 120+ more integrations
Pricing
Free plan: Includes basic features and a limited number of data source connections
Paid plans: Start at $47/month (Starter). Try all premium features free for 14 days with the Growth plan.
Brandwatch
Brandwatch is a comprehensive social media analytics tool that offers a broad range of features through its social intelligence suite, Brandwatch Consumer Research.
Track your brand mentions, industry keywords, and hashtags, and get insights into conversation sentiment.
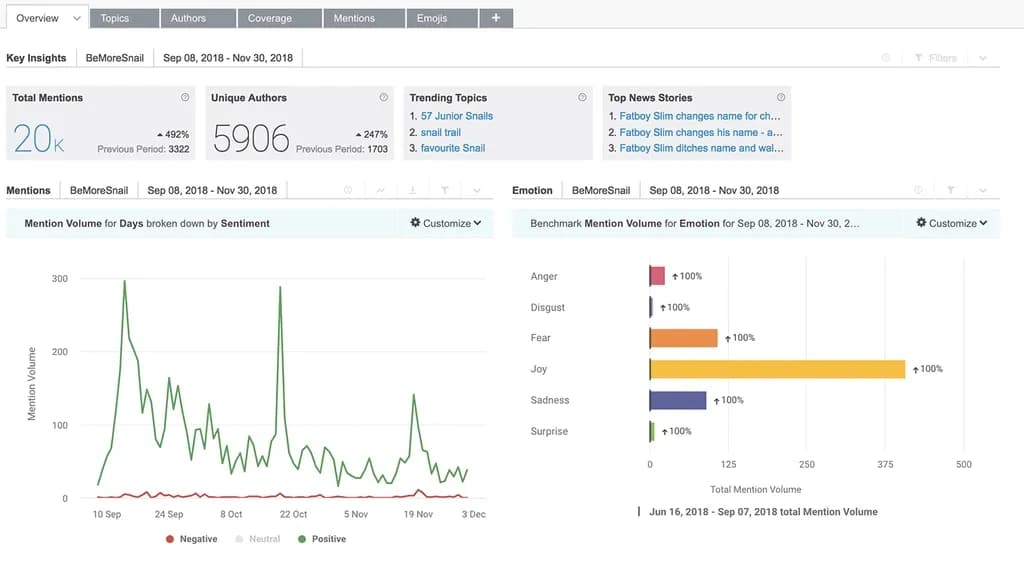
Identify trending topics and top stories in your niche market. Brandwatch also helps you identify your share of voice in trending conversations.
Brandwatch provides data visualization tools to build custom dashboards and views with various analytical data, depending on your needs.
Easily export reports in Excel, PPT, and PDF formats.
Top KPIs you can track using Brandwatch
Social mentions, unique mentions/authors, conversation sentiment
Trending topics and hashtags
Competitor analysis and share of voice
Supported social media platforms: Facebook, Instagram, X (Twitter), YouTube, Reddit, LinkedIn, forums, blogs, GMB, Tumblr, reviews, news
Pricing
Custom pricing and free demo
🕚 Explore more options like Brandwatch
Agorapulse
Agorapulse is a social media reporting tool that helps you assess the effectiveness of your social media efforts.
You can use it to track social media activity across your profiles. This includes engagement, number of engaged users, reach, and other essential metrics.
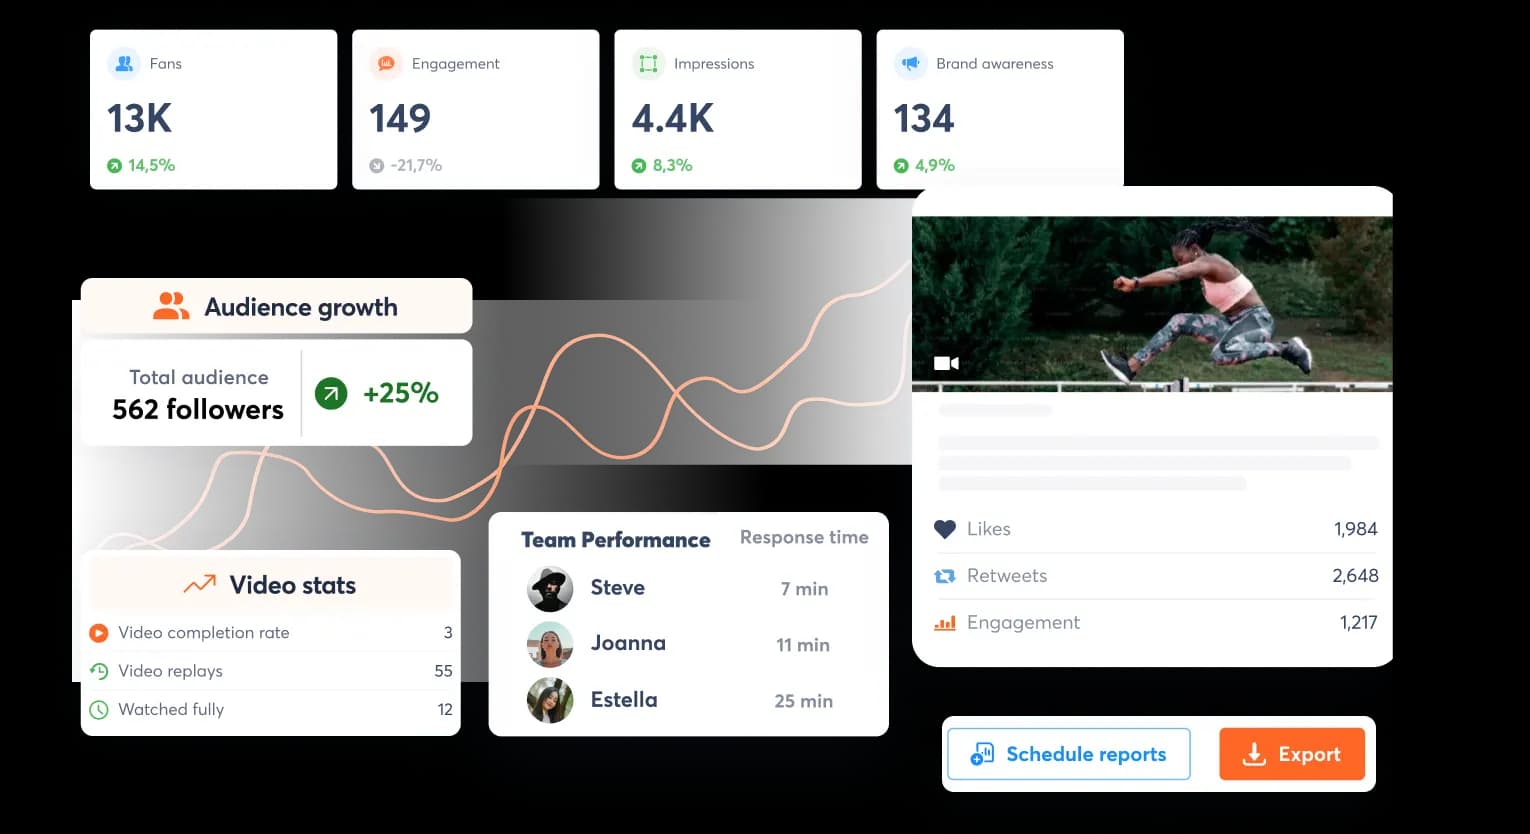
One unique feature that Agorapulse offers is that it helps you track your team members’ response times to comments. You can review how quickly your team responds to comments and what kind of responses they send.
It lets you create custom reports including metrics most important for your business. Along with metrics, you can also choose formats and periods and set a schedule for automated reports.
Lastly, it lets you export your social media analytics data in PDF, CSV, and PowerPoint formats.
Top KPIs you can track using Agorapulse
Content analytics: Reach, engagement, impressions
Profile analytics: Audience growth, accounts reached, posts published
Top-performing content for each profile
Team performance data: Replies sent, response times, reviewed comments
Social media return on investment (ROI)
Tag or label distribution report on published content
Competitor performance metrics
Video analytics: Views, clicks, autoplay metrics
The best time to post
The best type of post
The best content topics
Brand mentions and audience sentiment
Supported social media platforms: Facebook, Instagram, TikTok, LinkedIn, X (Twitter), YouTube, Pinterest, GMB
Pricing
Starts from $69 per user per month, 10 social profiles
Free plan with basic reporting, 1 user, 3 social profiles
🔶 Finding Similar Platforms like Agorapulse?
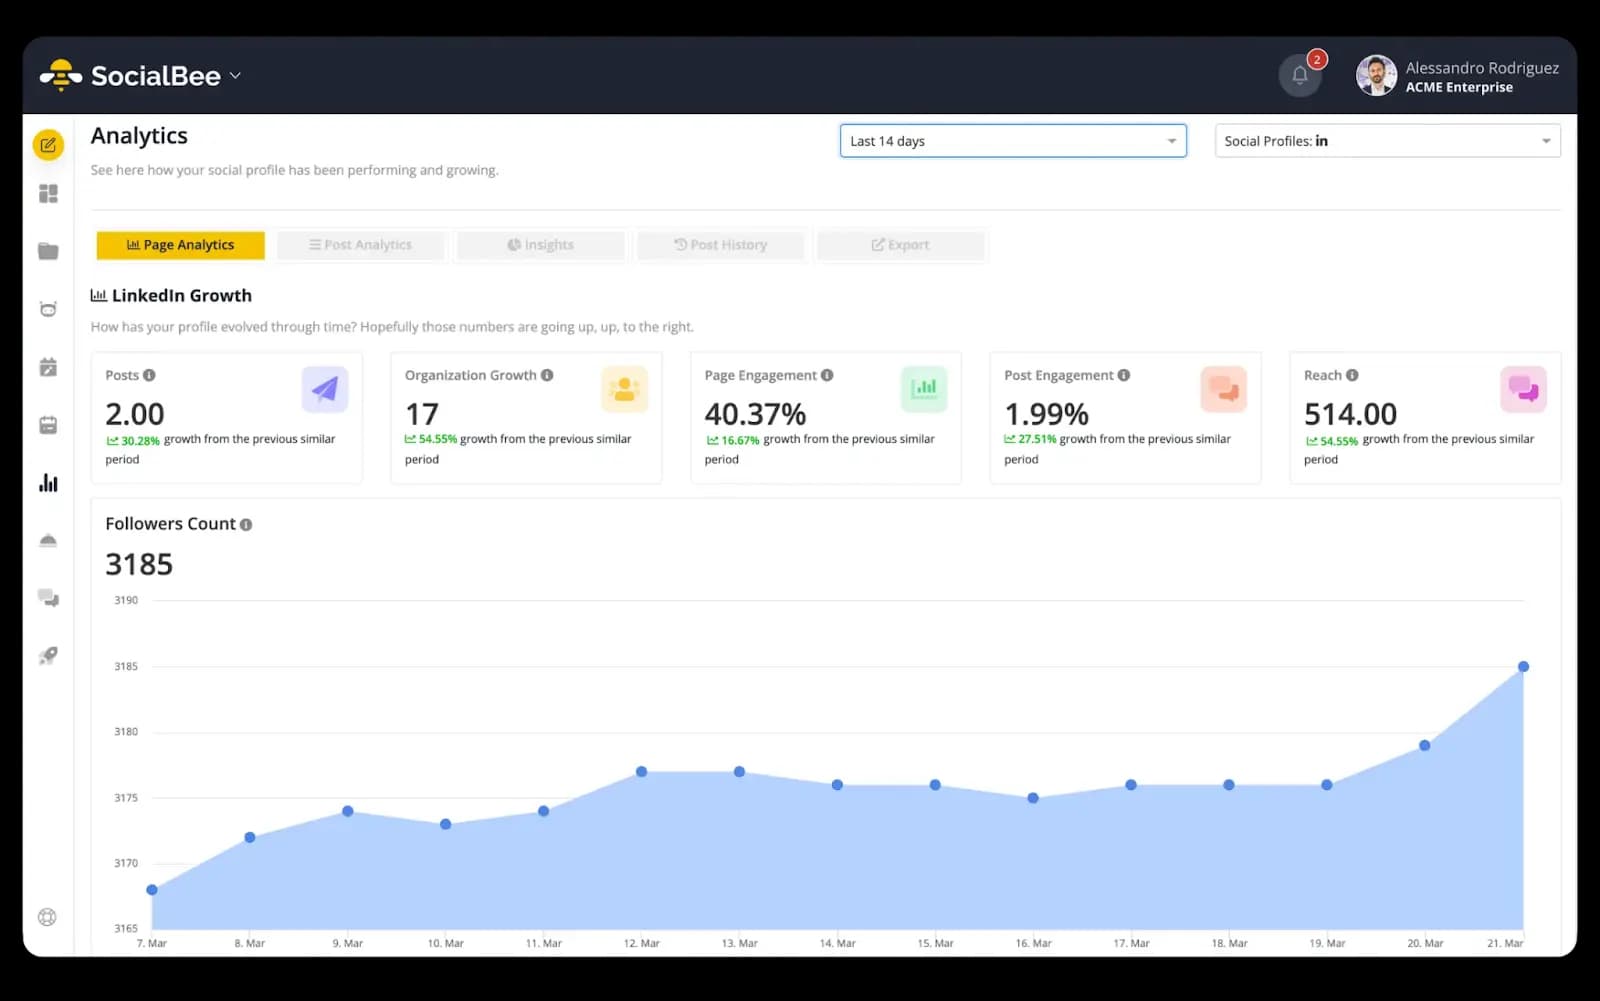
SocialBee
SocialBee makes it easier for small businesses to actually see what’s working on social media.
Instead of pulling reports from everywhere, you get a full view of your performance — reach, engagement, video views, follower growth, website clicks, and more in one user-friendly dashboard.
Gain valuable insights into your audience's demographics, including age, gender, location, and language. By filtering analytics across different social platforms and time frames, you can dive deeper into your performance.
SocialBee analyzes past posts to pinpoint the best times to engage your audience, ensuring your content reaches them when they’re most active.
You’ll also discover which types of posts and content categories resonate best with your followers. Generate PDF reports with key performance indicators to easily share with your team and clients.
Top KPIs you can track with SocialBee:
Page analytics (page growth, impressions, reach)
Post analytics (avg. posts per day, avg. reach per post, best post type)
Category metrics (top categories, best time to post)
Post type metrics (top post types, best time to post)
Post history (top performing posts)
Competitor analysis (Facebook)
Audience country & industry (LinkedIn)
Supported social media platforms: Facebook, Instagram, X (Twitter), LinkedIn, Pinterest, Google Business, YouTube, TikTok, Threads.
Pricing:
Starts from $29/month, 1 user, 5 social profiles
A 14-day free trial (no credit card required)
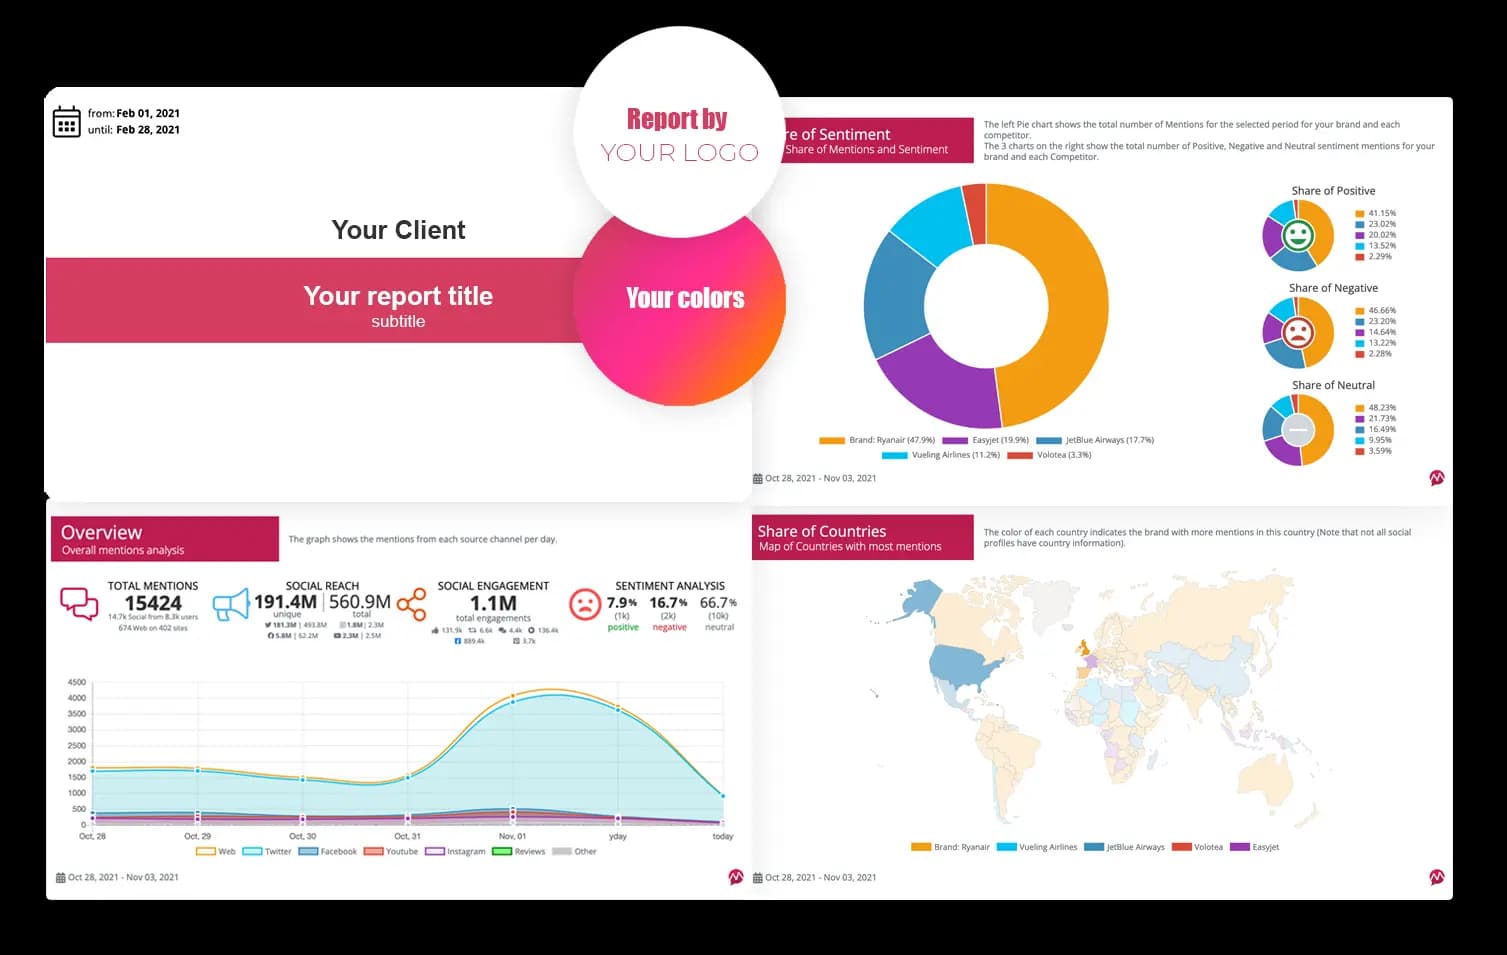
Whatagraph
Whatagraph is a marketing intelligence platform built specifically for marketing agencies. With over 55 integrations, you can bring all your paid and organic social data—from Facebook, Instagram, LinkedIn, TikTok, Meta Ads, and more—into one easy-to-use platform.
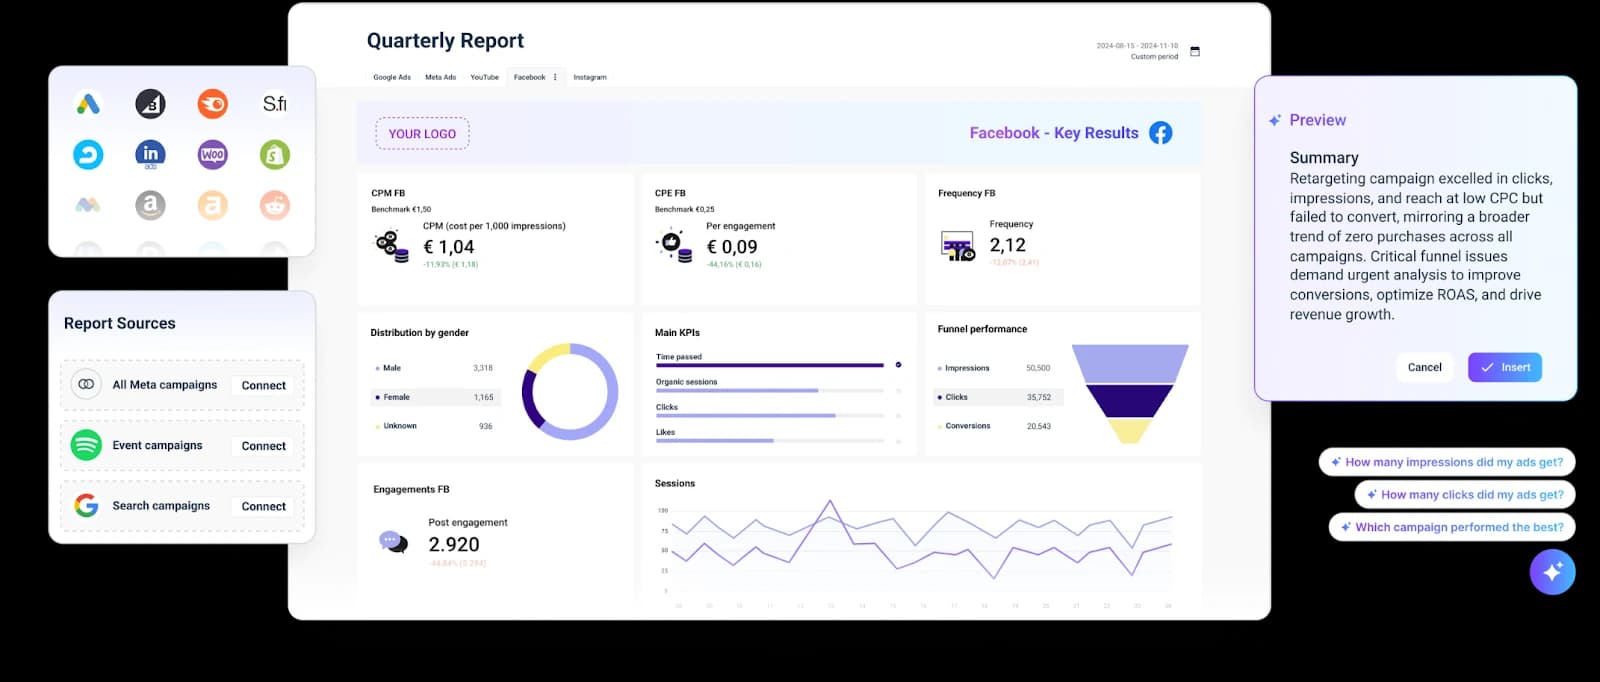
You can also create white-labeled social media reports in minutes using pre-made templates or dragging and dropping widgets onto a blank canvas.
Upload your company’s or client’s logo, customize color themes, and even choose custom domains to host your reports.
Then, share the reports through automated emails, live links, or PDFs.
What’s more, you can also ask Whatagraph’s AI chatbot any questions about your social media performance and get back accurate summaries in seconds.
Add performance summaries to your reports so clients and stakeholders know what’s going on at a glance. These two features can save you massive time on reporting and analytics.
Top KPIs you can track using Whatagraph:
Awareness metrics like impressions, reach, clicks, video views, and profile visits
Engagement metrics like average watch time, likes, shares, saves, comments, and replays
Audience growth metrics like total followers, follower dynamics, and new follows
ROI metrics like conversions and conversion rate
Best / worst performing social posts and ad creatives
Cross-channel metrics from paid social, organic social, PPC, SEO, and email marketing
Supported social media platforms: Facebook, Instagram, LinkedIn, Pinterest, Reddit, TikTok, and YouTube
Pricing:
Contact Whatagraph for a custom quote
Rival IQ
Rival IQ lets you track social media post performance, competitor performance, and online mentions. It’s a social media monitoring and analytics tool, combined into one.
Use it to conduct comprehensive social media audits, combining data from all your social profiles visualized in an easy-to-digest format.
Rival IQ, as the name suggests, is known for its competitive analysis and benchmarking capabilities. Get insights into your competitors’ audience analytics and recent content or growth trends.
It uses machine learning algorithms to detect your competitors’ boosted posts, allowing you to respond with similar content or strategy.
You can also do cross-channel competitor benchmarking.
Rival IQ offers pre-built but customizable templates. You can choose which metrics to track, for which period, and how you want to visualize the data.
It offers multiple options to export data, including NG, PDF, PPTX, and CSV formats. You can also email reports from the Rival IQ dashboard to your inbox. Lastly, the platform integrates with Google Data Studio to help you get even more comprehensive insights.
Top KPIs you can track using Rival IQ
Post analytics: reach, impressions, engagement
Cross-channel audience analytics
Best/worst-performing content
Hashtag performance
Popular topics
Post tags reports
Best day and time to post
Competitor audit and benchmarking
Brand mentions and audience sentiment
Supported social media platforms: Facebook, Instagram, TikTok, X (Twitter), YouTube
Pricing
Starts from $239 per month, 1 user, 5 networks, 10 accounts on each social channel, 1 user
A free 14-day trial
Planable
Planable is a collaborative social media management platform that combines content planning with robust analytics.
The reporting functionality is built with agencies in mind. Generate custom reports that pull exactly the metrics your clients care about, then share them via downloadable PDF files or shareable links that update in real-time. No more manual report building or chasing down data from multiple platforms.
What sets Planable apart is how it integrates analytics into the content workflow.
You can review performance data while planning future content, creating a feedback loop that improves strategy over time.
Top KPIs you can track using Planable
Cross-channel performance metrics: Reach, impressions, engagement rate, clicks
Account growth: Follower count, growth rate, profile visits
Post-level analytics: Likes, comments, shares, saves, video views
Top-performing content by engagement and reach
Audience demographics: Location, age, gender, professional info
Content type performance analysis
Custom date range comparisons
Supported social media platforms: Facebook, Instagram, X (Twitter), LinkedIn, TikTok, YouTube, Pinterest, Google Business Profile, and Threads.
Pricing
Basic: $33 per workspace per month
Pro: $49 per workspace per month
Analytics and Engagement adds-on, available separately from basic and pro plans.
Enterprise: Custom pricing that includes all features.
SocialRails
SocialRails provides a clean, visual analytics dashboard that consolidates your social media performance across all connected platforms.
Track engagement, views, follower growth, and growth rate at a glance with daily, weekly, or monthly breakdowns.
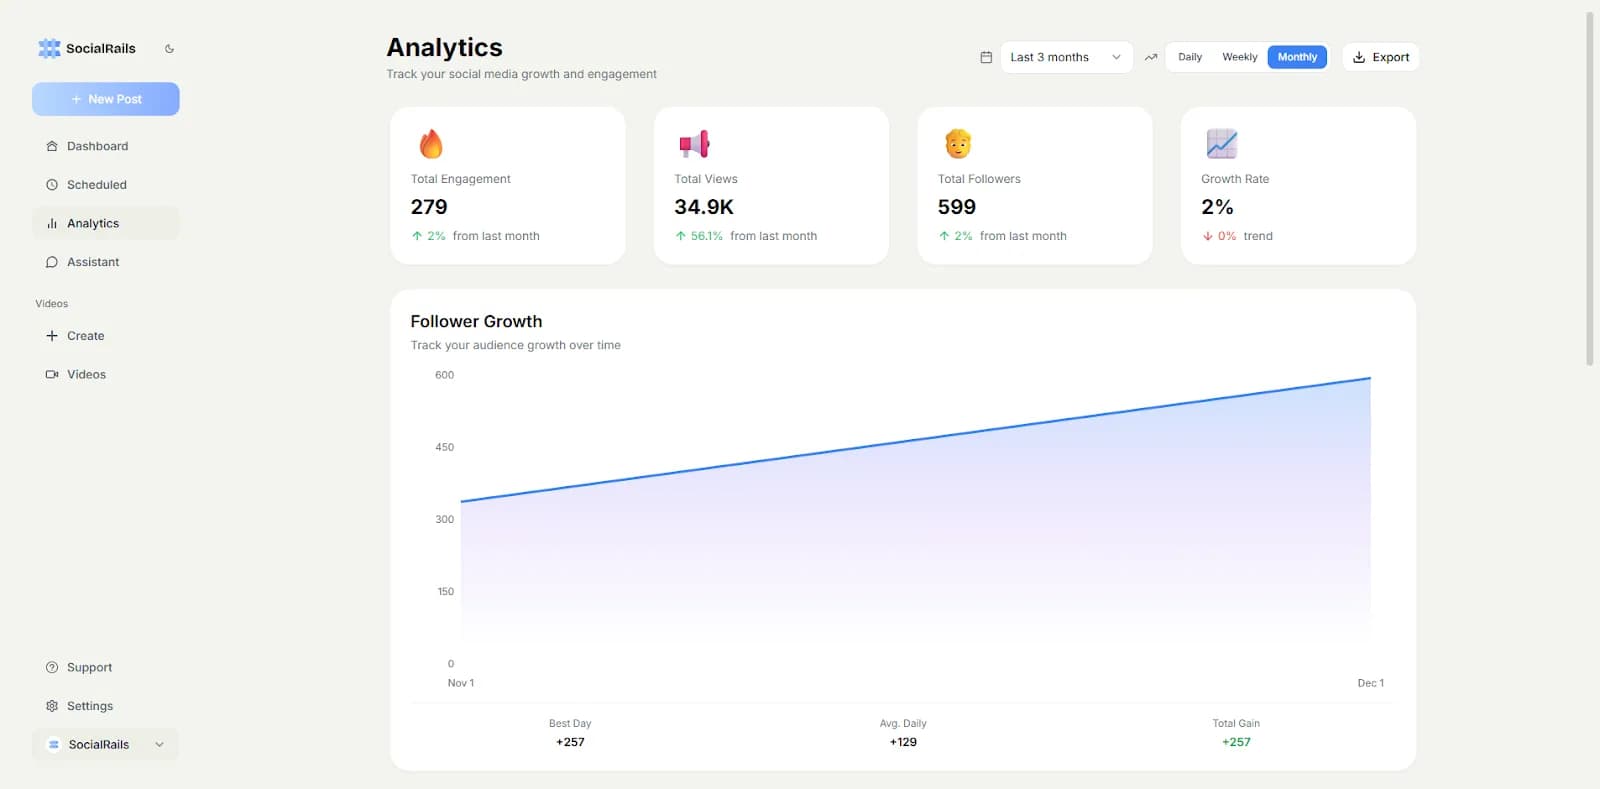
The dashboard highlights your best-performing day, average daily growth, and total gains over your selected period.
SocialRails' built-in AI Assistant can analyze your analytics data and surface insights about your content performance, helping you understand trends without manually digging through numbers.
Export your data when you need it for reporting or deeper analysis.
Top KPIs you can track using SocialRails:
Total engagement, views, and impressions
Follower count and growth rate
Best day for engagement
Average daily follower growth
Post-level metrics: likes, comments, shares
People talking about your page
Supported platforms: X, Facebook, Instagram, LinkedIn, TikTok, YouTube, Threads, Bluesky, Pinterest
Pricing
Creator: $29/month (27 connections)
Business: $49/month (90 connections)
Agency: $99/month (225 connections)
Free trial available
SocialPilot
SocialPilot offers a comprehensive view of your social media performance by consolidating key metrics from multiple platforms into a single dashboard. This includes tracking metrics like reach, engagement rate, follower growth, and website clicks.
Track the performance of your paid ads across platforms like Facebook, Instagram, and LinkedIn to measure ROI and optimize your campaigns for better results.
Top KPIs you can track using SocialPilot
Profile/page-level performance metrics: Follower growth, profile visits, engagement rate
Post-level performance metrics: Reach, impressions, clicks, shares, saves, and video views
Best time to post based on audience activity
Competitor analysis to monitor up to 20 competitors
Social media performance comparisons with industry benchmarks
Supported social media platforms: Facebook, Instagram, LinkedIn, Twitter, Pinterest, YouTube, Google Business Profile, Bluesky, Threads, TikTok, and more.
Pricing
Starts at $25/month, 1 user, 10 social profiles
A 14-day free trial is available
Iconosquare
Iconosquare provides easy-to-understand metrics and insights into your account growth and content performance across social media channels.
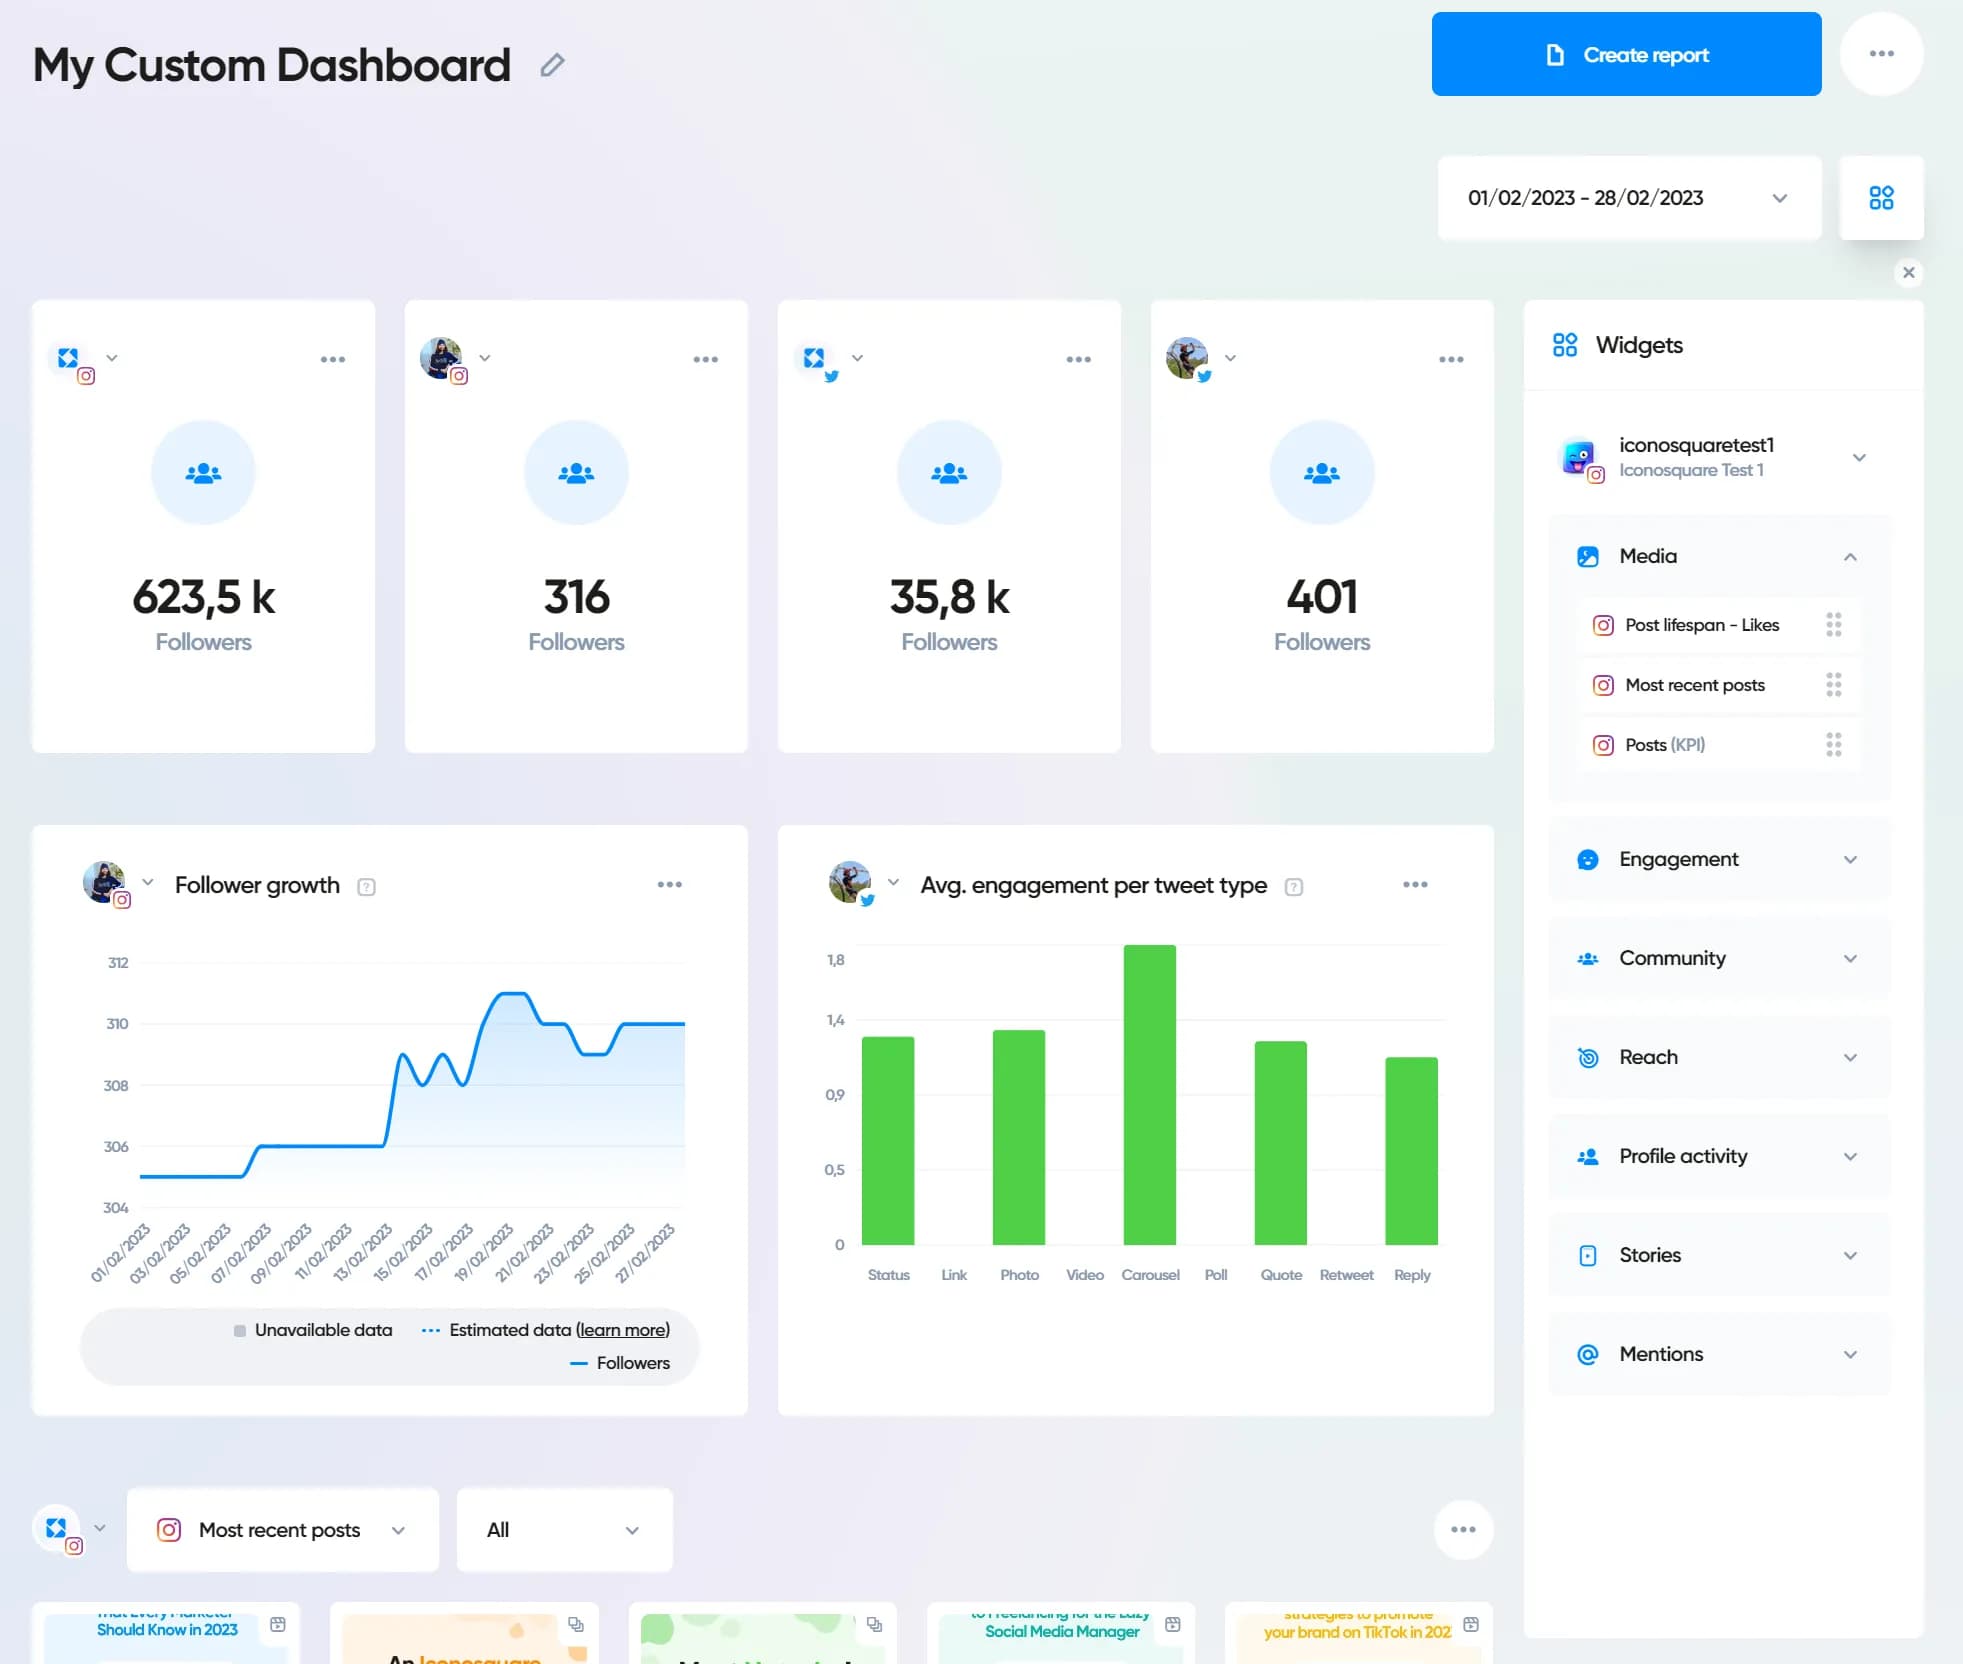
Understand your audience and community better, and see which content they resonate with the most.
You can create custom dashboards to track the metrics that matter to you and for specific time frames. This includes reach, impressions, engagements, Story insights, and follower growth.
Iconosquare lets you schedule and export data as visual graphs, presentations, XLS, and PDFs.
Top KPIs you can track using Iconosquare
Account analytics: Follower growth, engagement rate
Post analytics: Average posts/day, engagement rate, likes, comments, shares, video views, best posts
Story analytics: Impressions and reach by Story type, most completed Stories
Audience insights: Age, gender, languages, location, top countries and cities
Boosted post analytics
Competitor analytics
Trending hashtags
Supported social media platforms: Facebook, Instagram, TikTok, X (Twitter), LinkedIn
Pricing
Starts from $79/month, 1 user, 5 profiles
Mentionlytics
Mentionlytics is an AI social media analytics tool that is powerful and user-friendly. It helps you track online conversations about your brand, products, and competitors, from news sites, reviews, forums, and social media channels.
Use custom dashboards to track metrics that matter, such as brand awareness metrics, sentiment analysis, and share of voice among your competitors.
Mentionlytics’ Social Media Report Builder lets you create custom reports, track social reach and engagement, and capture the sentiment of comments, captions, and hashtags.
Top KPIs you can track using Mentionlytics
Social reach and engagement
Social and online mentions, sentiment analytics
Competitor analytics
Hashtag tracking
Supported social media platforms: Facebook, X (Twitter), TikTok, LinkedIn, Instagram, YouTube, Reddit, new websites, forums
Pricing
Starts from $49/month, 5 ysers, 10 social profiles
A 14-day free trial
Native Social Media Analytics Tools You Get with Social Networks
Now that we have explored the key features of third-party social media analytics & reporting tools and the metrics tracked by them, let’s check out what insights each social network’s native analytics tools offer.
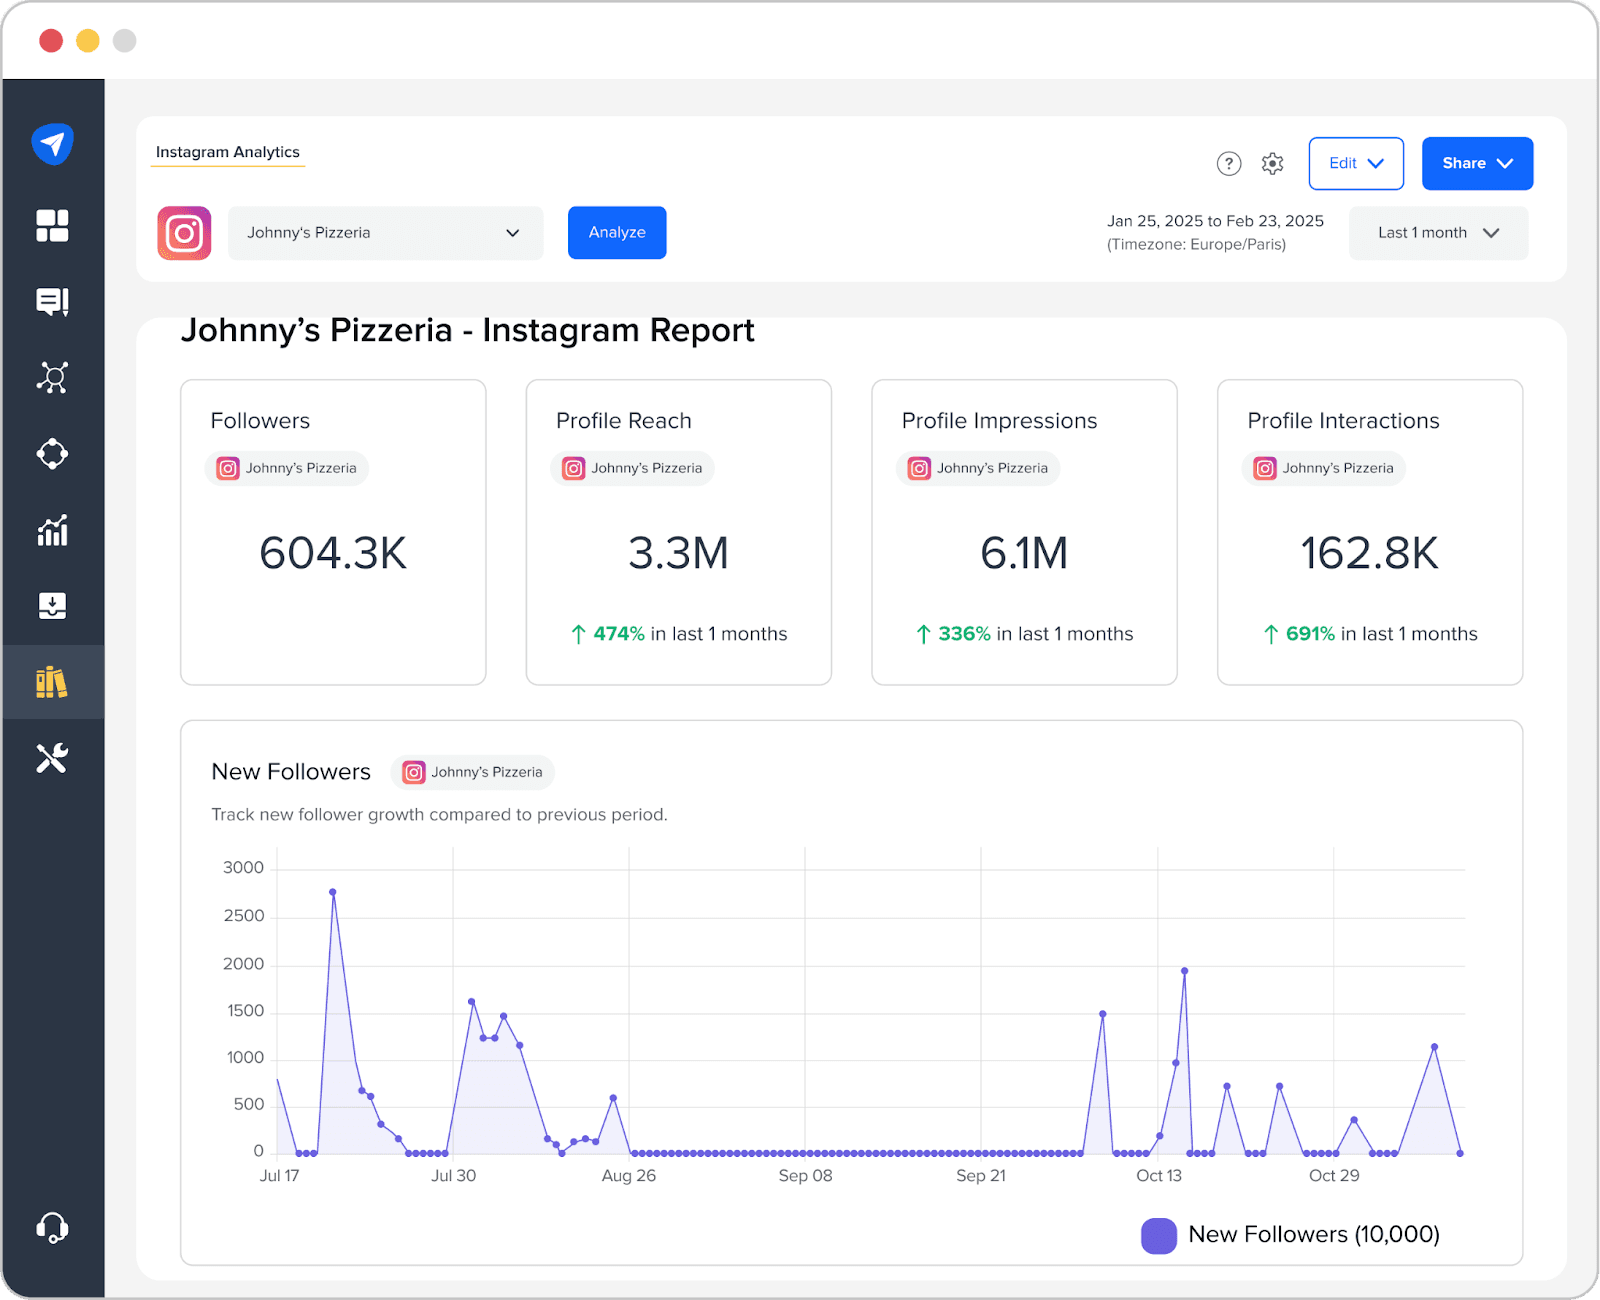
Instagram Insights
Instagram Insights offers account growth, content performance, and audience demographics data to Business and Creator account owners. If you have a personal account, you must switch your account type to start using Instagram Insights.
This native analytics tool shares details of accounts reached, total followers, and engagement percentages. You can filter data for different time periods.
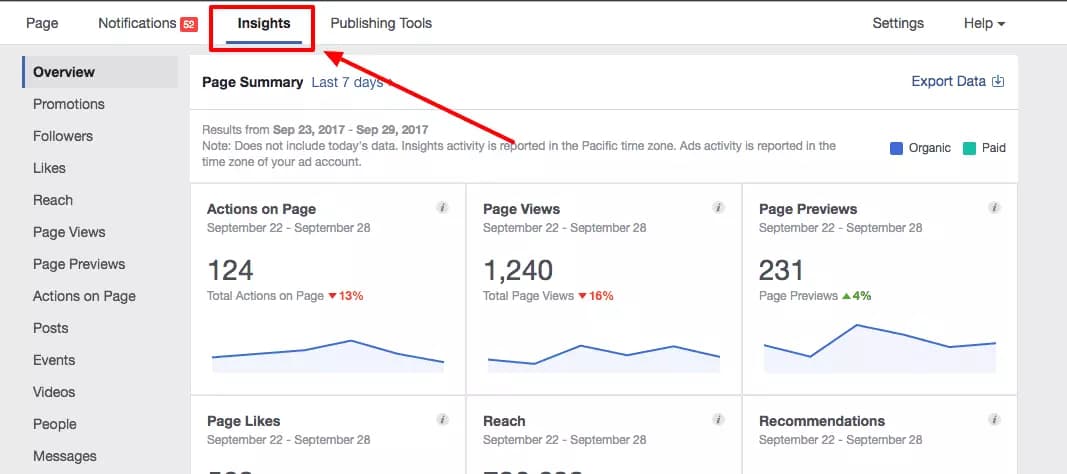
You can track who engages and interacts with your content to understand your audience better. You can also see your followers’ age, gender, and active times.
Get post insights on Instagram to see the performance of each of your posts and identify your top posts and Stories based on engagement.
Top KPIs you can track using Instagram Insights
Account analytics: Reach, accounts engaged, followers, follower growth
Audience insights: Top countries, age, gender, most active times
Post insights: Likes, comments, saves, shares
Top content
Pricing
Free
LinkedIn Analytics
LinkedIn Analytics provides insights into your post performance and audience growth.
You can see how many impressions and engagements your posts generate over time and identify your top-performing content.
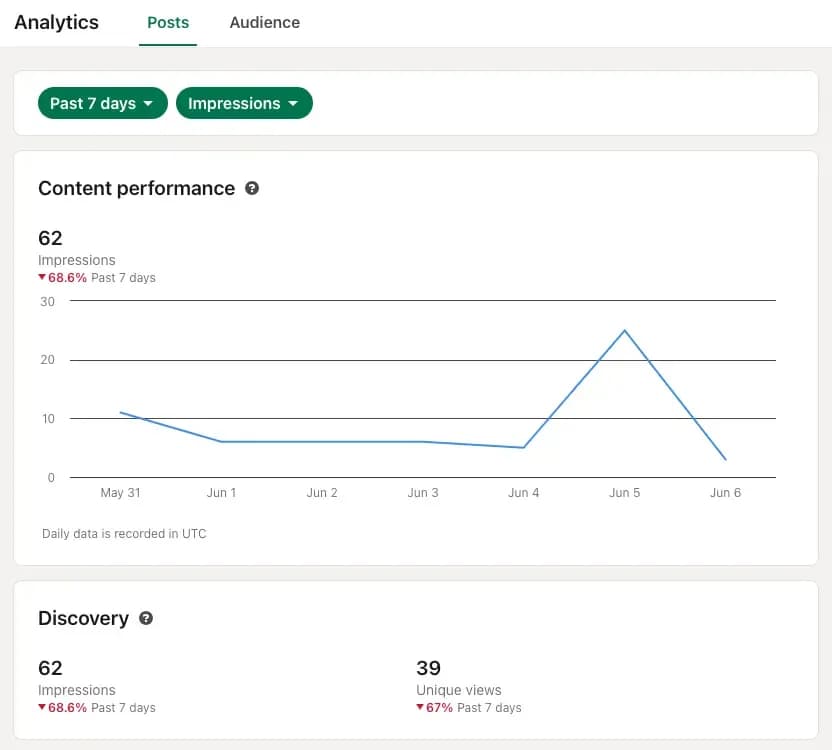
Get insights about new followers, top demographics, and job titles in your audience group.
LinkedIn company page analytics enable you to compare your page performance against competitors and track and export your ads performance.
Top KPIs you can track using LinkedIn Analytics
Profile views, followers, search appearances
Post impressions and engagements
Top-performing posts
Audience demographics, roles, and growth
Ads performance data
Pricing
Free
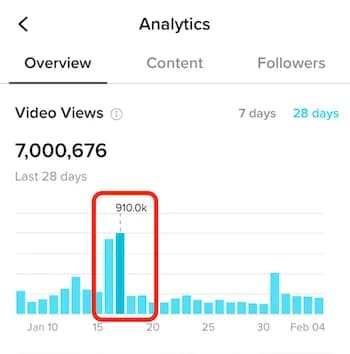
TikTok Analytics
To access TikTok Analytics, you need to switch to a Pro account.
If you’re a Pro account user, you can gain insights into your TikTok profile overview, content performance, and followers. This includes your follower data, video views and engagements, trending videos, audience location, and traffic sources.
Top KPIs you can track using TikTok Analytics
Profile analytics: Profile views, followers, video views, follower growth
Video views, likes, comments, plays, watch times, engagements, top videos
Audience demographics, location, traffic sources, most active times
Pricing
TikTok Pro account is free to use.
X (Twitter) Analytics
X (or Twitter) Advanced Analytics is available for Premium users only.
For personal profile, locate the post you want to view insights for, then click on the four vertical lines beside the like button. You’ll find performance insights on post impressions, engagements, detail expands, and profile visits.
X’s Premium Analytics offers more comprehensive insights into your content performance.
Top KPIs you can track using X (Twitter) Analytics
Post impressions, engagements, likes, comments, reshares, detail expands, profile visits
Pricing
X Premium accounts cost starts from $8/month
Pinterest Analytics
You can access Pinterest Analytics with a Business account and gain insights into your organic, paid, and earned engagements on all Pins. Track overall impressions, saves, outbound clicks, and top Pins driving the engagement.
Get to know your audience better; their age, gender, location, devices, interests, and more.
Identify Pinterest trends based on your niche keywords and capitalize on them to grow your account followers, Pin clicks, and outbound traffic.
Top KPIs you can track using Pinterest Analytics
Account analytics: Followers, views, impressions, engagement rate, saves, Pin clicks, outbound clicks
Pins performance: Engagements, impressions, saves, Pin clicks, profile visits, follows, outbound clicks
Video Pins: Video views, watch times, and the normal Pins metrics too
Popular Pins and ads
Audience insights: Age, gender, location, top countries, devices used, topics they’re interested in
Trending topics by niche keywords
Pricing
Free
YouTube Studio
YouTube Studio is a comprehensive analytics tool that helps you examine and manage your channel performance. You get insights into your channel views, subscriber growth, video views, impressions, and watch times for a specific period.
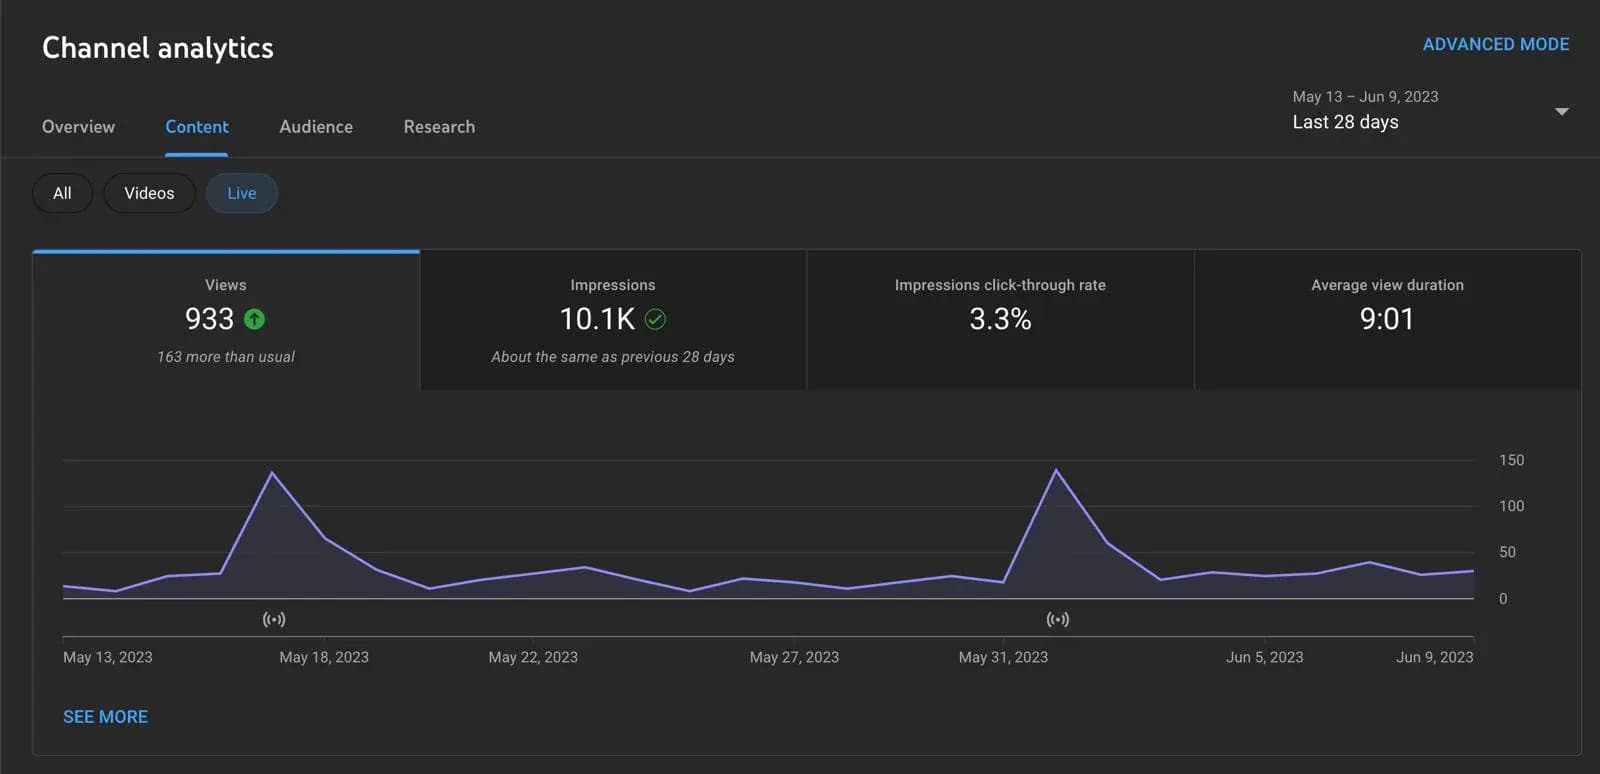
Track your YouTube videos and Shorts performances under the Content section of YouTube Studio.
You can find who your viewers are, their age, gender, top geographies, and how they find your content (traffic sources).
Top KPIs you can track using YouTube Studio
Content analytics: Video views, impressions, watch times, comments, likes vs. dislikes, new vs. returning viewers, traffic sources
Channel analytics: Views, subscriber growth, impressions vs. CTR
Audience insights: Unique viewers, returning viewers, subscribers, age, gender, location (for videos and Shorts), traffic sources
Pricing
Free
Make smart decisions with Social Media Analytics Tools
Choosing the right social media analytics tool is crucial for unlocking the full potential of your social media strategy. With 20+ powerful tools at your fingertips, each boasting unique features, pricing plans, and multiple supported networks, you have everything you need to get started.
Whether you want to track key performance indicators (KPIs) to refine your approach or explore new platforms to expand your reach, these tools give you the insights to drive meaningful engagement and growth.
Dive into the world of data to grow your social media presence and drive new traffic and leads.
Frequently Asked Questions
What is social media analytics?
Social media analytics involves collecting and understanding data from various social media networks to measure the performance of content and profiles. This process helps in developing both organic and paid social media strategies.
How much shall I pay for a social media reporting tool?
Social media reporting software pricing varies based on the supported networks and features. On average, a tool that supports all major networks costs between $100 and $400 per month.
Can I track my competitors with social media tools?
Yes, some advanced social media reporting tools, like Statusbrew and Sprout, allow you to benchmark your content performance against your competitors.
Can I try a social media analytics software for free?
Statusbrew offers a cardless 14-day free trial of the platform. You can access all the reporting templates and even build your own from scratch.
Can these tools help me discover the best time to post?
Yes. Most analytics tools analyze your audience’s activity and historical data to recommend optimal posting times for maximum engagement.
Can I track both paid and organic social media results?
Yes, most tools, like Statusbrew, distinguish between paid and organic posts, helping you attribute results and optimize spending.
Can I get data backfill?
Reporting tools can help you backfill history data up to 18 months, depending on the network.