
LinkedIn, the ‘treasure trove’ of networking, has come a long way as a professional podium & transformed into a wellspring for recruitment, sales, marketing & branding.
LinkedIn marketing has been a reliable platform, especially for B2B marketers, to display well tailored content blend & enhance social ROI.
43% of marketers attained customers via LinkedIn & the social platform has generated revenues for 38% B2B marketers. 80% of B2B leads come from LinkedIn & 79% of marketers believe that it is an efficient source of lead generation.
If you wish to use LinkedIn for business, tracking LinkedIn analytics should be an integral part of your marketing strategy.
Measuring LinkedIn analytics helps to quantify your LinkedIn marketing strategy, offers you data such as audience growth, engagement, or conversions, helping you to reach new milestones.
In this blog, we have discussed how to get LinkedIn analytics, the best metrics to track, & top LinkedIn analytics tools in 2021 to monitor & measure data. Let’s dive into LinkedIn analytics, fortify your LinkedIn marketing strategy with a data-driven approach & boost your social conversion rate.
- How To Get LinkedIn Analytics
- Types Of LinkedIn Analytics
- Top LinkedIn Analytics To Measure
- Updates Analytics
- Followers Analytics
- Visitors Analytics
- Employee Advocacy Analytics
- LinkedIn Profile Analytics
- Statusbrew LinkedIn Analytics Tools
How To Get LinkedIn Analytics
LinkedIn analytics can be measured natively, or you can use top social media analytics tools such as Statusbrew. Its newly launched report features are precise & massive, which is one of its kind in the SMM industry. However, if you want to track metrics via the LinkedIn analytics dashboard itself, check out the following steps:
Step 1: Log in to your LinkedIn profile & open your LinkedIn company page. You’ll find different analytics pages such as Visitors, Updates, Followers or Employee Advocacy, etc.
Note: LinkedIn page analytics are visible only to page admins only, or at least you require to have the ‘Analyst’ role to access the analytics dashboard. LinkedIn ‘Page Admins’ are Super admin, Content admin, Curator & Analyst. It also offers paid media admins roles which include: Sponsored Content Poster, Lead Gen Forms Manager & Pipeline Builder. You can monitor metrics on LinkedIn only when you have the right role-based access permissions.
Step 2: To export analytics choose the correct analytics page & click on export on the upper right corner of the chosen analytics page.

Step 3: Now, choose the timeframe you’d like to create a report for and click 'Export'. The report will be downloaded in the .xls file.

Types Of LinkedIn Analytics
Let’s roll out to different types of LinkedIn analytics & understand why they are vital to measure:
Followers Analytics
Followers analytics on LinkedIn offer you insights about your audience on the platform. These metrics highlight followers’ interaction with your content & assists you to understand if your content is reaching the right set of people. LinkedIn followers analytics offers you data on your follower’s job location, seniority, industry, location, size of the company they work in, their function, employee vs. non-employee, etc.
Measuring followers metrics is crucial as it helps to create content that can directly impact your audience & assist you to enhance traffic & boost engagement.

Updates Analytics
LinkedIn update analytics demonstrate the effectiveness of your company page updates. These metrics help you to understand your audience’s perception about the updates, whether they find your page updates engaging or not. Further, it also helps social media managers to track ongoing trends & patterns.
If your page update metrics are displaying that your post engagements are low, you can alter the time of posting or ponder upon the types of content published.
With Statusbrew Publish quickly get the best posting time & smartly schedule your content calendar for LinkedIn personal profiles. You also can bulk schedule posts analyzing the ongoing content trend on LinkedIn.

Visitors Analytics
LinkedIn visitors analytics give you insights into your page, not your content. The data offers by these metrics help you to track the users who are visiting your page & offer you the sources of visitors. Visitors analytics assist you with metrics such as page view, unique views & visitors demographic.
You can utilize the data to analyze patterns & accordingly weave your content strategy to suit visitors’ needs. Implement the strategy on LinkedIn to boost social engagement & convert your visitors into your loyal followers.
You can use Statusbrew reporting to determine which of your post is performing best & accordingly plan the content strategy of your company page to augment traffic.

Talent Brand Analytics
Talent brand analytics are available on LinkedIn career pages & super admins can access the analytics. These metrics are particularly useful if you are looking to get the attention of new talent for your organization.
The talent brand index is the number of LinkedIn users who are aware of your company & also express interest. With a high index percentage, you can easily attract the correct candidate for your company.
Stats says that 71% of LinkedIn users that follow a company are interested in receiving updates about new job openings. Talent brand analytics are crucial to making the right workforce investment with real-time data.
There are four types of metrics you can access in this section that helps you to gain insight on engagement on your career page, such as Talent Pipeline, Talent Flows, Talent Attraction & Applicants Behaviour.
Follow the steps to get Talent band analytics natively on LinkedIn.
- Access your page's 'Super Admin' view & click on 'Analytics'.
- Choose Talent Brand & adjust the timeframe with the dropdown menu in the upper left corner of the page.
- You can select the time span Last three months or six months, or the last 12 months.
Employee Advocacy Analytics
LinkedIn Help denotes that employee advocacy analytics assist page admins in tracking the trends in employee & member engagement by providing suggested content to employees on the “My Company tab.” Employee advocacy metrics are only available on the desktop.
The data offers an aggregated calculation from the past 30 days & the increase or decrease score for each metric indicates the engagement with your recommended content.
Employee advocacy analytics include metrics such as recommendations made for employees, reactions, comments & share of the posts generated from recommendations by employees. It further provides you breakdown insights on the number of LinkedIn members that engaged with your employees’ posts that were generated from recommendations based on the Companies, Location, Job function, Seniority, and Industry.

Suggested Read: How To Encourage Employee Advocacy On Social Media
LinkedIn Post Analytics
You can drill down analytics for each post on LinkedIn. Tracking metrics on posts can provide you insight on the effectiveness of your content within LinkedIn. To measure post metrics on desktop, consider the following steps:
Step 1: Open your LinkedIn Profile & click the ‘Me’ present on the top of the LinkedIn homepage.
Step 2: Go to 'Manage' & click on Posts & Activity.
Alternate steps:
Step 1: Choose the specific post or article your want to get insights.
Step 2: Click on the ‘Analytics’ icon below your post or article.
LinkedIn Profile Analytics
If you provide Professional services or if you are a brand ambassador of a company & run a profile rather than a company page, you can also access the profile analytics. You can found all your required data under ‘Your Dashboard.’ Here you can find metrics such as Profile Viewers, Post Viewers & Search Appearance.
Top LinkedIn Analytics To Measure
So are you wondering which metrics you should measure? Well, among the vast data offered by LinkedIn, you should track analytics aligning with your brand goal. To make it easier for you, we have breakdown & simplified the data. Dive in the pool of the top LinkedIn data you should measure to scale your brand growth:
Updates Analytics
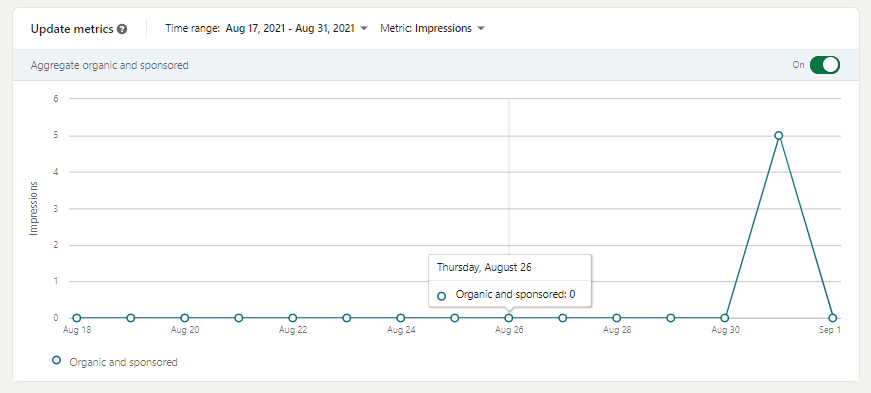
Updates metrics display all the key metrics for your organic and sponsored updates on your company page over time. These metrics can be filtered by time ranges & LinkedIn allows you to view it in aggregate or non-aggregate form. Notable that apart from the reactions & comments, it requires 48 hours to reflect these for metrics. In the analytic update section on LinkedIn, you can track Impressions, Unique impressions, Clicks, Reactions, Comments, Shares & Engagement rate.
Impressions
Impressions assist you to gain insight on the gross number of times your LinkedIn update is visible on LinkedIn for a minimum of 300 milliseconds. The metrics further measure the number of times a post is a minimum of 50% in view on a desktop window or mobile screen of the signed-in users on the platform.
Unique Impressions
Unique Impressions track the number of times a post is made visible to an individual signed-in user. Unique impressions only count the unique views; unlike impressions, they do not count the numbers if a user sees your company page multiple times.
Clicks
The metrics count the number of clicks you have received on company name, content, or logo by a signed-in LinkedIn user. It helps you to get data about the CTAs that worked & engaged users on your page rather than simply scrolling through it. Click, however, does not count reactions, shares, or likes.
CTR Or Click-through Rate
CTR or click-through rate is the percentage that provides your data by dividing the number of post clicks by the number of impressions on the same posts. CTR gives you a clear picture & a better understanding of post engagement.
Reactions, Comments & Shares
Reaction, comments & shares are engagement metrics that track the number of times your page post received a reaction, comment or the total number of times LinkedIn members share your content. The metrics also include the sponsored content & the video posts shared by users.
Users choose different emojis to display like, celebrate, support & love. Further, they can also express their curiosity through an emoji, or if they feel the content of the post is insightful, they can drop an emoji for this.
Share metrics track the number of times members choose to share content with their own followers. Shares help to expand the reach of your content. Comments track the gross number of comments you have received on a particular post.
Engagement Rate
Engagement rate gauges the gross number of interactions, total number of clicks, and followers acquired, divided by the number of post impressions.
The engagement section breakdowns the interactions your posts have received. There, you can measure how many clicks, likes, comments, and shares your posts won.
Note: LinkedIn update highlights display the change percentage in the last 30 days. It measures the number of total likes, comments, and shares in the previous 30 days. Besides, under the update engagement metric, you can track your video views. Furthermore, the video performance tab in the 'Video analytics' window allows page admins to weekly access to video analytics.
The audience tab is viewable under ‘Video analytics’ that provides insights into your viewer’s profession & geographical location. The engagement section also helps you to monitor your engagement percentage and the number of followers you acquired from a sponsored update.

Suggested Read: Video Marketing: Everything You Need To Know
Importance Of Tracking Update Metrics
- Measuring update analytics empowers you with insights on the effectiveness of the updates. The correlation between your company updates and engagement data offers insights on the kind of updates that are working and which require improvisation.
Check out the tips to publish updates matching the LinkedIn algorithm:
-
Avoid simply dropping links. Instead, post updates that motivate interaction between you & your followers. To encourage interactions, post on ongoing trends, or industry advice, or question answers polls are beneficial.
-
Though LinkedIn does not particularly support a specific content format, yet posts with images & videos have more engagement.
-
Keep your caption short & crisps but make sure to add a personal touch to captions to boost engagement. Sometimes posting content that sparks a positive reaction is always advisable.
-
Maintaining consistency is vital to expand content reach on LinkedIn.
Followers Analytics
Follower metrics provide data on the total number of followers, audience demographics & pattern of your followers’ growth over a period. You can get the metrics in both aggregated & non aggregated form.
All Followers
This follower metric shows the gross number of followers your organization’s page currently has. It also shows your follower’s current place of employment when they followed your page. The data is shown in the order of recency.

Follower Highlights
These metrics provide data on the number of members that have been followed your business page since the time of its creation. You can track the pattern of change in followers with these metrics. The total number of followers is updated once in the entire day & it also shows the number of followers your page has gained. The change percentage for the time frame of the previous 30 days is also shown.

Companies To Track
These metrics offer you insights on the number of updates, data on your follower gains and losses, and engagement rates compared to your contemporary organizations. The data can be filtered based on the time range.
Follower Demographics
The follower demographic metrics breakdowns the follower’s information of the page based on Seniority, Industry, Location, Job function, and Company size data. It is a crucial metric to sense your loyal followers base along with their profession & seniority level. Let roll down to the following metrics to understand followers demographics better:
Seniority: The seniority demographic is a crucial metric that helps you to know if you are targeting the right audience based on your brand marketing goal. You can try to reach entry-level, mid -or senior-level employees, but your marketing strategy & goal should be aligned with reach out to the appropriate audience group.
Company Size: What is your goal behind adopting a LinkedIn marketing strategy? What type of company do you want to reach? This LinkedIn analytics breakdowns audience data based on the number of employees the company has & helps you to get the idea if the company is an enterprise of an SMB.

Industry: If your objective is to target a particular industry, you should track this LinkedIn analytics. It offers you insights on if your content is appealing to the target audience & gives you an idea to target a new industry audience.
Job Function: Job function metrics provide you with data on the job roles of your followers. Tracking this set of data can help you to prepare a content strategy that can help you to prepare content that resonates with your followers.
Followers analytics further offers you data on how the number of your followers has fluctuated over time. Besides, it also provides you information on employees & non-employees.

Importance Of Tracking Followers Metrics
-
Followers metrics are crucial LinkedIn analytics that helps you to understand the performance of your content page & the effectiveness of content. If you notice a negative trend on followers count, make sure to drill down your data to understand the reason.
-
Losing followers may be caused due to diverse reasons; your scheduling requires attention, or content quality need improvement. Further also check out the trend, sudden drop or flatlines, or spikes.
-
Audience LinkedIn analytics also give you insights if your content is attracting the right audience & if your followers count consists of your brand target audience.
-
However, if you are low on followers growth, consider to run LinkedIn ads. To run an ad, you can use your best engaging post. LinkedIn ads help to attract the correct leads. You can classify the target audience based on roles & skills as well.
Suggested Read: The Ultimate Guide To LinkedIn Ads
Visitors Analytics
LinkedIn visitor metrics assist you in gaining an in-depth understanding of your organization’s page performance. These metrics deliver you data about LinkedIn users who have visited your page who aren’t your followers.
LinkedIn visitors metrics include visitor traffic and demographic trends across diverse time periods. You can get data on traffic to your page which can be filtered by time range, page section & the number of time you page is viewed in aggregated or non aggregated form. Let’s check out the visitors metrics in detail:
Pageviews
Pageviews are the gross number of times your organization’s page is viewed during a particular date range. If you have set up a career page, you can also get data for that page. The total number of times your page was visited.

Unique Visitors
Unique visitors show data about how many LinkedIn members have viewed or visited your company page. Unique visitors data does bot includes multiple visits from a single member. Suppose a LinkedIn user visited your company page navigates aways & later again returns. In that case, it is calculated as two-page vows & one unique view as the user is the same individual. Unique visitors are a good parameter that denotes the number of LinkedIn users interested in your page.

Custom Button Clicks
On LinkedIn, you can use custom buttons such as ‘Learn More, ‘Visit Website’, ‘Contact Us’, ‘Register’ &’ Sign Up’ to direct the user to take action. Custom bottom clicks metrics offer you insights into the total number of clicks the buttons have received ins a set date range. It is a good way to analyze how effective your CTAs are to lead to conversion.
Visitor Demographics
Visitor demographics metrics offer information about who’s viewing your page, just like follower demographics. Track this data to understand if there is any discrepancy between the demographics of viewers of your page & your followers.
A contrast denotes that there is lack of connection between content sharing & information on your page. Visitors demographics data includes a breakdown of visitors based on Location, Seniority, Job function, Industry, and Company size filtered by time range.

Note: Visitors analytics on LinkedIn analytics dashboard assist you with information about Life page traffic, displaying gross number of visits and unique visitors. You can filter life page data by filtered by time ranges, Unpublished Pages, Published Pages, or All Pages based on your requirements.
Importance Of Tracking Visitors Metrics
-
To increase the number of visitors to your LinkedIn profile, ensure to fill your page with company details completely. It helps you be visible in organic search via LinkedIn native company search feature or Google search.
-
Furthermore, ensure to be active on the platform as it helps to boost your visitors' scores. Also, motivate your employees & teammates, to be more active on the media & to be more engaging.
-
You can opt for cross-promotion of your page across another social network like Facebook or Twitter to enhance visitors.
Employee Advocacy Analytics
Employee advocacy is a significant way to grow your brand’s online presence. If you have launched an employee advocacy campaign at your company, the LinkedIn analytics dashboard can track employee advocacy metrics.
It calculates change percentage in the number of recommendations, reactions to posts, posts from recommendations, comments on posts, and reshares of posts over a particular timeframe. Let’s check out in detail what LinkedIn employee advocacy analytics has to offer:
Recommendations
These metrics provide data about the number of recommendations made for employees. It calculates the data from the past 30 days; you can get insights on the percentage of increase & decrease in recommendations.
Employees Posting From Recommendation
These metrics share insights about the number of posts employees share over a particular date range depending on Seniority, Job function, and Location.

Reactions,Comments & Reshares
It provides you data about the number of posts generated from recommendations by your employees. Comments On Post: By tracking comments on posts, you can get data about the number of comments made by LinkedIn users on employee posts that are generated from recommendations. Measuring reshares of posts: to get the numbers of reshares on employees developed posts from recommendations.
LinkedIn Members Reached
You can gain insights into the number of LinkedIn members who interacted with your employees’ posts. The metrics breakdown data based on cation, Job function, Companies, Lo, Seniority, and Industry.
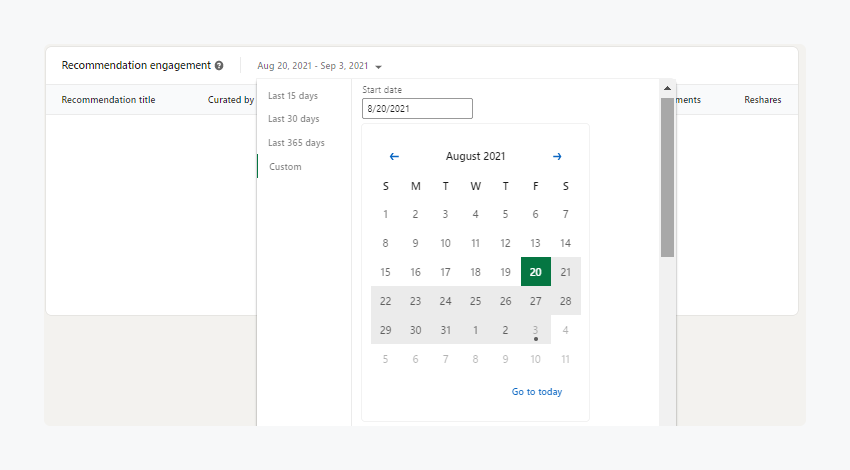
Recommendation Engagement
Recommendation engagement analytics tracks data based on the recommendations made by employees for a specific time range. You can track recommendations title, curated by, posts, impression, date creation, reaction, comments, etc.
Importance Of Tracking Employee Advocacy Analytics
-
Use employee advocacy analytics to measure the quality of content recommended to your employee’s advocates.
-
Also, it offers you an idea about the content that your employees find helpful to build their personal brands. Along with it tracking these data, you also get an insight into the content employees resonates with most.
LinkedIn Profile Analytics
LinkedIn allows users to track analytics even if they don’t have a business profile. Thought leaders or business influences or individual users can track metrics to get insights on content performance via metrics such as search appearance & post views.
Search Appearances
It is the profile metrics that assist users in getting data about the gross number of times your profile appeared in search results in a specific date range. If you have a LinkedIn premium account, you can drill down more precise data that comprises the details of the users who view your profile, the company they work at & the list of keywords the users used to find your profiles.

Post Views
These Linkedin profile metrics give you an overview of the number of non-unique views on your posts or articles. Furthermore, by clicking on the metric, you can get a detailed post-by-post breakdown & insights on reaction, comment, and share.
Strategize Your Marketing Efforts On LinkedIn With Statusbrew
Get on-point insights for your LinkedIn profiles and pages about metrics that matter.

Statusbrew’s new reporting tool is massive with 130+ metrics & customizable widgets. It offers draggable & exportable reports on crucial parameters such as engagement activity, impressions, growth, audience demographics, post-performance & many more.

With Statusbrew’s permission-based access, securely collaborate with your teammates for your LinkedIn marketing tasks & build efficient & secure team workflows.
Sync all your comments from LinkedIn profiles & pages in one unified inbox with Statusbrew Engage & streamline the conversation management process to enrich the engagement rate.
Book your demo today to explore Statusbrew’s all-round social media management suite.
Statusbrew is a unified Social Media Management tool that supports Facebook, Instagram, Twitter, YouTube, Linkedin, and even Google My Business!


Explore the Statusbrew range of social media tools
Cancel anytime!