LinkedIn Report
The LinkedIn report gives you an aggregated analytics of all the LinkedIn Company pages in a Statusbrew Organization over the chosen date range.
Admin, Primary Owner, Owner, and users with View Reporting permission for a particular profile/profile group can access reports. To access LinkedIn Report,
Click on the Home button in the top left of your screen to open Statusbrew Home and click on Reports
Under the Reports section, click on LinkedIn

You can filter the report for a particular LinkedIn Profile / Profile Group. Learn More
Compare the change in performance by using the Compare to feature in the date selector.
The Change and % Change parameter for each metric gives you a better idea about the current traction around your brand.
Here are the widgets available in LinkedIn Report:
Activity
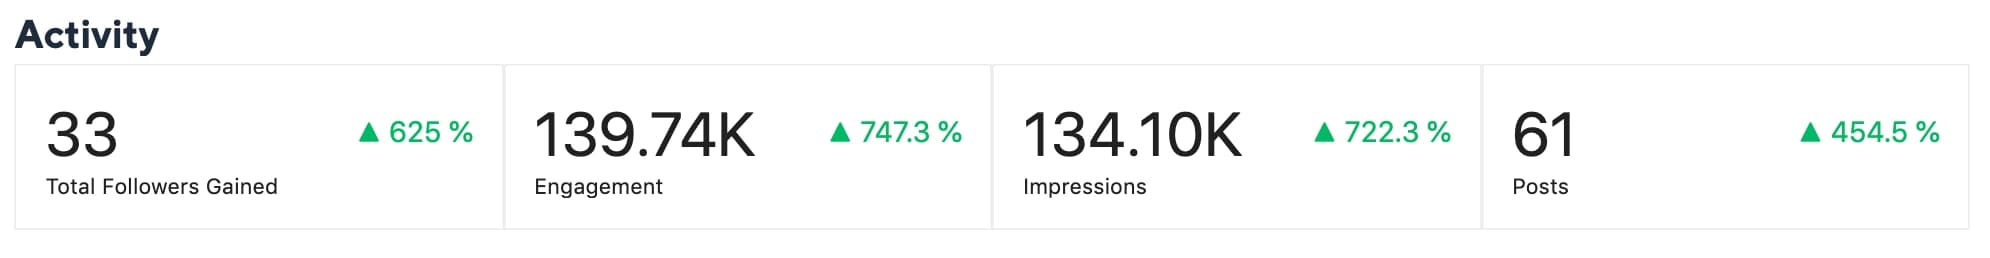
This widget summarizes your key statistics across all LinkedIn company pages in the current organization.
Total Followers Gained: The total number of followers gained in the reporting period across LinkedIn pages.
Engagements: The total number of engagements for LinkedIn pages. See the Engagements section below for more details.
Impressions: The number of times your content was served to users on LinkedIn.
Posts: The total number of company posts your pages sent on LinkedIn.
Engagements
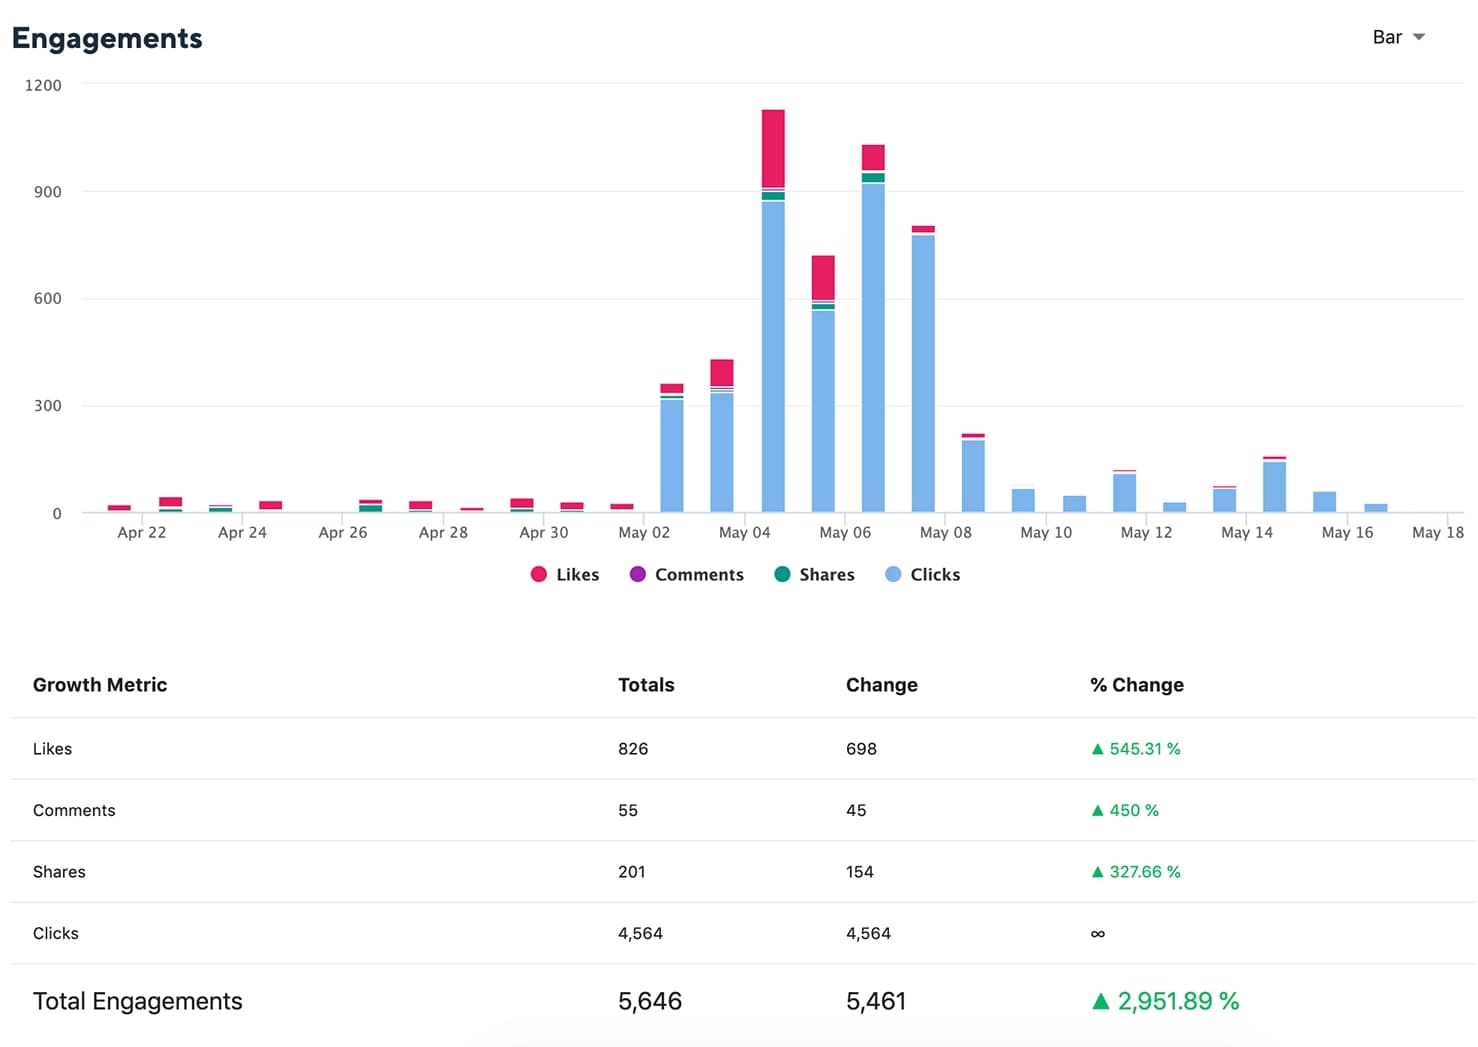

This widget helps you visualize trends in how your audience engages with your content across LinkedIn Company pages, along with change as compared to the corresponding previous period and % change.
Engagement is an aggregate number of Likes, Comments, Shares, and Clicks on your company posts.
Impressions
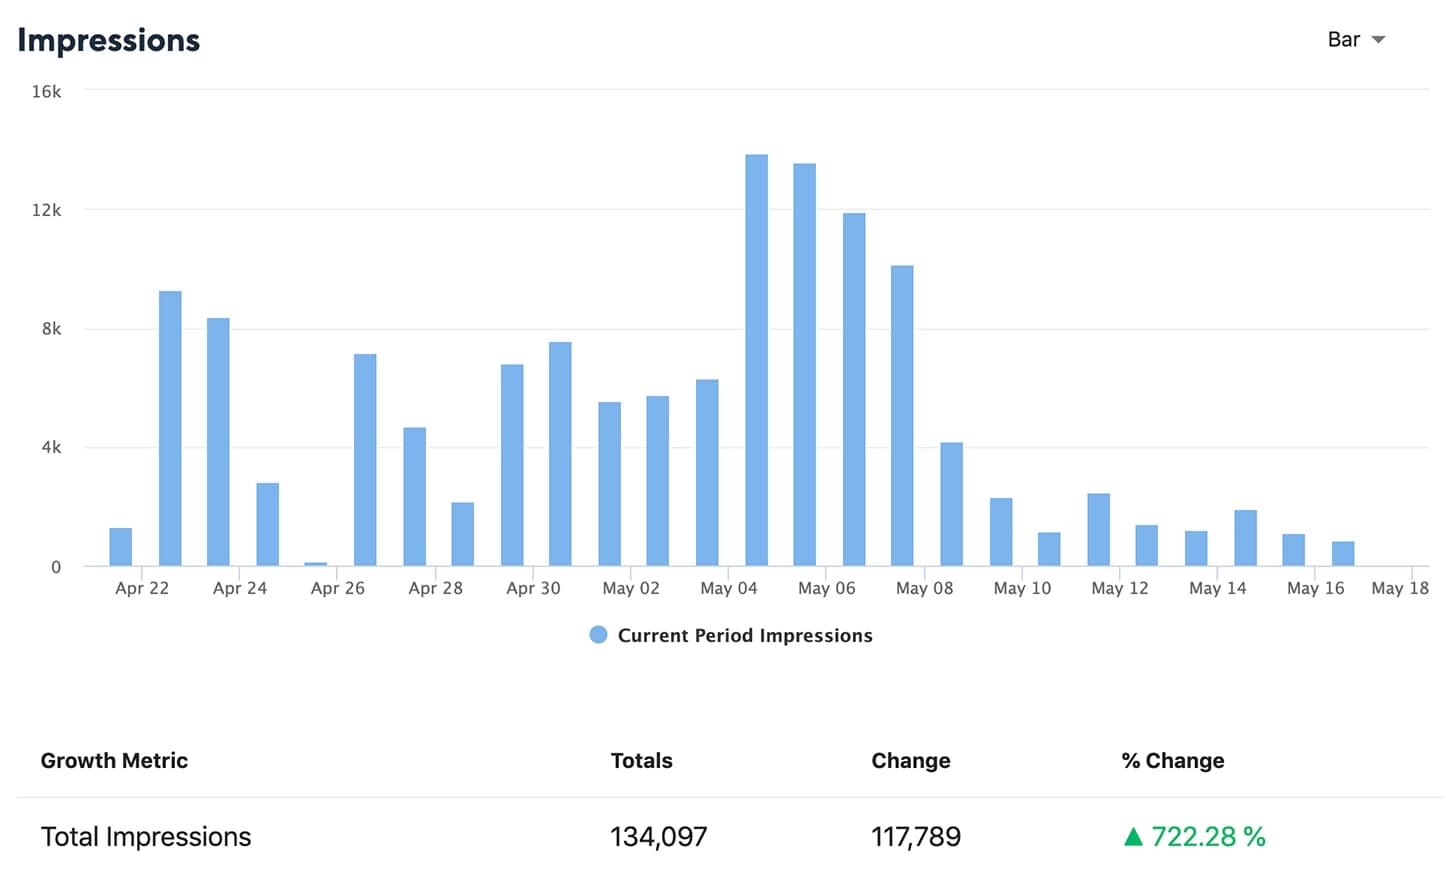
This widget helps you visualize trends in your content viewed by your audience across LinkedIn, along with change as compared to the corresponding previous period and % change.
Impressions are the number of times your Company Page or any Company Page posts were seen by LinkedIn members. This includes impressions achieved both organically and through sponsored (paid) campaigns.
Audience Growth
This widget breaks down your followers' growth across LinkedIn, along with change as compared to the corresponding previous period and % change.
New Followers: The total number of new followers gained across all days in the reporting period.
New Unfollowers: The total number of existing followers lost during the reporting period.
Total Audience Growth: Total number of followers gained or lost as compared to the previous period.
Posts
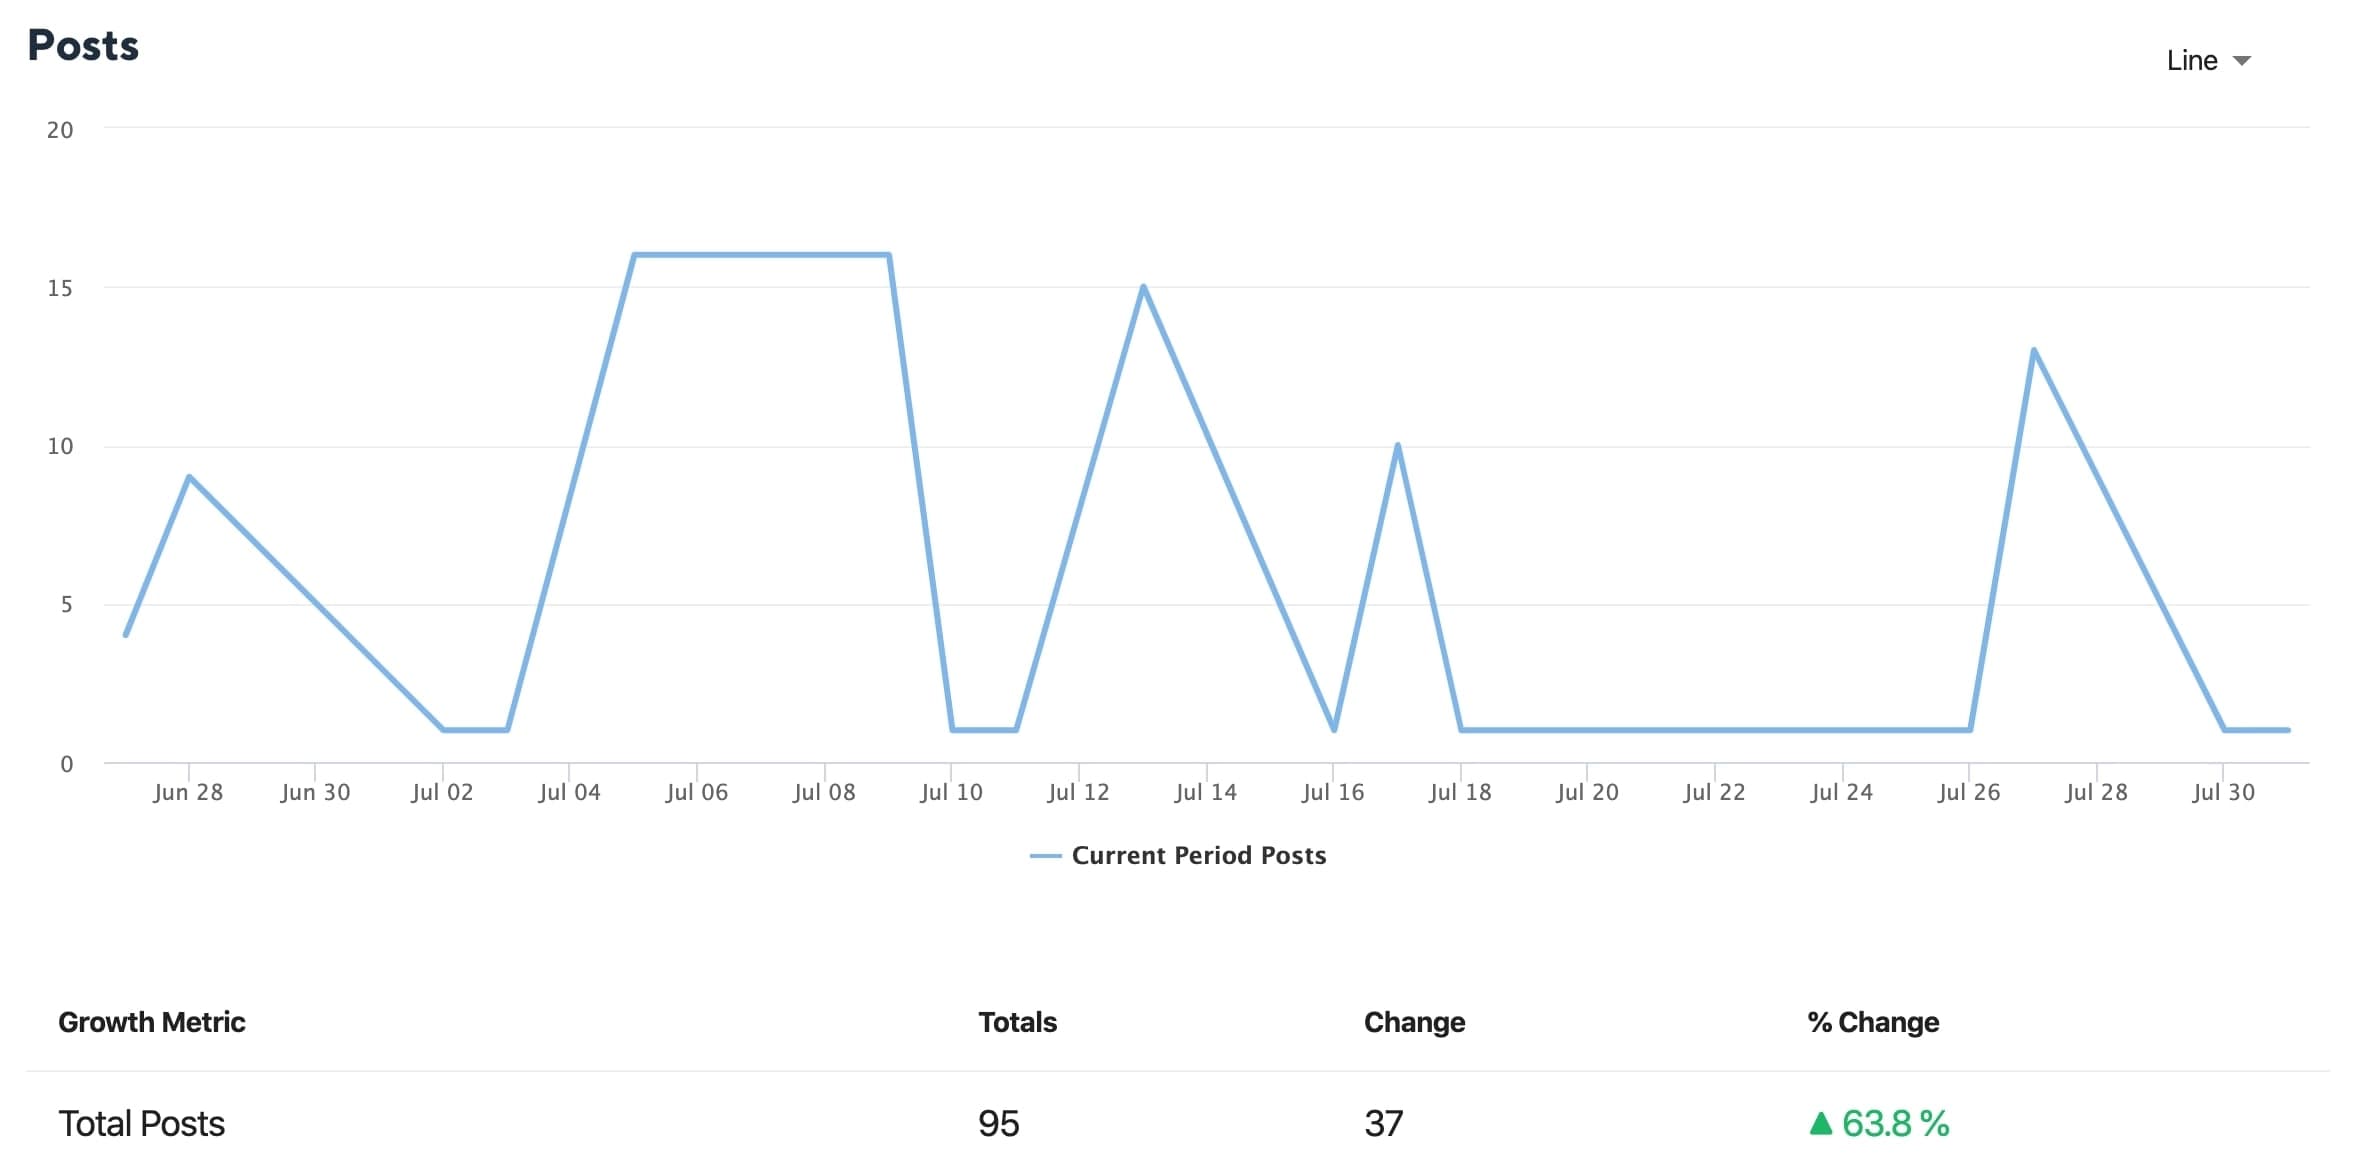
This widget breaks out the published posts across LinkedIn pages during the reporting period, along with change as compared to the corresponding previous period and % change.
Demographics
This section helps you know if your posts are targeting the desired audience.
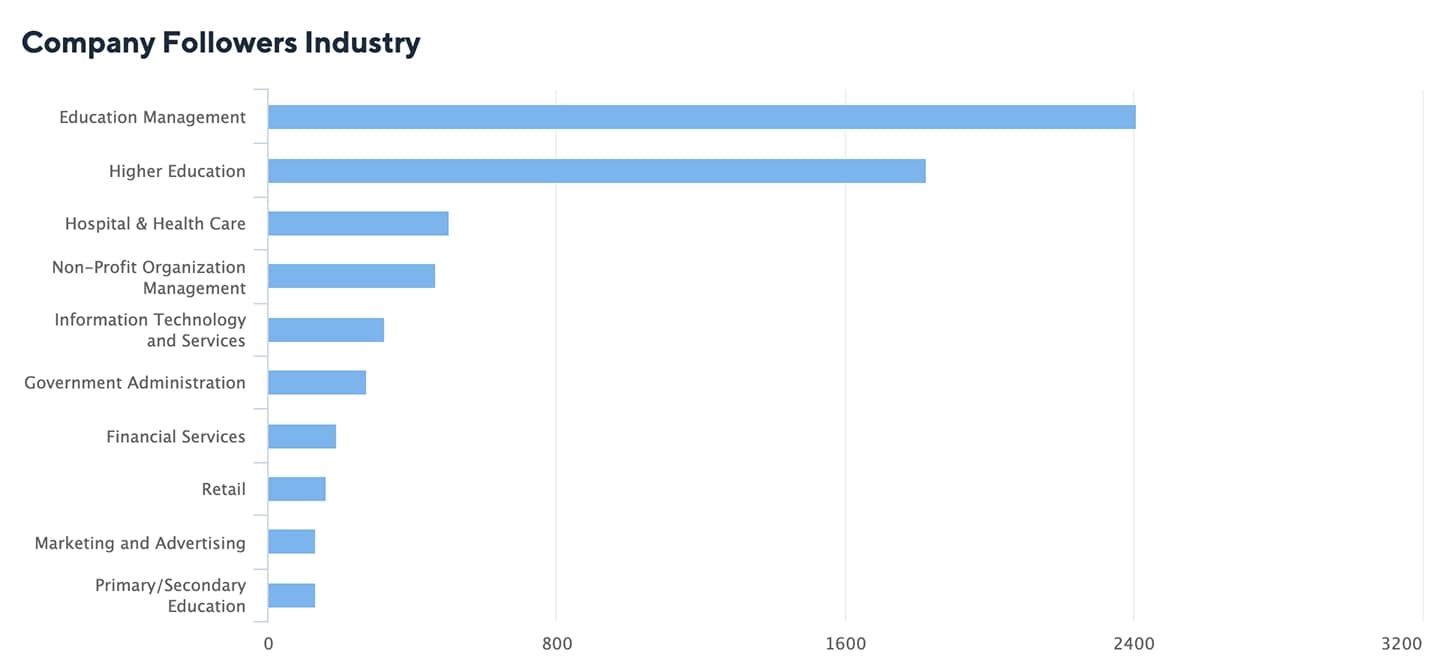
Company Followers Industry gives the top industry types the people who follow your LinkedIn page are from, along with the count from each industry on hovering the mouse pointer.
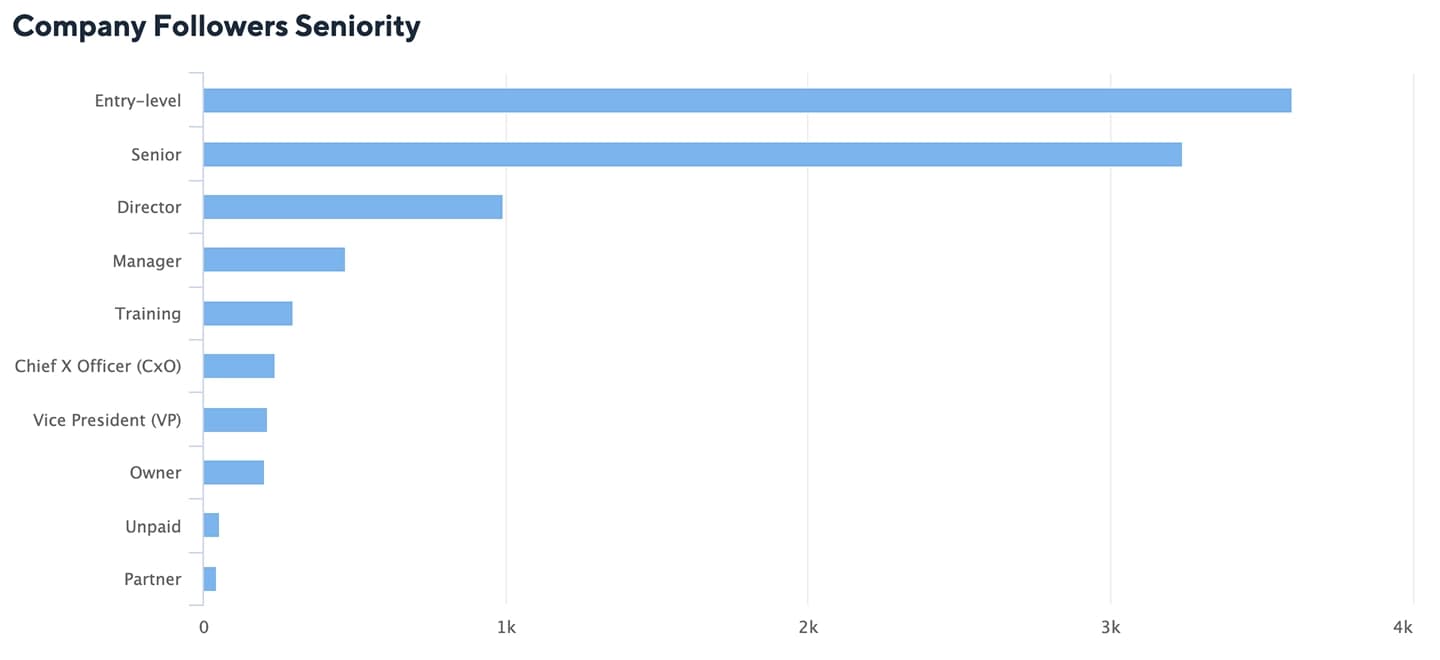
Company Followers Seniority gives the top seniority level of the people who follow your LinkedIn page, along with the count from each seniority level on hovering the mouse pointer.
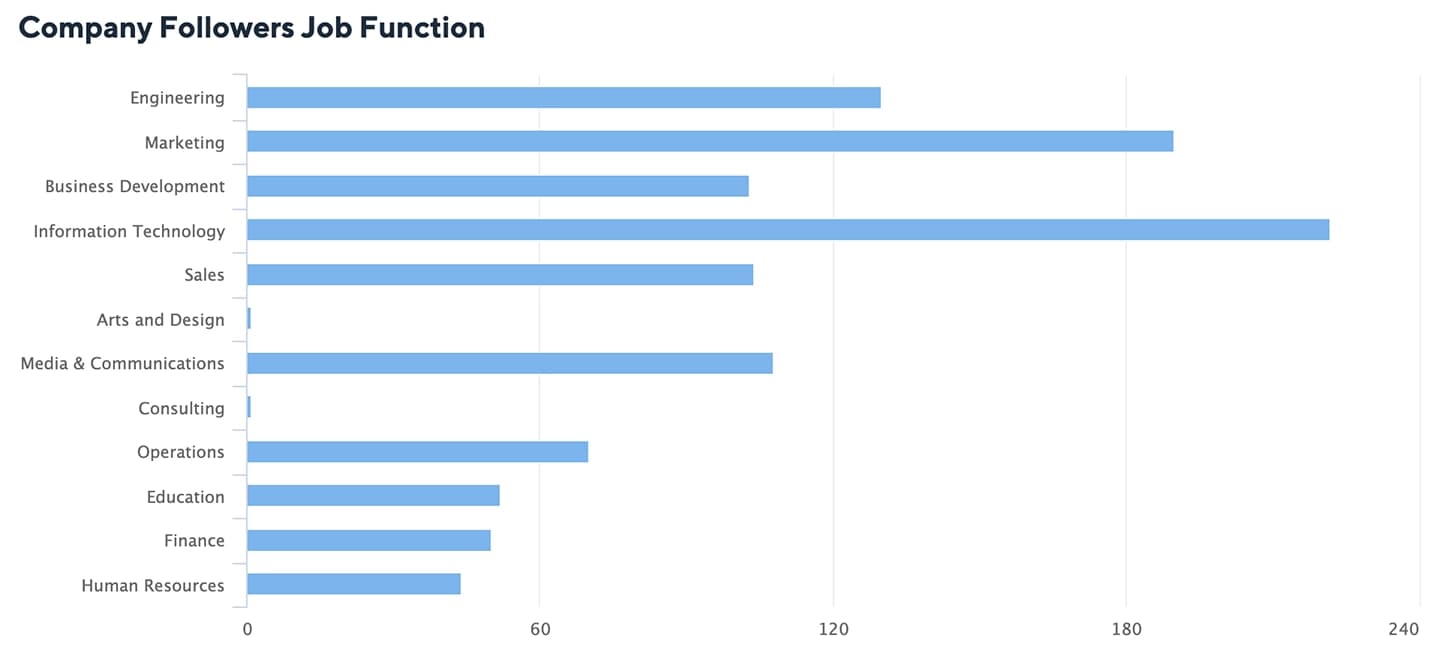
Company Followers Job Function gives the top departments of the people who follow your LinkedIn page, along with the count from each department on hovering the mouse pointer.
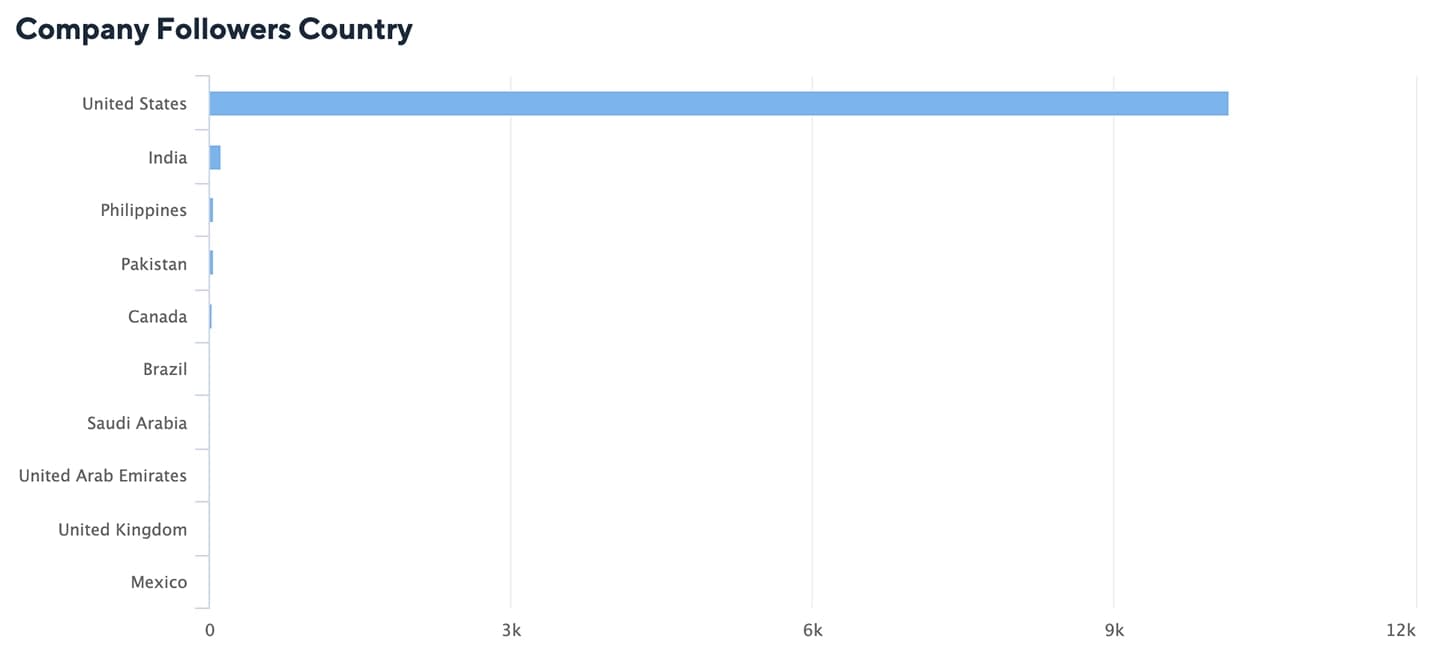
Company Followers Country gives the top countries of the people who follow your LinkedIn page are from, along with the count from each country on hovering the mouse pointer.
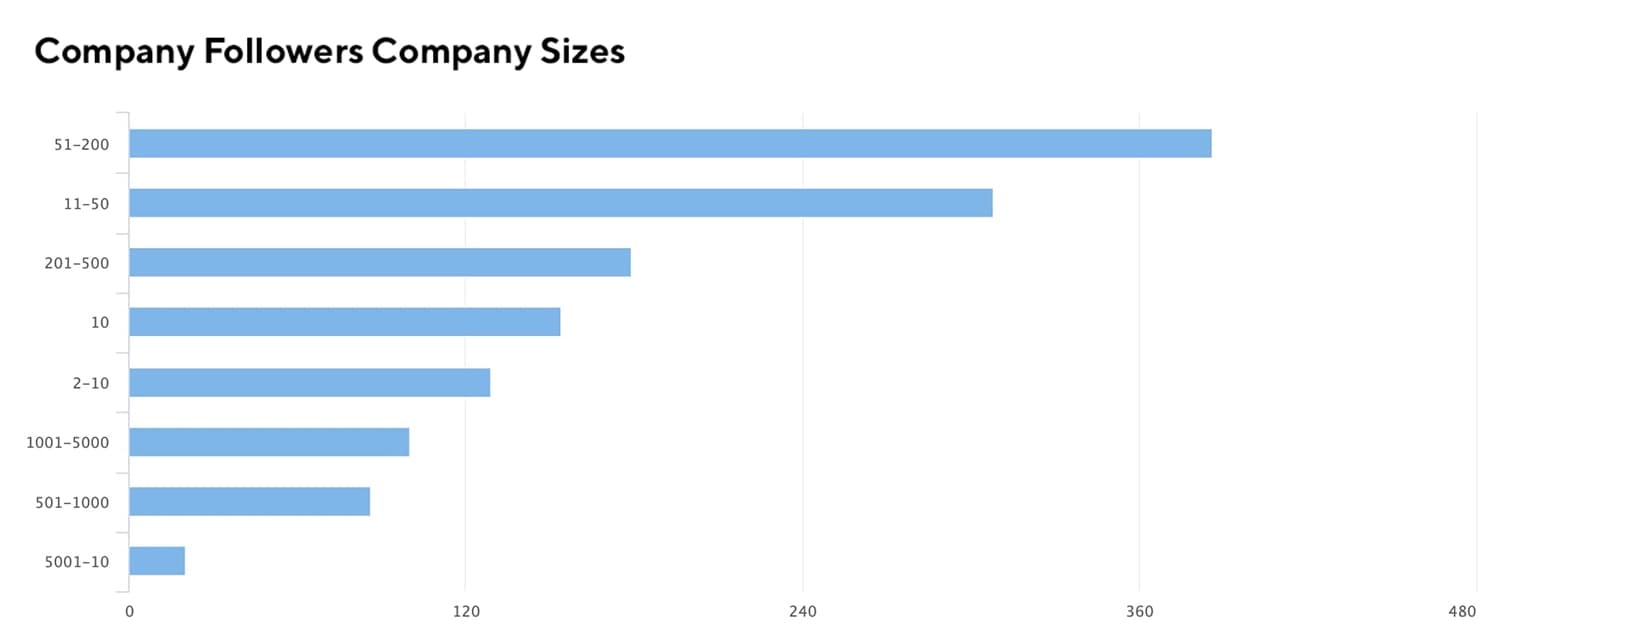
Company Followers Company Sizes gives the size range of companies of the people who follow your LinkedIn page work at, along with the count from each on hovering the mouse pointer.
Top Engaged Posts
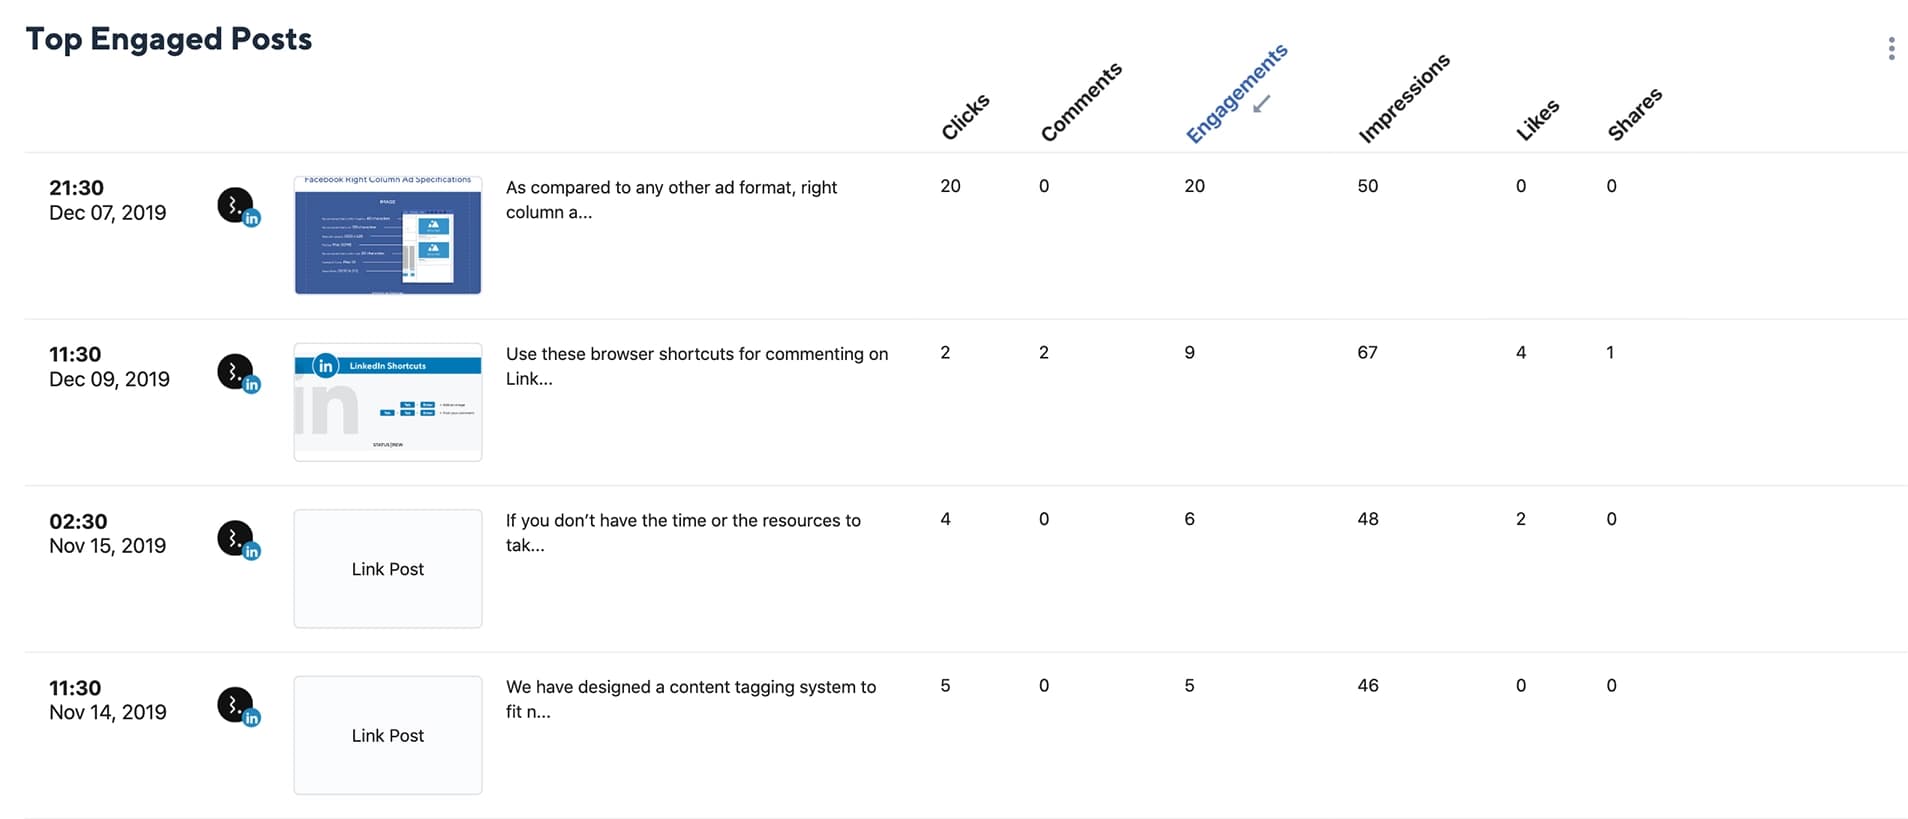
This widget provides you with LinkedIn posts with maximum engagement published during the selected date range along with their likes, shares, comments, clicks, and impressions. Click on any metric to rearrange your list in an ascending or descending order respectively. Tap on any post to get detailed metrics along with the name of the user who created the post.
This can be exportable in the form of a CSV (excel) file from the three-dot menu on the right.
Sentiment Analysis

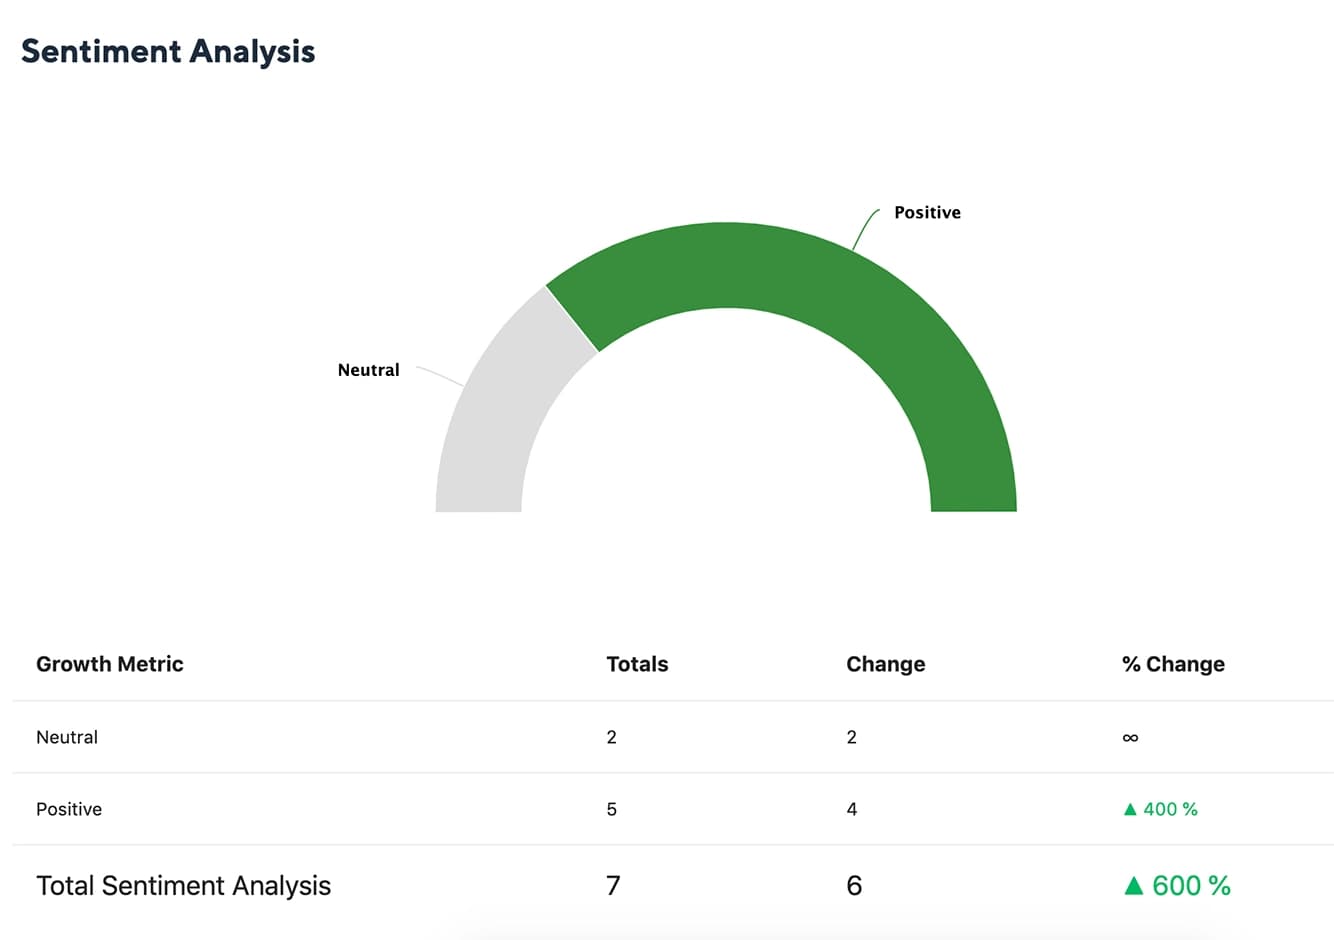
Track the sentiment on incoming comments grouped by positive, neutral or negative emotions and analyze your customer's opinion towards your marketing campaigns on LinkedIn.
All the graphs can be customized as per choice to Bar, Line, Area, or Tabular form. LinkedIn Report can be exported in the form of a PDF.