Facebook Report
The Facebook report provides you with an aggregated analytics of all the Facebook pages in a Statusbrew Organization over the chosen date range.
Admin, Primary Owner, Owner, and users with View Reporting permission for a particular profile/profile group can access reports. You can access the Facebook report using the following steps:
Click on the Home button in the top left of your screen to open Statusbrew Home and click on Reports
Under the Reports section, click on Facebook

You can filter the report for a particular Facebook Profile / Profile Group. Learn More
You can also compare the change in performance by using the Compare to feature in the date selector.
The Change and % Change parameter for each metric gives you a better idea about the current traction around your brand.
Here are the widgets available in the Facebook Report:
Activity
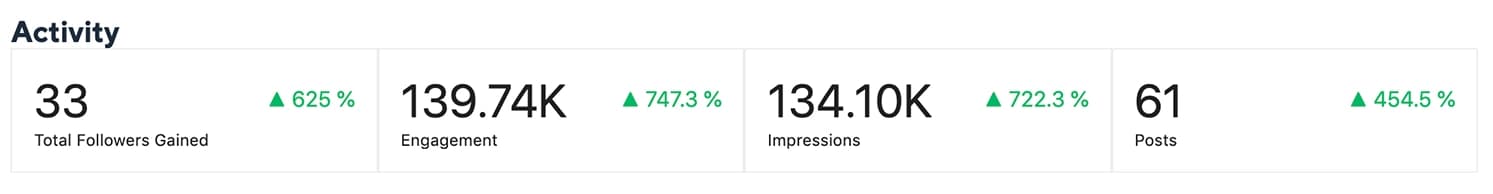
This widget summarizes your key statistics across all Facebook pages in the current organization.
Total Followers Gained: The total number of fans gained in the reporting period across Facebook pages.
Engagements: The total number of engagements for Facebook pages. See the 'Engagements' section below for more details.
Impressions: The number of times your content was served to users on Facebook.
Posts: The total number of public posts your pages sent on Facebook.
Engagements

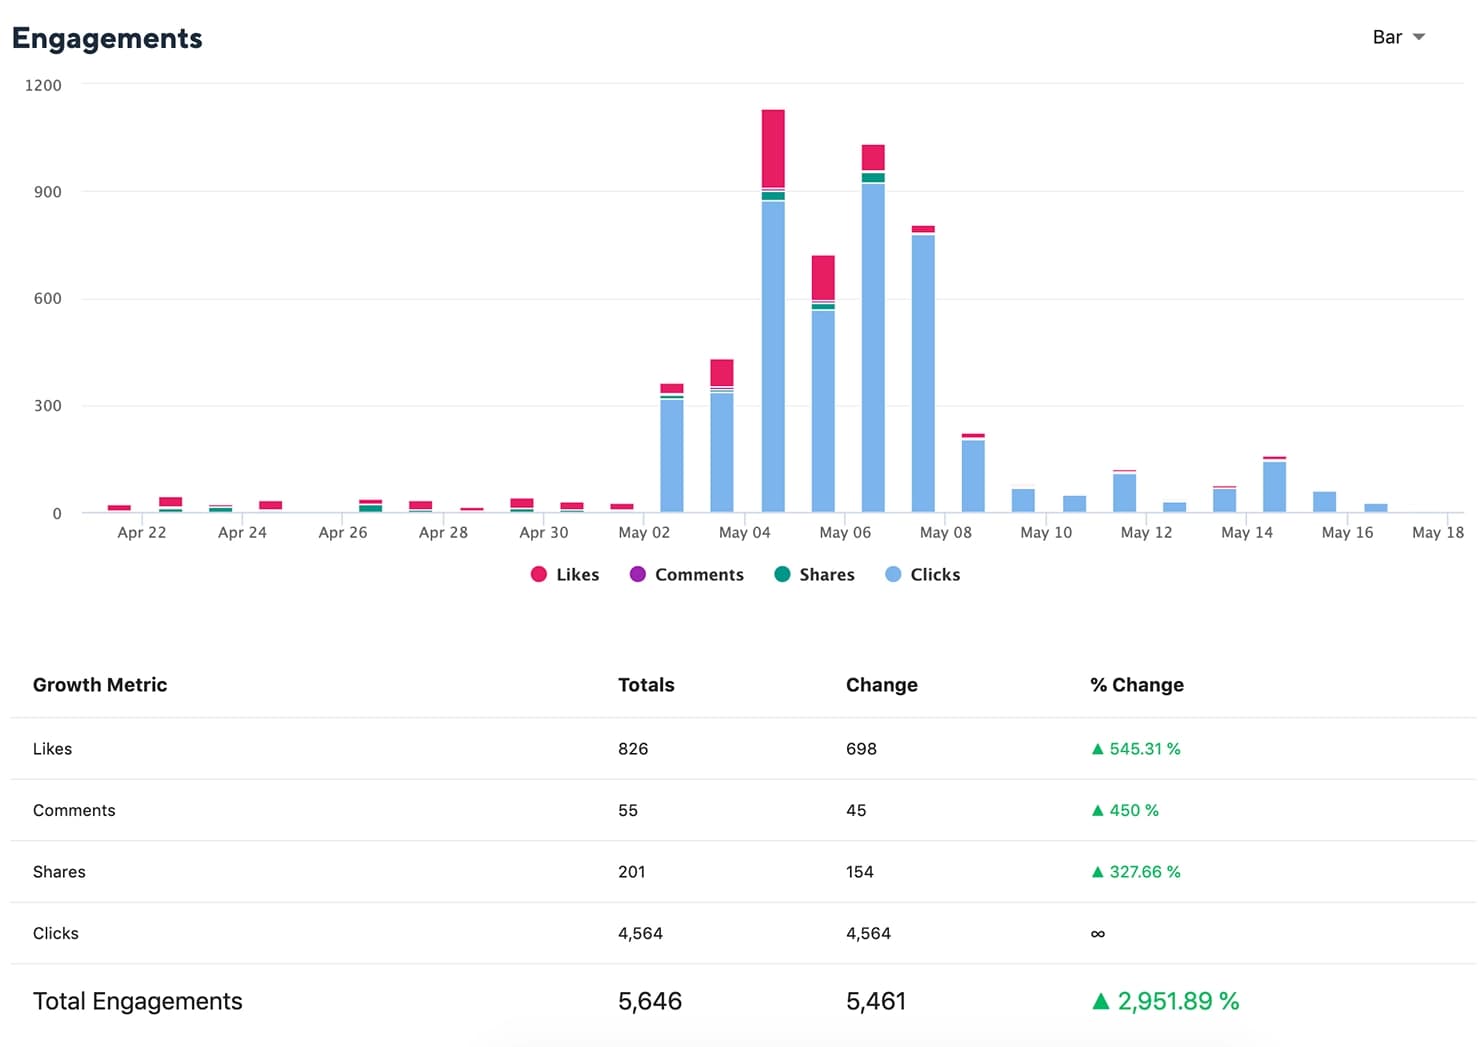
This widget helps you visualize trends in how your audience engages with your content across Facebook pages, along with change as compared to the corresponding previous period and % change.
Engagement is an aggregate number of reactions, comments, shares, and clicks on your Facebook posts during the reporting period.
Impressions
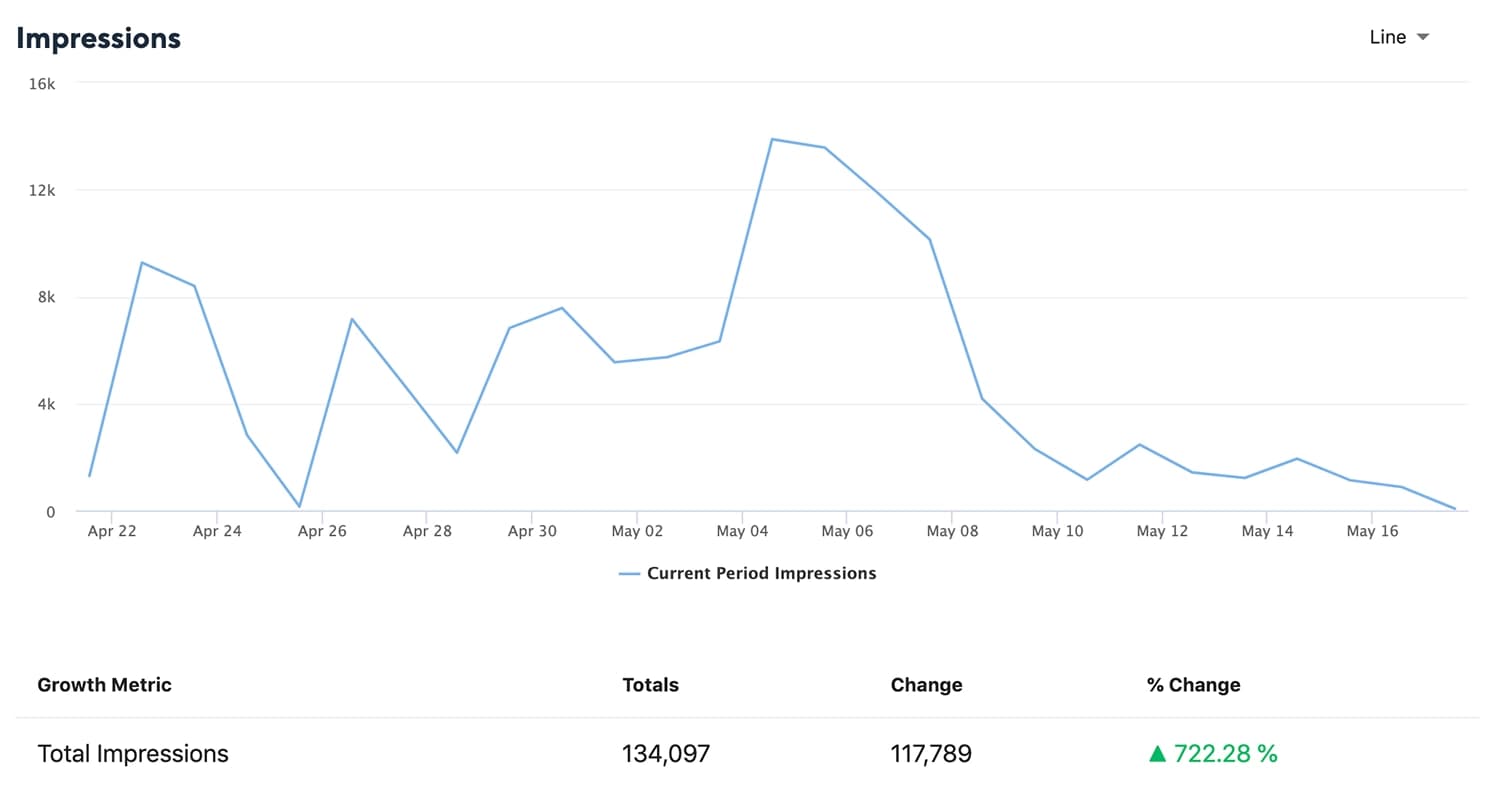
This widget helps you visualize trends in your content viewed by your audience across Facebook, along with change as compared to the corresponding previous period and % change.
Impressions are the number of times any content associated with your Page was seen in News Feed, or on visits to your Facebook Pages. These account for both the people who have liked your Pages and those who haven't.
Reach
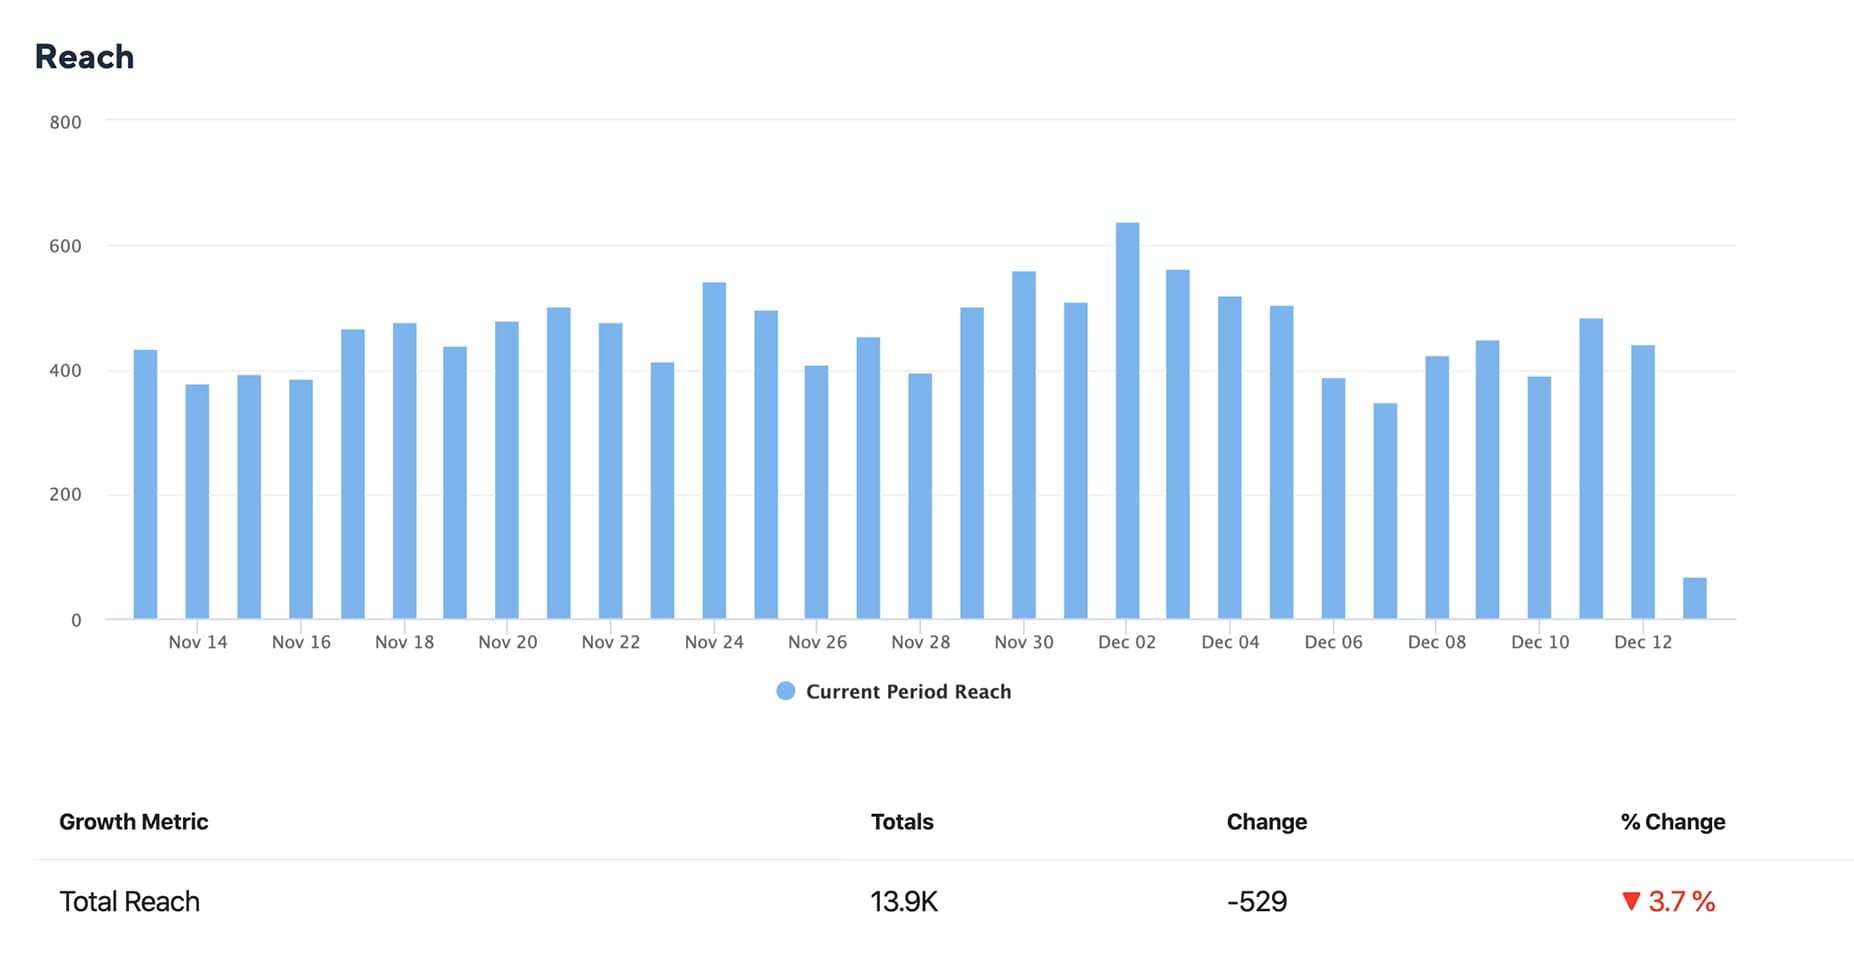
The reach section gives a count of the total number of unique people who saw your content along with change as compared to the corresponding previous period and % change.
Audience Growth
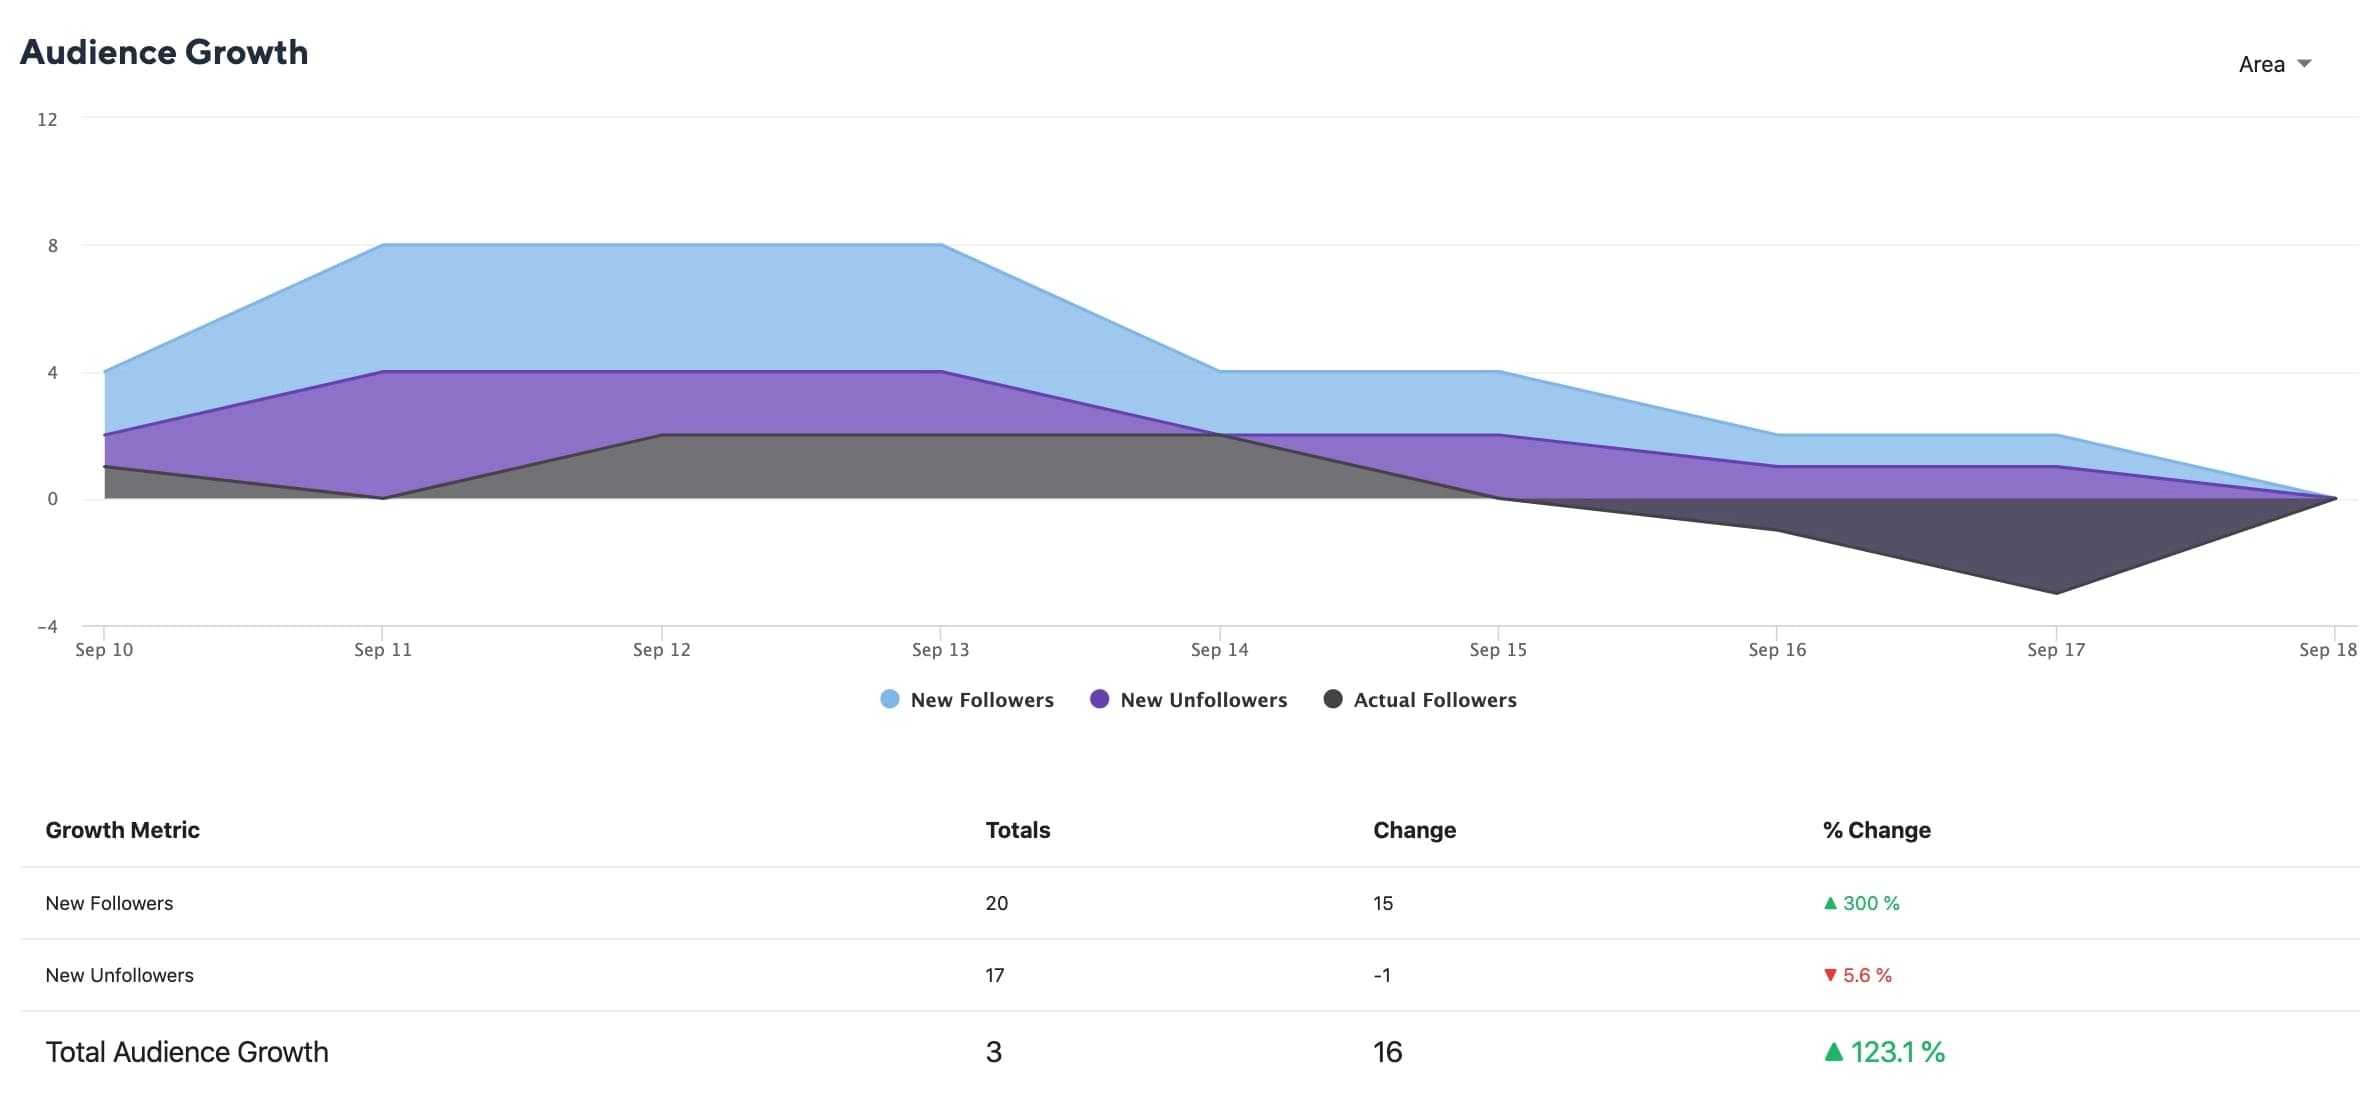
This widget breaks down your fan growth across Facebook, along with change as compared to the corresponding previous period and % change.
New Followers: Total number of new followers gained during the reporting period.
New Unfollowers: Total number of followers lost during the reporting period.
Total Audience Growth: Total number of followers gained or lost as compared to the previous period.
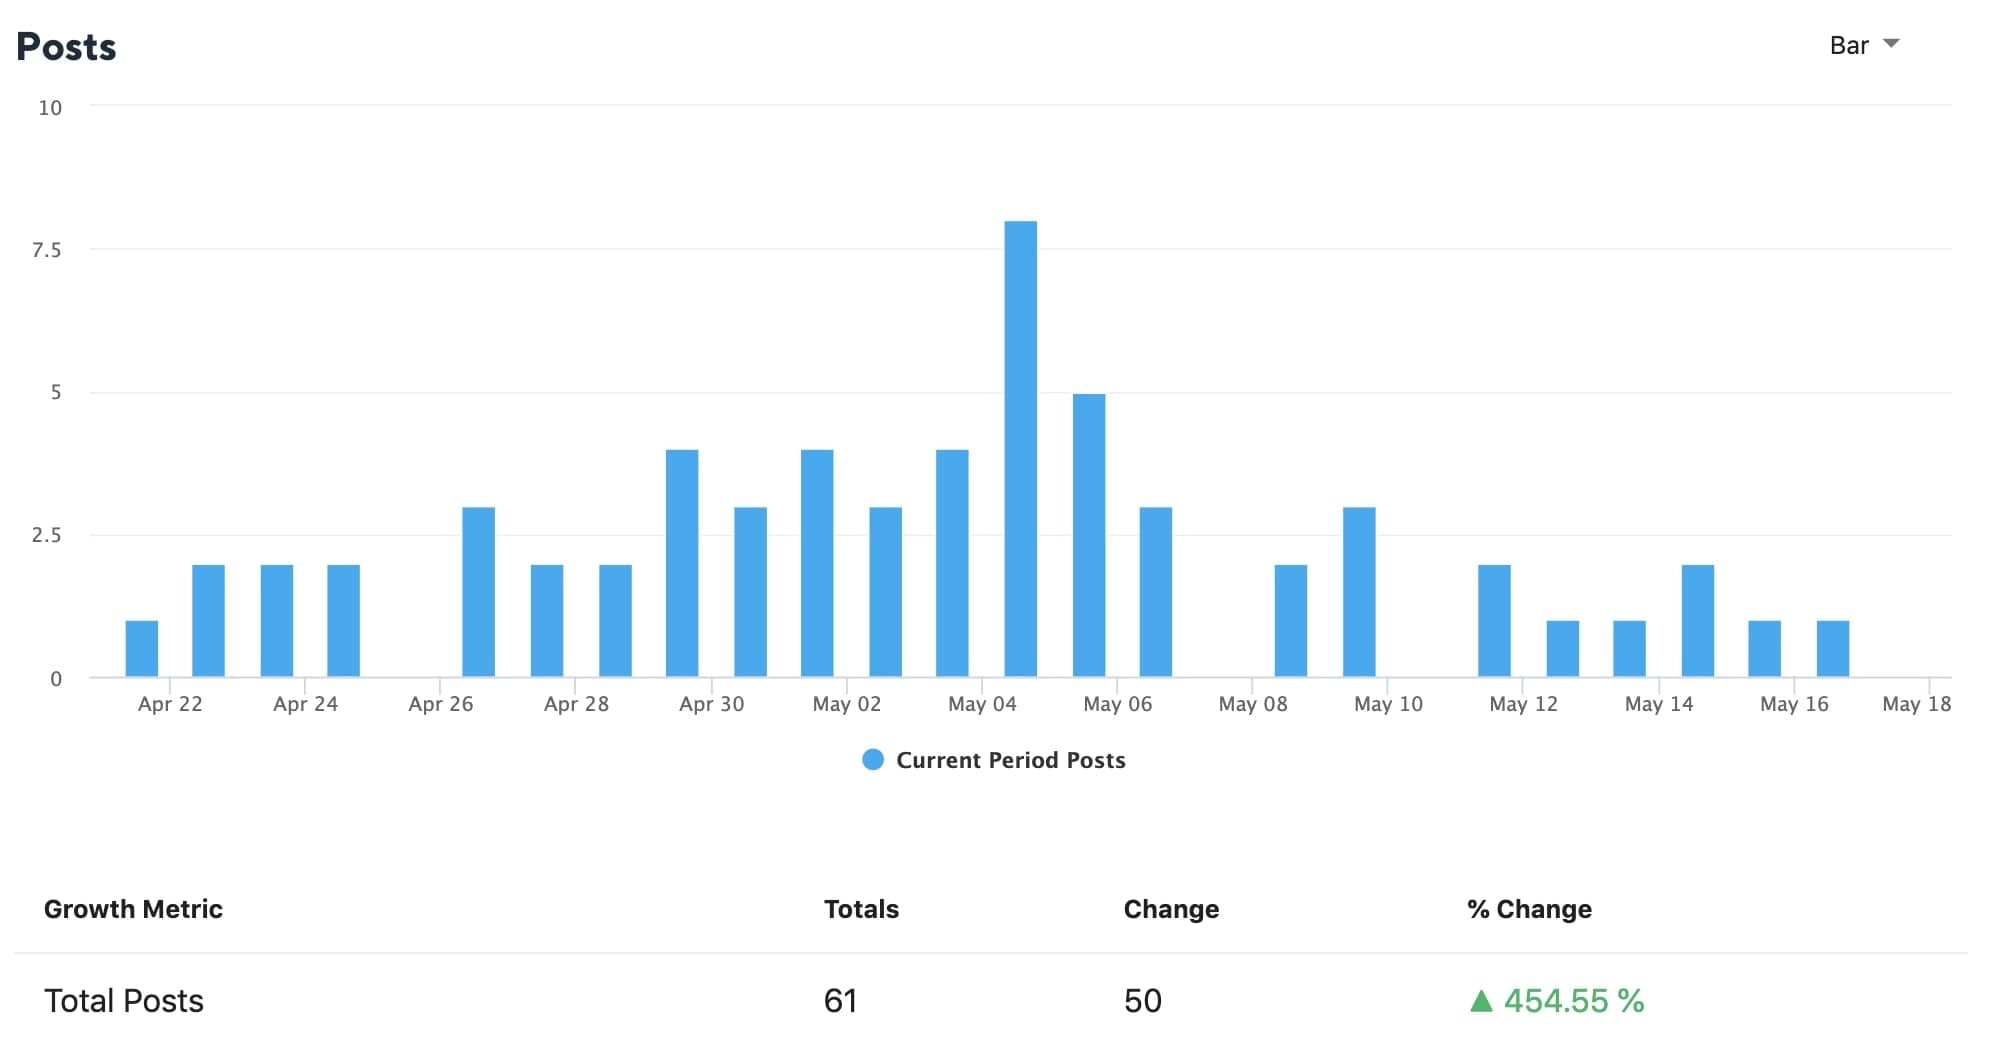
This widget breaks out the total published posts across Facebook pages during the reporting period, along with change as compared to the corresponding previous period and % change.
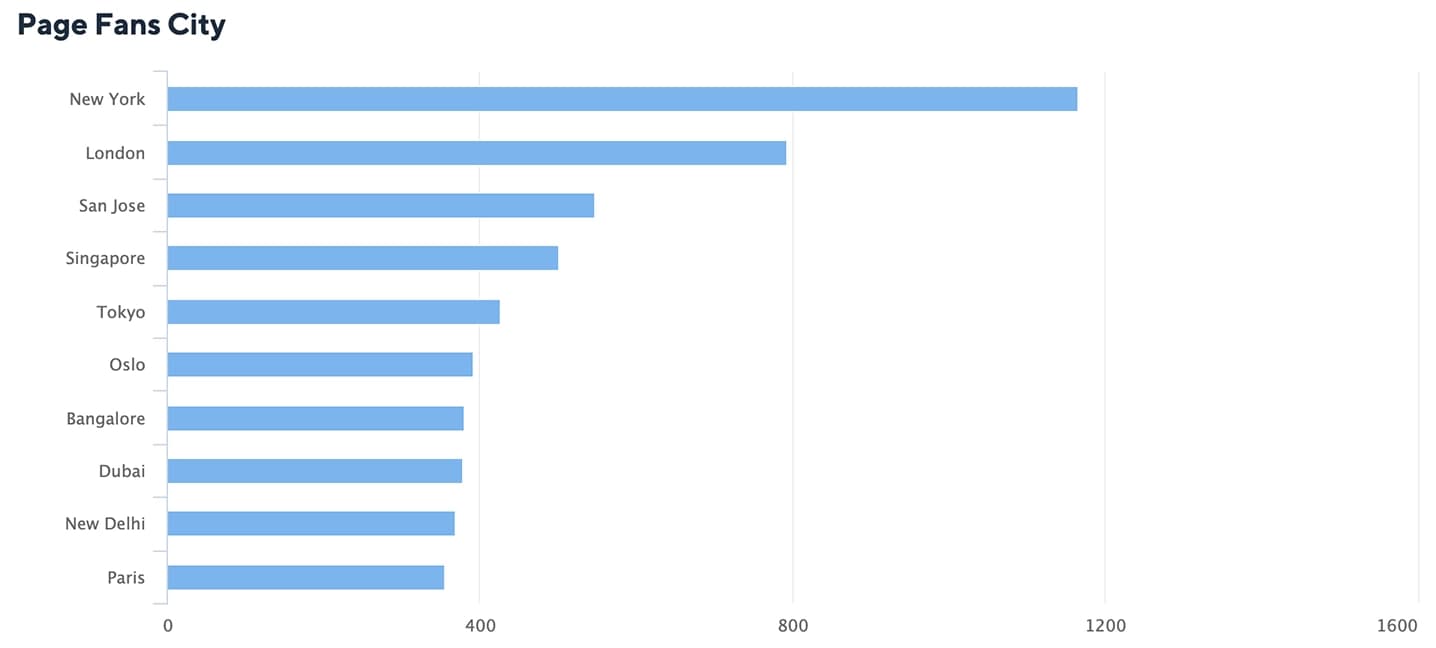
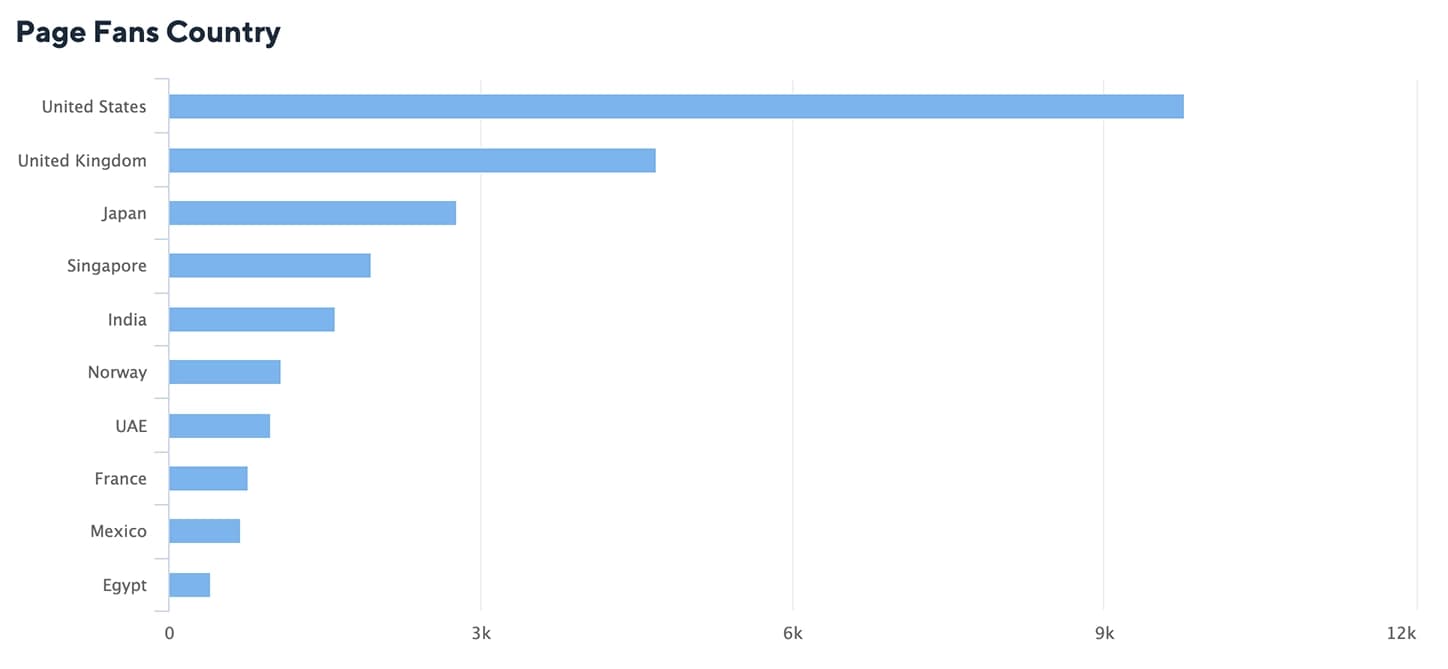
Demographics
This widget helps you know if your posts are targeting the desired audience.
Page Fans City gives the top cities the people who like your Facebook page are from, along with the count from each city on hovering the mouse pointer.
Page Fans Country gives the top countries of the people who like your Facebook page are from, along with the count from each country on hovering the mouse pointer.
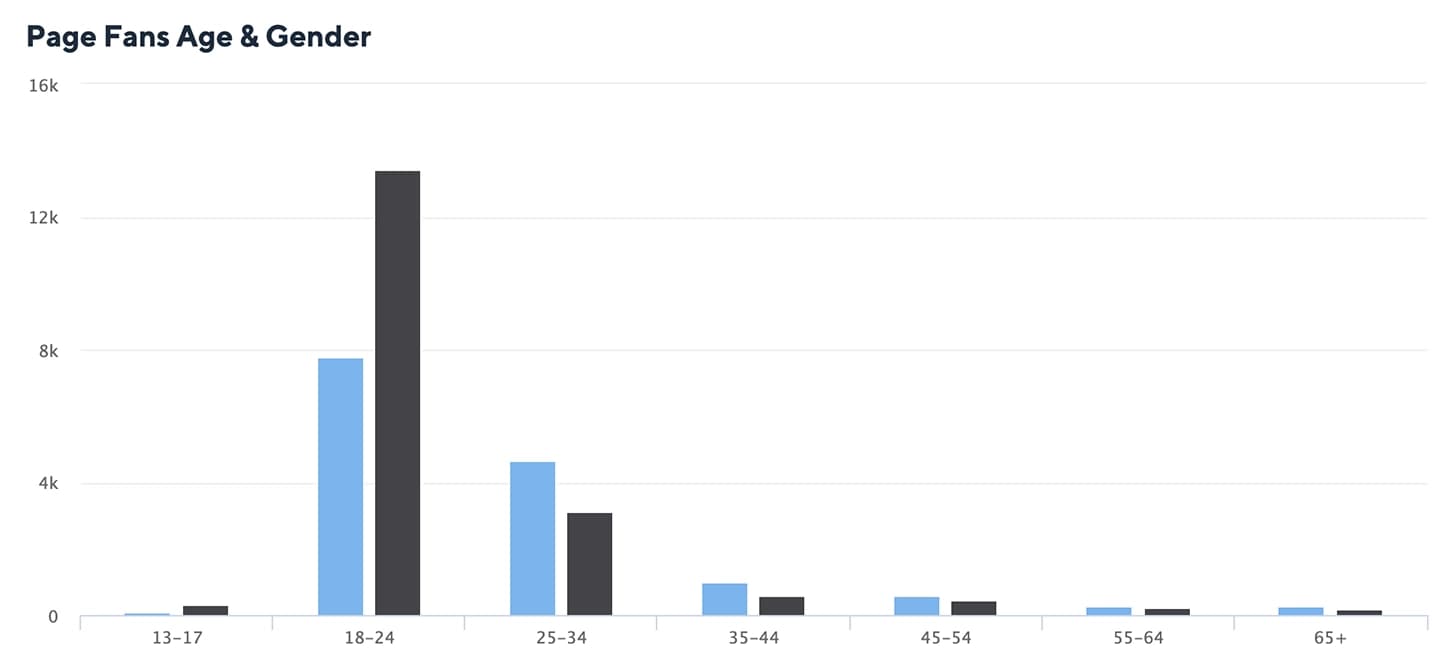
Page Fans Age & Gender gives the number of male and female fans across different age groups.
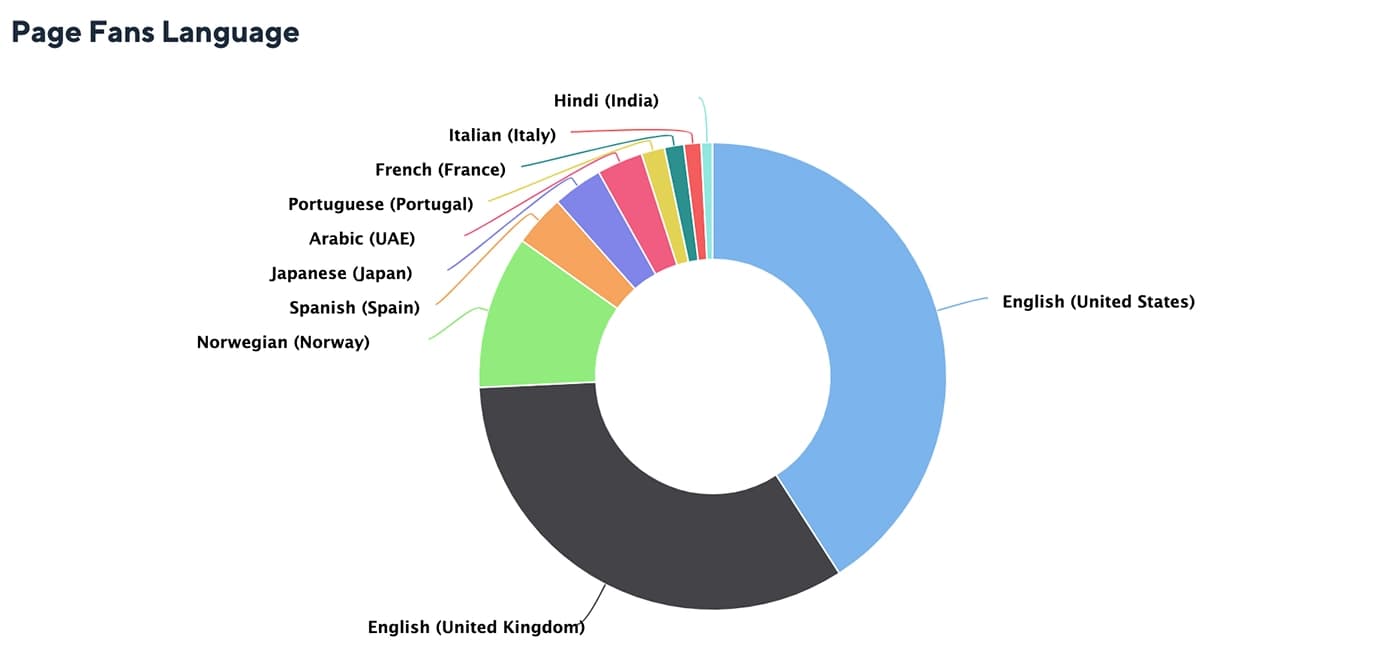
Page Fans Language provides a % pie chart of the native languages of people who like your Facebook page.
Video Views
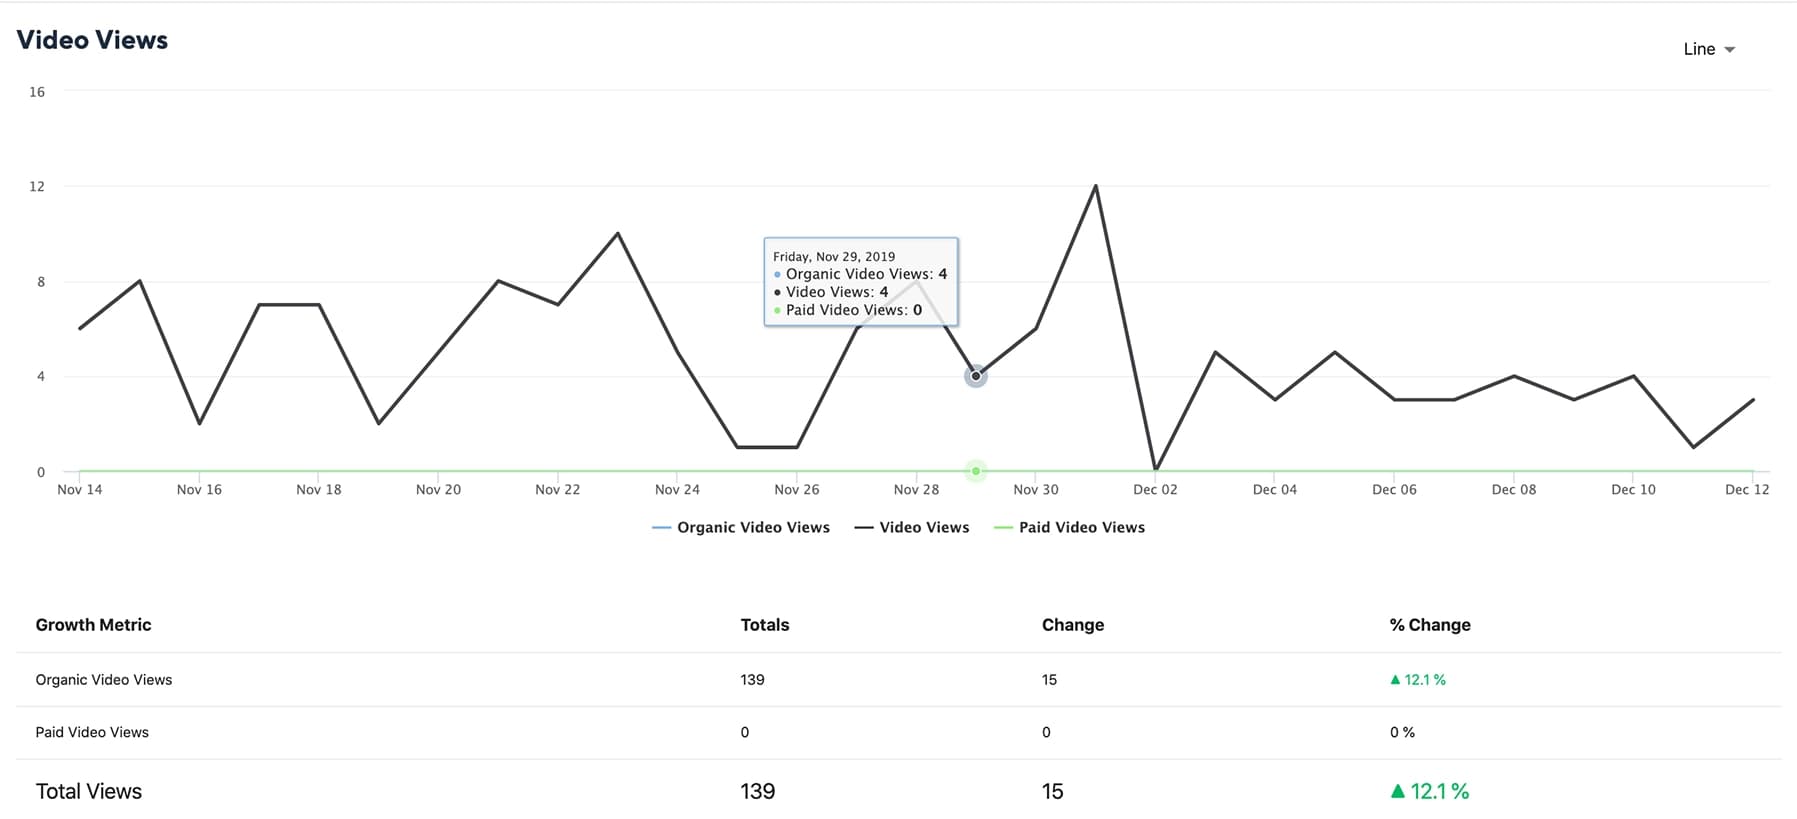
This widget gives you the total volume of video views received on your Facebook page along with change as compared to the corresponding previous period and % change.
Organic Video Views: Video views received on regular Facebook posts
Paid Video Views: Video views received on boosted Facebook posts (ad posts)
Video Views Action
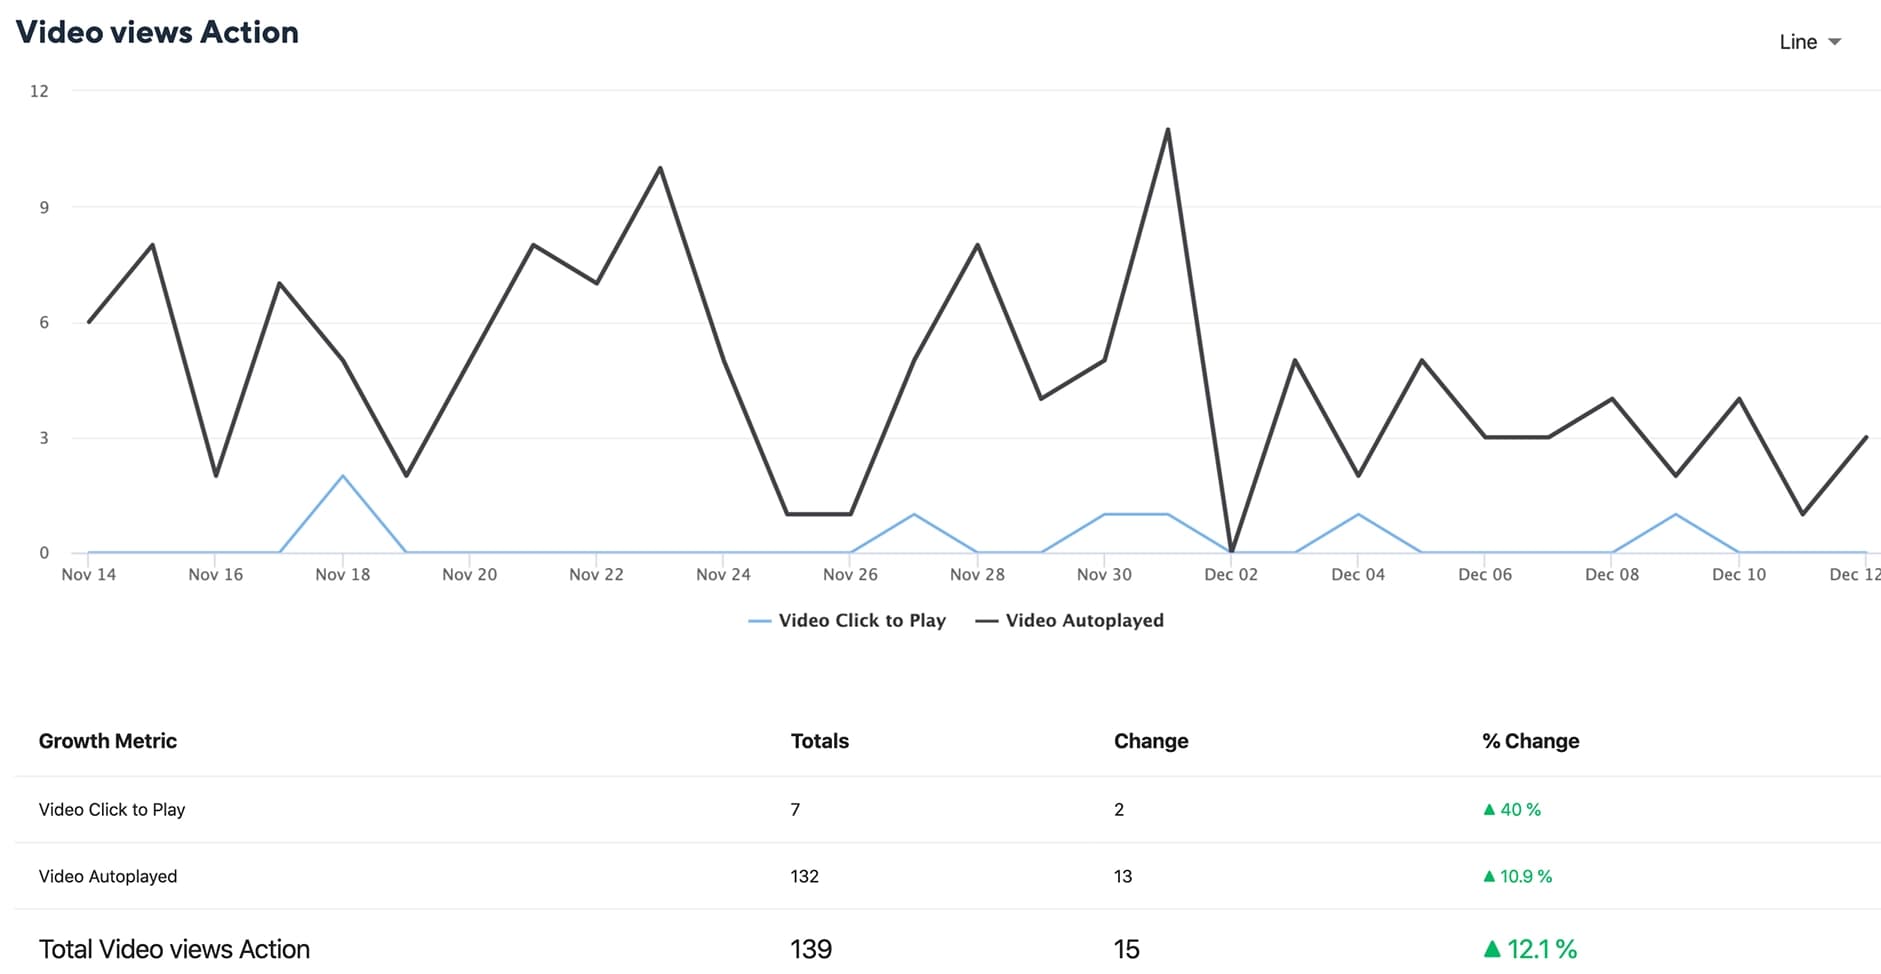
This widget helps you understand the action taken on videos posted via your Facebook page.
Video Click to Play: Total number of videos that were played manually by users on clicking the play button
Video Auto-played: Total number of videos that were auto-played in the user’s feed
Video Viewed Time
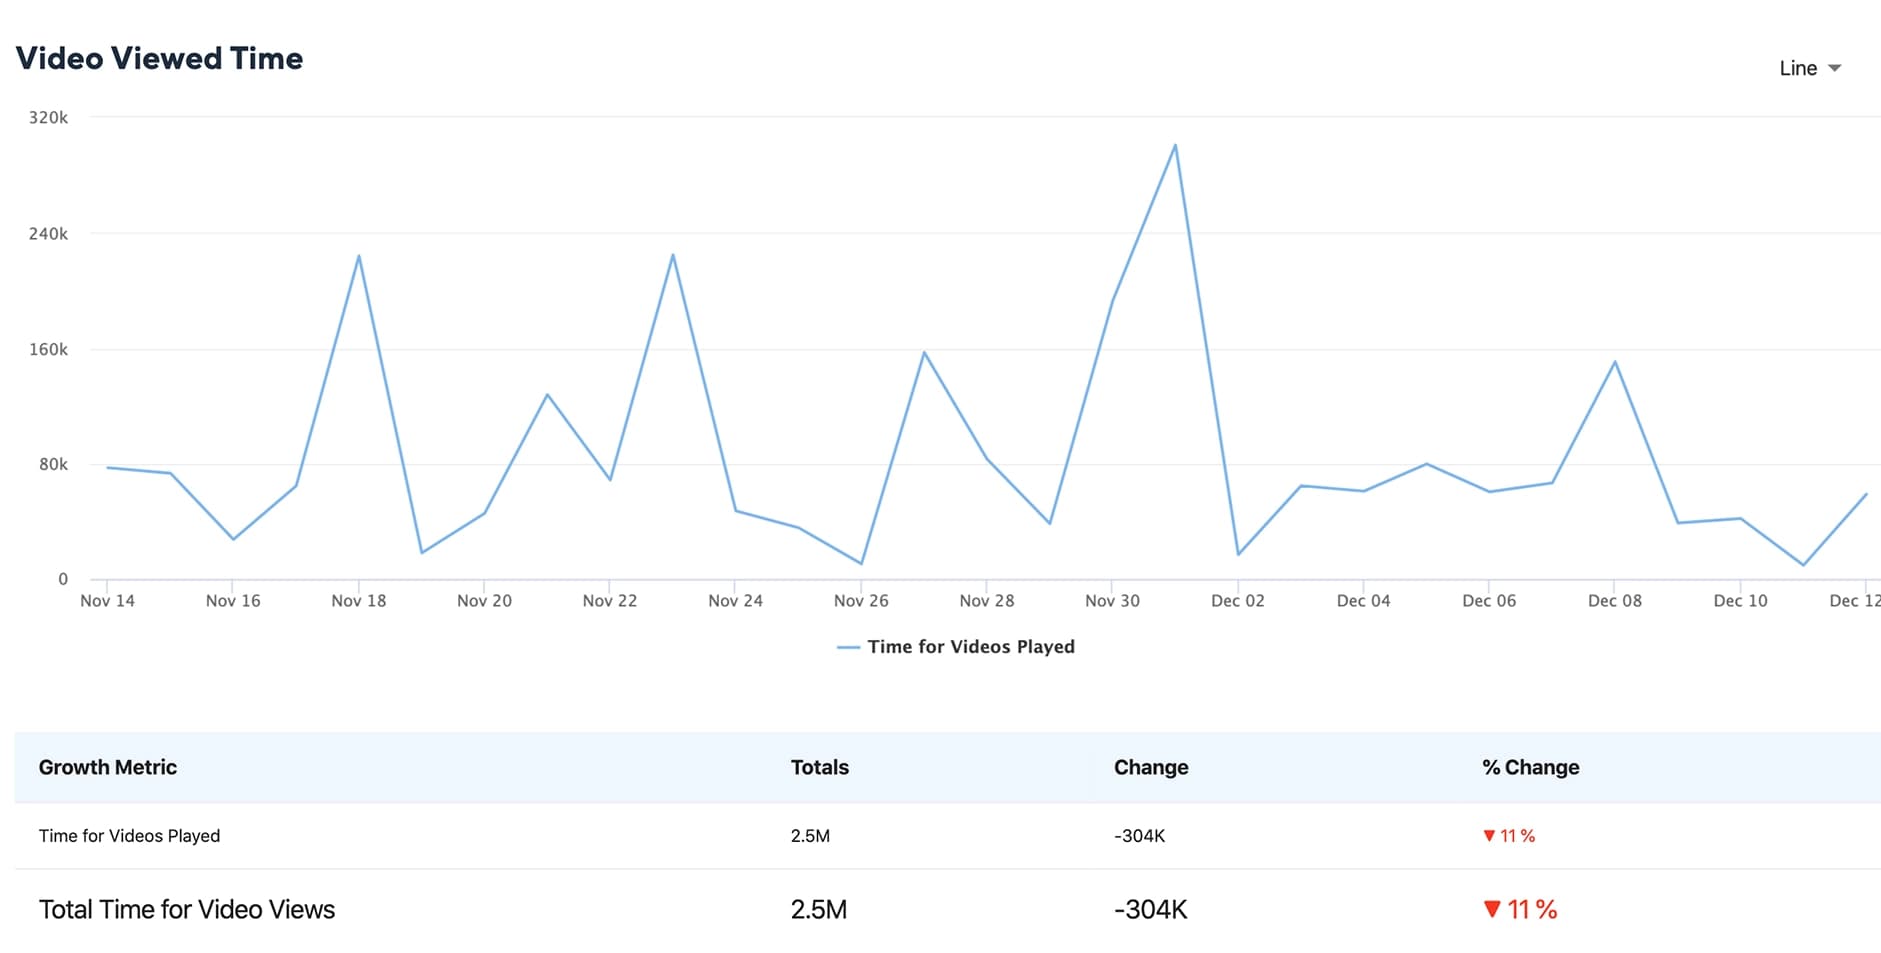
This widget gives you the total video viewed time or watch-hours for your videos along with change as compared to the corresponding previous period and % change.
Top Engaged Posts
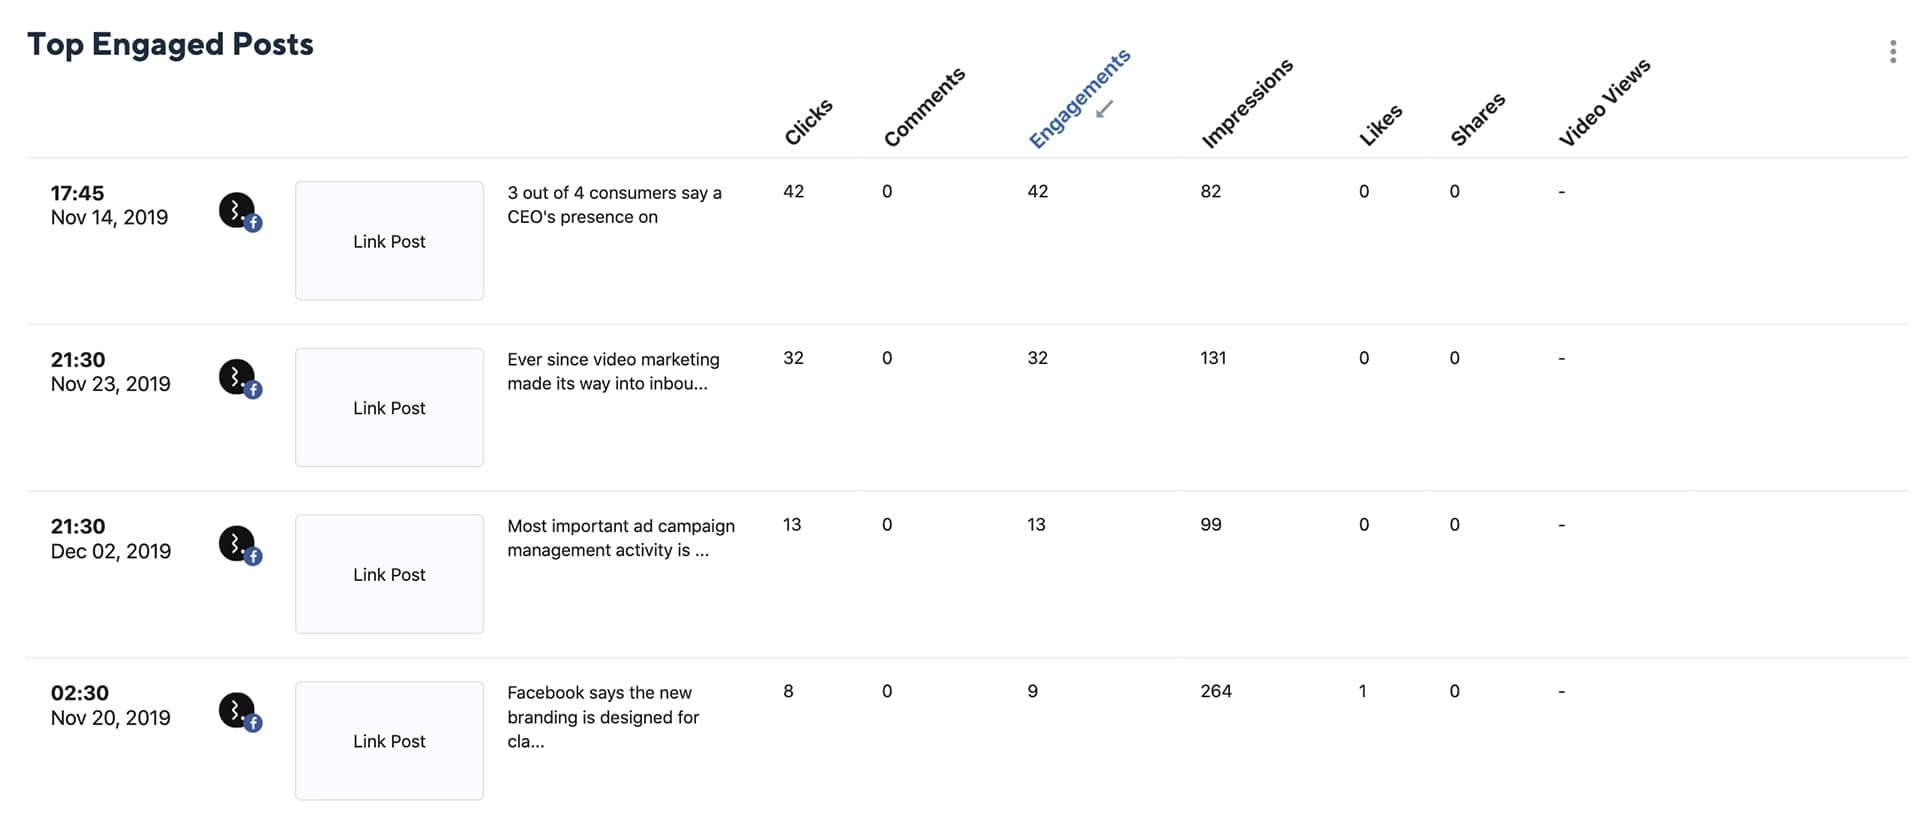
This widget provides you with the posts with maximum engagement published during the selected date range along with their likes, share, comments, click, and impressions. Click on any metric to rearrange your list in an ascending or descending order, respectively. Tap on any post to get detailed metrics along with the name of the User who created the post.
This can be exported in the form of a CSV (excel) file from the three-dot menu on the right.
Sentiment Analysis
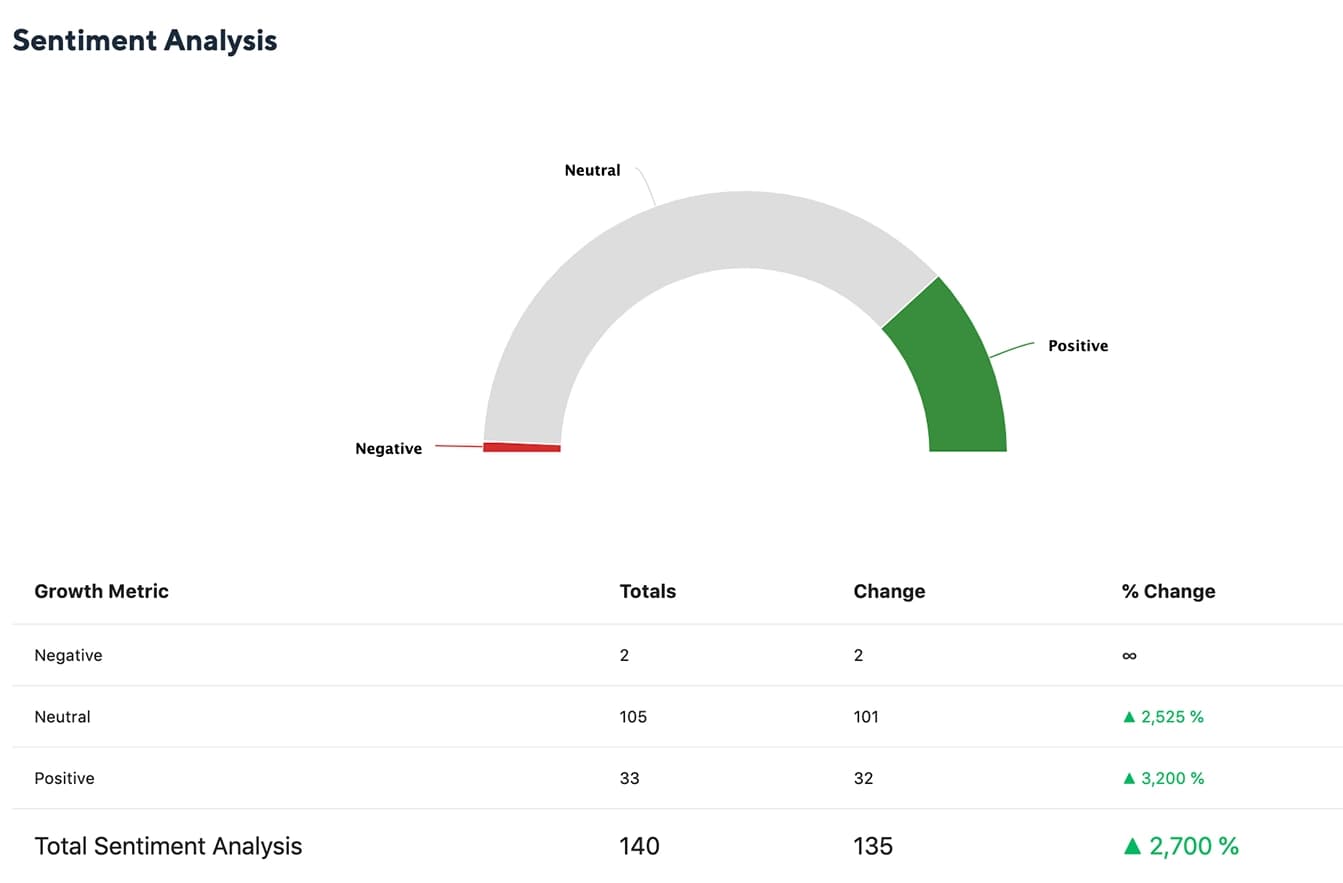
Track the sentiment on incoming messages, mentions, ratings, and comments grouped by positive, neutral, or negative emotions and analyze your customer's opinion towards your marketing campaigns on Facebook.
Stats By Channel
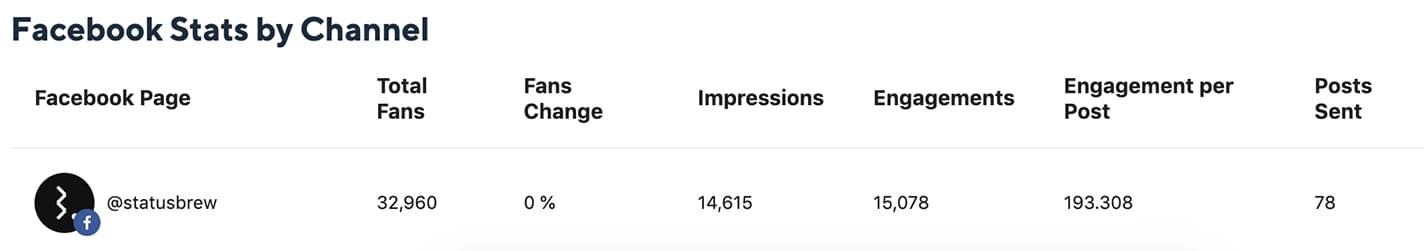
This widget allows you to compare key metrics across all your Facebook pages against each other.
All the graphs can be customized as per choice to Bar, Line, Area, or Tabular form. Facebook Report can be exported in the form of a PDF.