Create Report Using A Template
Statusbrew offers 20 pre-built report templates to help you get started without having to build a report from scratch. Choose from cross-network overviews, network-specific reports, competitive analysis, paid performance, and more.
Templates come with preset widgets for the most common metrics, but you can customize them after selecting one. If you prefer full control, you can also create a custom report from scratch.
Who Can Do This?
Primary Owner, Owner, and Admin can create reports by default. Regular Users need to be assigned the Create Reports permission for specific profiles or profile groups to access and create reports.
Available Report Templates
Statusbrew offers 20 pre-built report templates. Browse them by category below.
Cross-Network
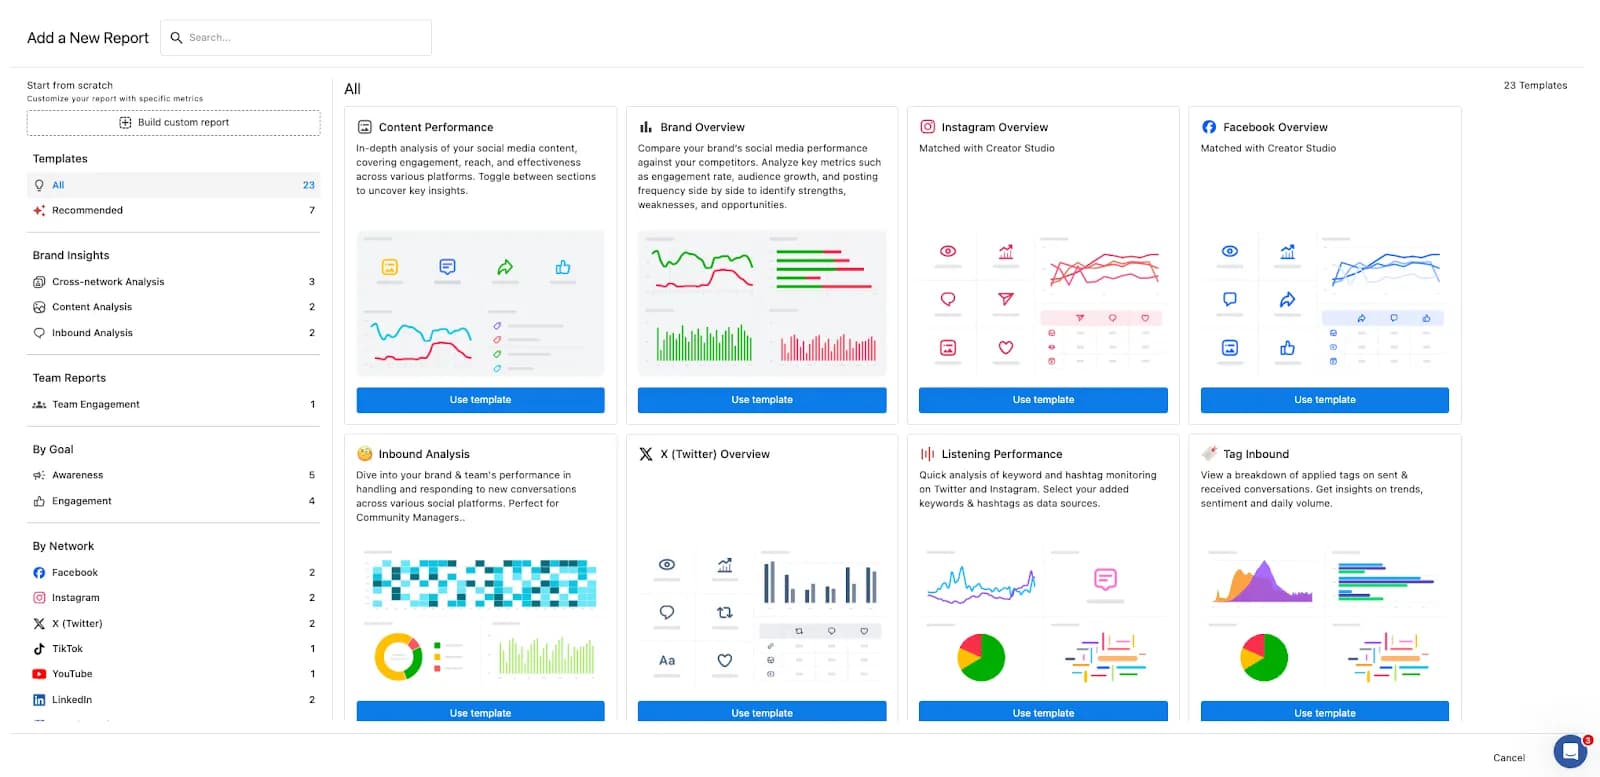
Content Performance: In-depth analysis of post performance across your social media profiles, covering engagement, reach, and effectiveness across various platforms. Use this when you want a single view of how your content is performing across all connected networks.
Brand Overview: Compare your brand's social media performance against your competitors. Analyze key metrics such as engagement rate, audience growth, and posting frequency side by side to identify strengths, weaknesses, and opportunities.
Organic Profile Performance: Consolidates the organic metrics of your connected profiles across networks.
New - Organic Profile Performance: Comprehensive overview of organic profile performance across multiple networks.
Best Time To Post: Identifies the ideal times to post content on each network, using widgets that examine past post performance, audience online presence, and engagement patterns. Use this when planning your content schedule.
Paid Performance Report: View campaign-level trends for Facebook, Instagram, LinkedIn, TikTok, and Audience Network ads, mapped to your KPIs so you can quickly spot the top-performing channels and campaigns.
Tagged Content Performance: Tracks how internally labeled and categorized posts perform across key engagement metrics. Use this to measure the effectiveness of specific content themes or campaigns.
Network-Specific
Instagram Overview: Matched with Creator Studio. Highlights follower growth, reach, impressions, and engagement across your Instagram business profiles.
Facebook Overview: Matched with Creator Studio. Covers your Facebook page performance, including reach, comments, shares, and video metrics.
X (Twitter) Overview: Track impressions, engagement, retweets, replies, and profile activity for your connected X (Twitter) accounts.
LinkedIn Overview: In-depth analysis of your LinkedIn company pages with sections covering engagement, follower demographics, and reach.
TikTok Overview: Track TikTok performance with metrics such as video views, follower changes, engagement rates, and top-performing posts.
YouTube Performance: Analyze your channel's growth, including watch time, traffic sources, and top-performing videos.
Pinterest Overview: A consolidated overview of your Pinterest insights in one place.
Google Business Overview: Evaluate your local presence using widgets that track customer interactions, profile visibility, and rating trends on Google Business.
Competitive
Competitor Analysis: Get insights into how your brand's performance compares to key industry competitors and discover opportunities to leverage.
Competitor Analysis V2: Detailed view of your competitors' performance across key metrics like content volume, engagement, audience sentiment, keyword trends, and top-performing posts.
Engage & Inbound
Inbound Analysis: Dive into your brand and team's performance in handling and responding to new conversations across various social platforms. Perfect for Community Managers.
Tag Inbound: View a breakdown of applied tags on sent and received conversations. Get insights on trends, sentiment, and daily volume.
Listening Performance: Quick analysis of keyword and hashtag monitoring across X (Twitter), Instagram, YouTube, Reddit, Web and Threads. Select your keyword searches as data sources.
How To Create A Report Using A Template?
Go to Reports from the sidebar.
Click Create a new report.
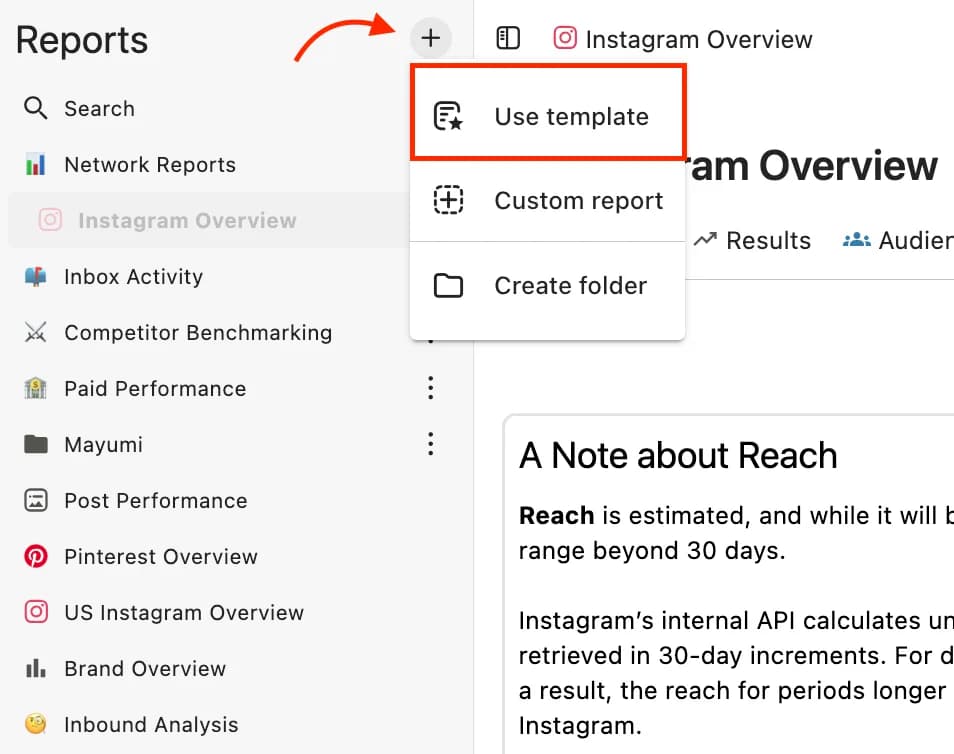
Select Use a template. The Add a New Report window will open.
Browse the templates from the left panel and select one. Click Use template.
Edit the Report name if needed. You can also change the icon.
Add a Report description.
Select Data sources. All data sources are selected by default. Deselect any you don't need.
Click Add collaborator to add team members. Assign them Edit or View permission.
Click Create.
Your report is ready. You can customize widgets or adjust the date range before sharing.
Users with Admin level or above can view and edit all reports without being added as collaborators.
Once your report is created, you can add widgets manually using the Widget Library or build them from scratch. You can also use AI to automatically generate widgets, a faster way to get the right metrics on your dashboard without manually configuring everything. Learn more about adding widgets to a report.
How To Read A Report: Switching And Adding Sections
Once you've decided on the template settings, the data dashboard will begin generating immediately, filling the screen with data according to the template.
Sections are the key element in a report for grouping related widgets. Each section is organized around a particular theme or analytical point, and the widgets placed within it visualize data related to that theme.
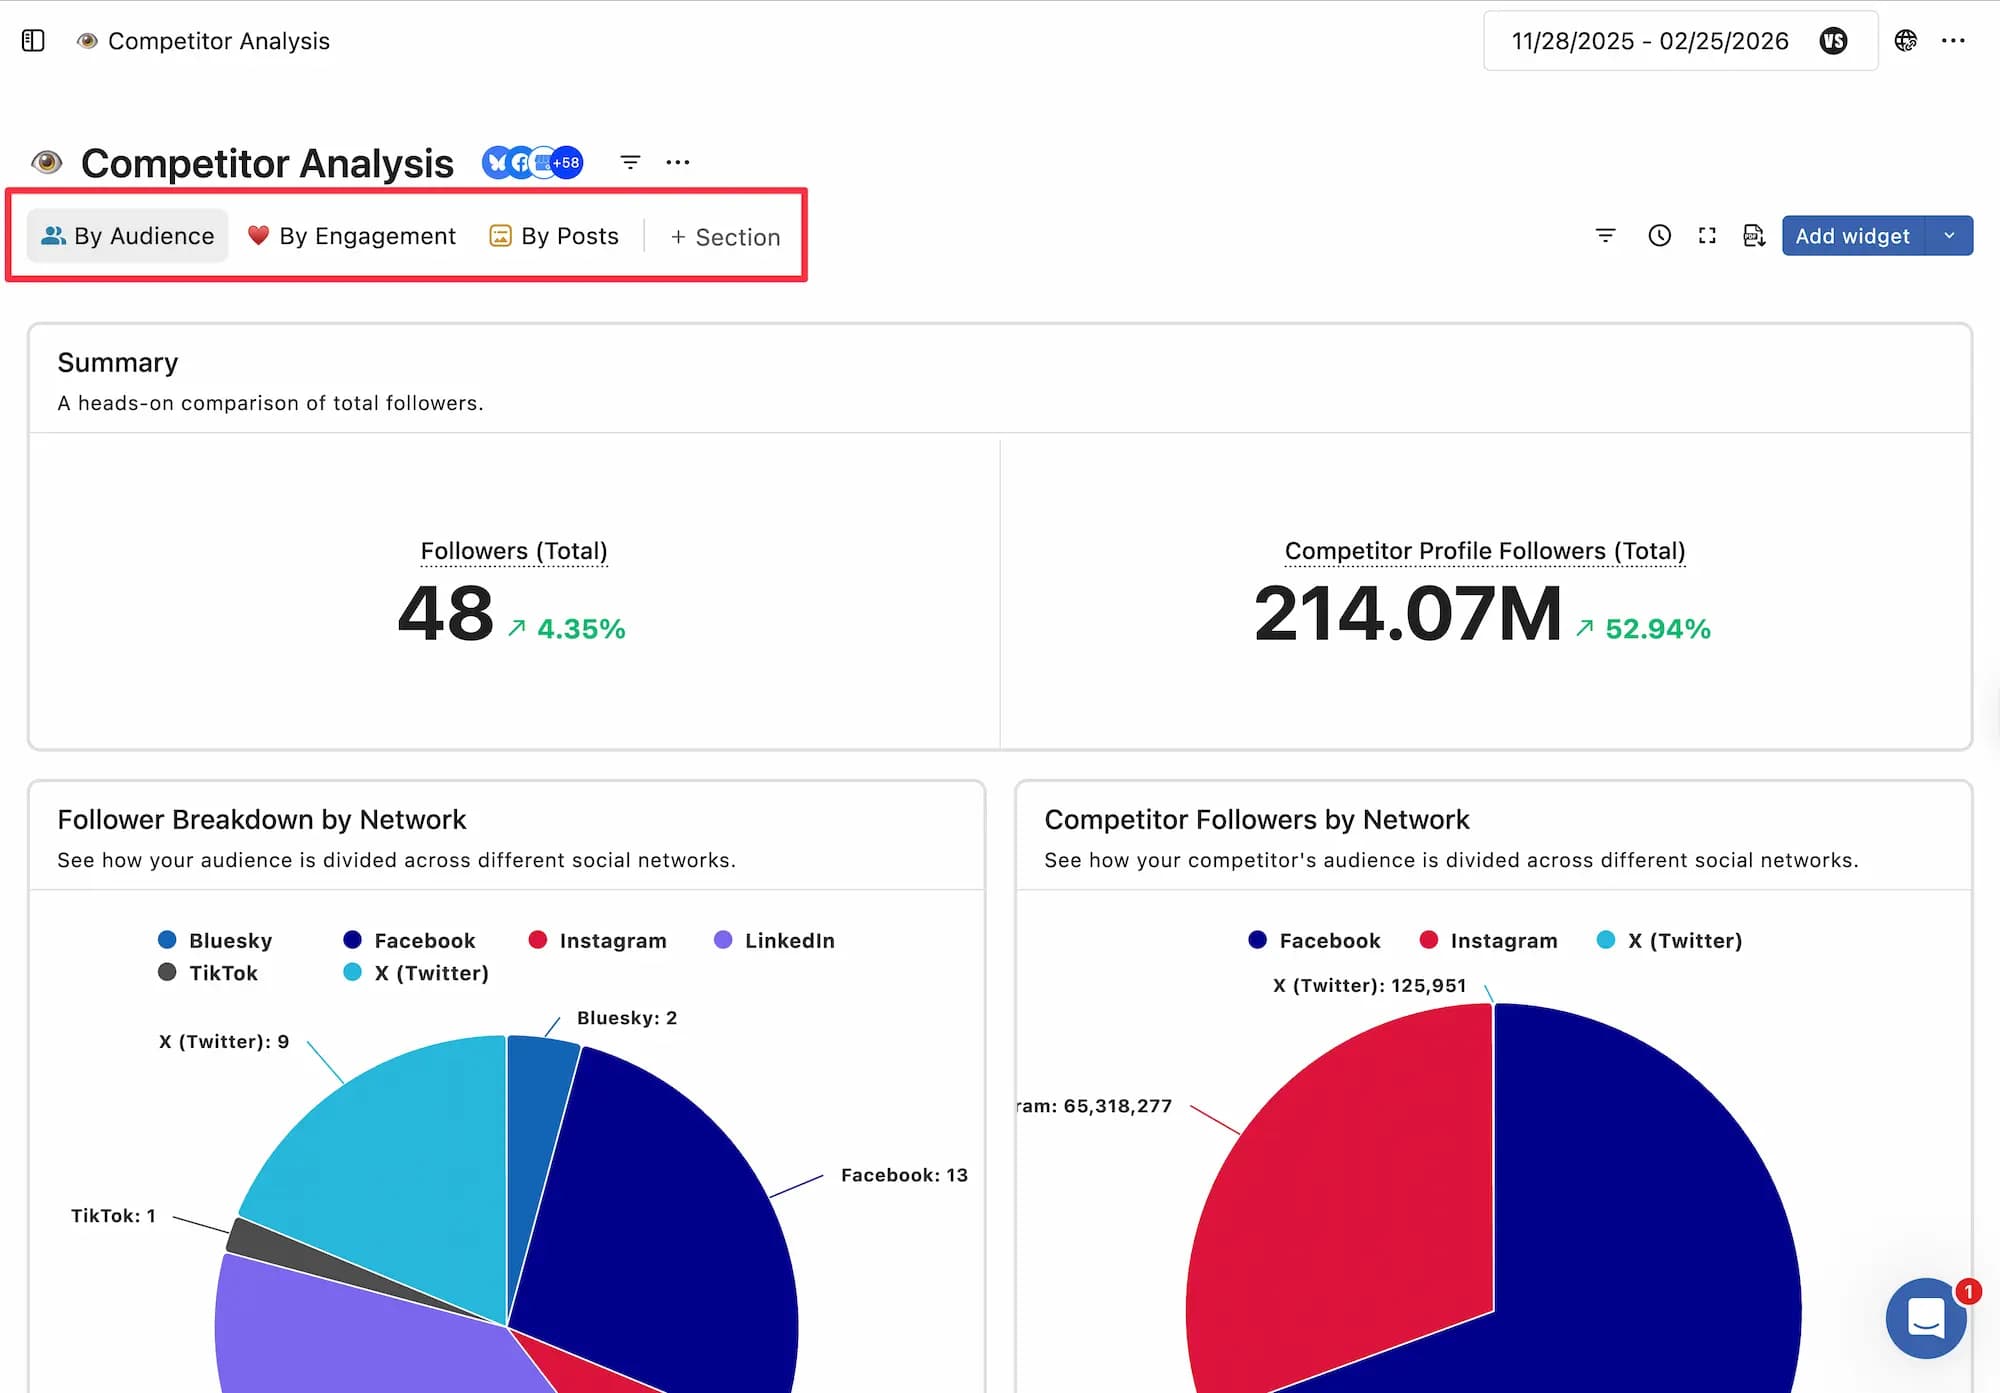
If there are multiple sections, you can click on each section to switch between them and view or edit the data in that section.
Hover over the section name. A drag icon will appear, allowing you to rearrange sections by dragging and dropping.
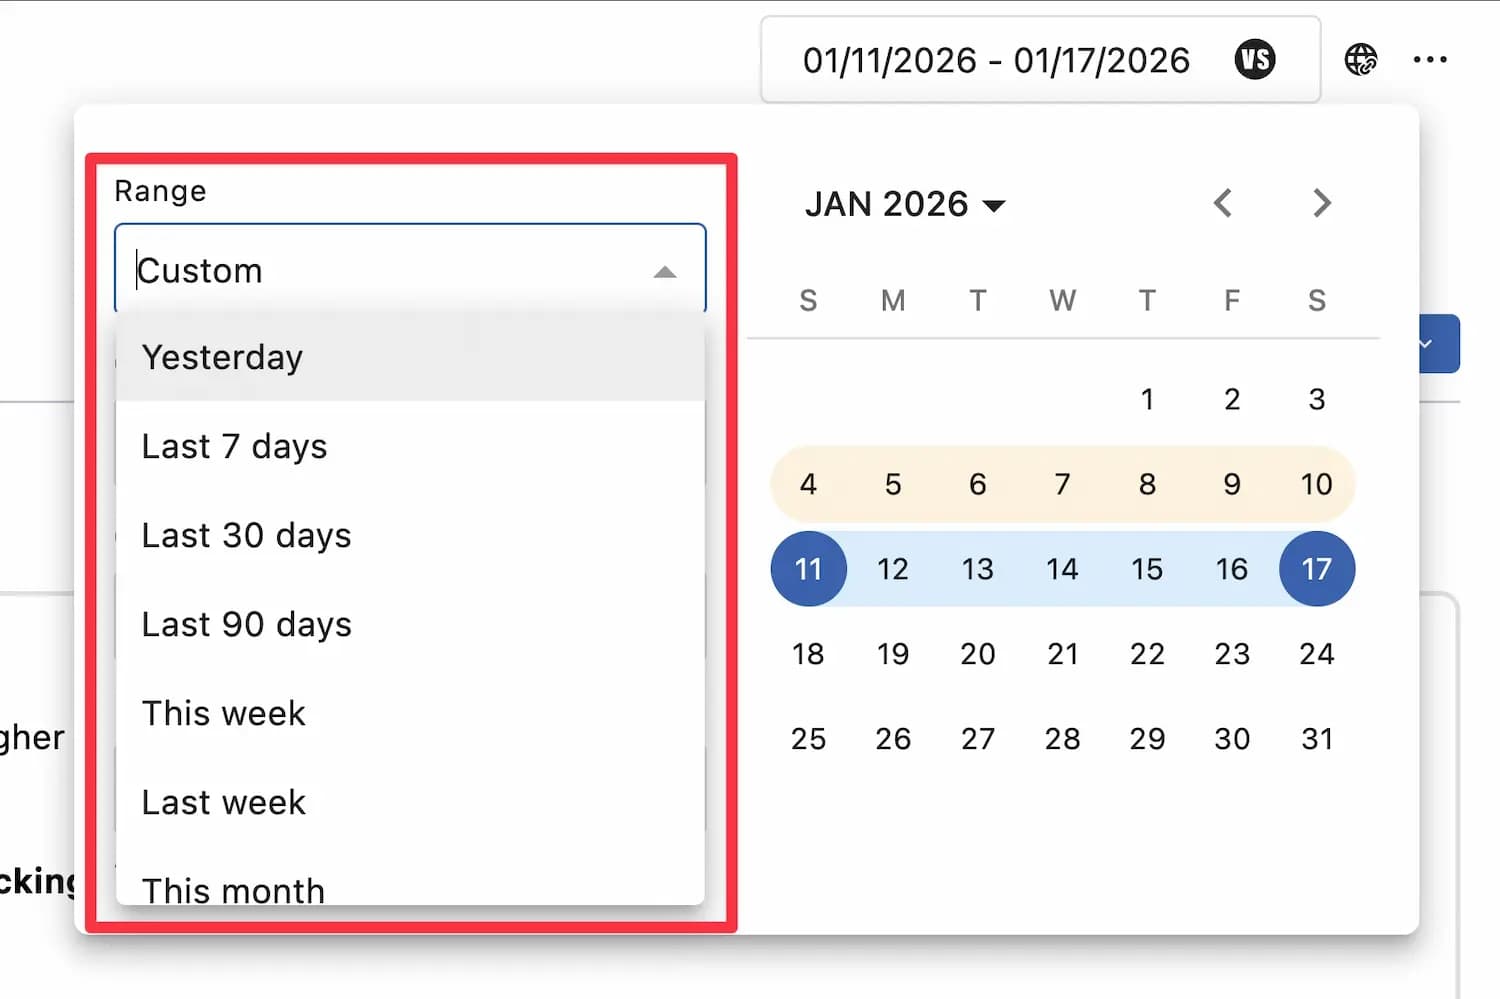
Report Data Acquisition Period (Optional)
Set the range of report data to be retrieved. By default, it is set to the last week.
If necessary, you can also set a comparison period to compare the data.
Open the date picker in the upper right corner. The calendar dialog will appear with these options:
Yesterday's data
Data from the last 7 days
Data for the past 30 days
Last month's data
This month's data
Custom Period
If you want to compare specific data, check the comparison period setting and add the period to compare.
Change The Data Source (Optional)
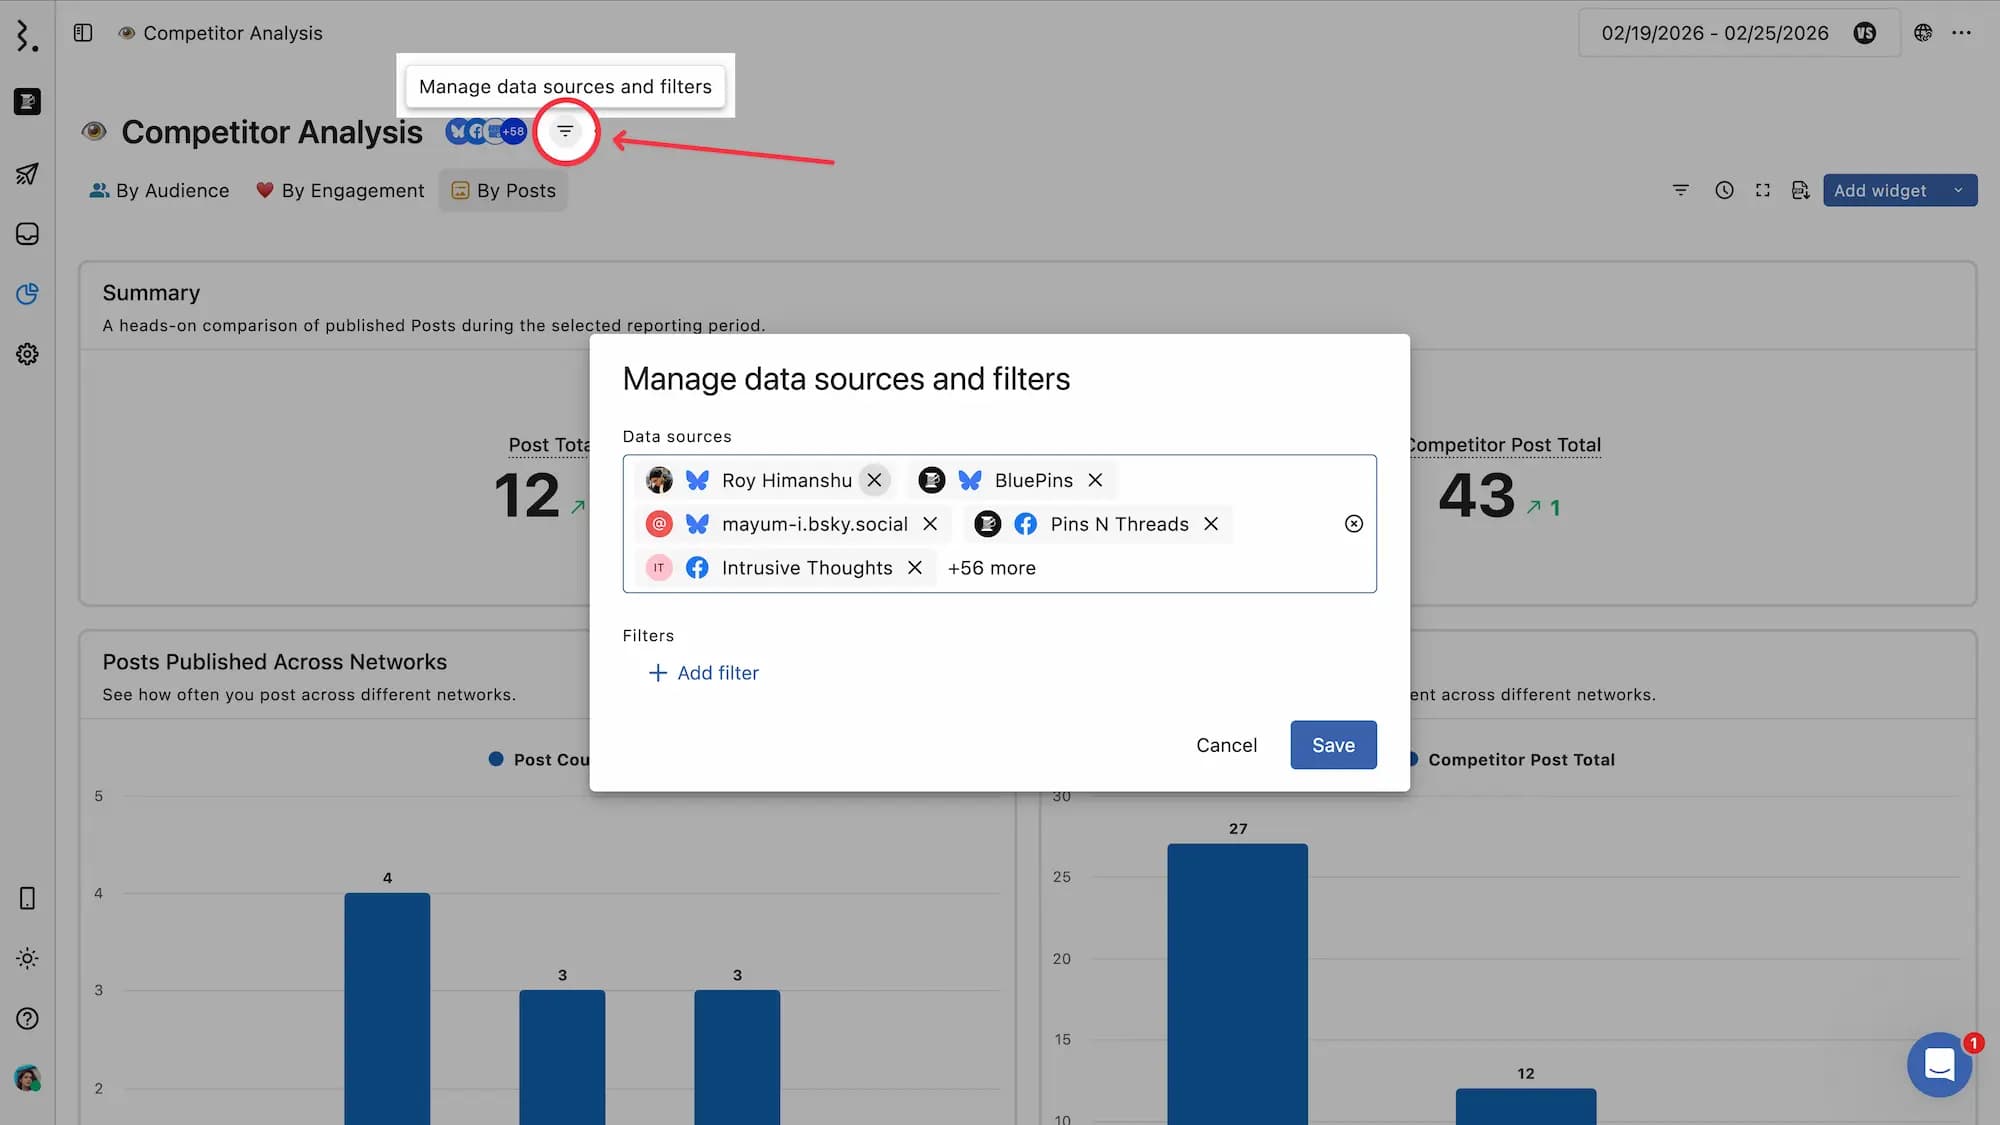
When generating a template, you can optionally select the data source that will be the source of the data, but you can also change the data source on a dashboard-by-dashboard basis at any time after the report is generated.
If you want to view reports using only a specific data source, use the sorting and filtering functions in the widget settings to narrow down the data source.
How Is The Report Data Structured?
To see the metrics and dimensions used in any widget, hover over the top-right corner of the widget to reveal the menu. Click Widget settings to open the widget configuration form.
FAQs
Can I edit a template after applying it?
Yes. Once you create a report from a template, everything is fully editable. You can add, remove, or resize widgets, change the date range, and update data sources at any time.
Can I use the same template for multiple reports?
Yes. You can apply the same template as many times as you need. Each report created from a template is independent.
Can Regular Users create reports from templates?
Only if they have been assigned the Create Reports permission for the relevant profiles or profile groups. Without that permission, they cannot access or create reports.
Can I share a template-based report with someone outside Statusbrew?
Yes. Use Shared Links to share a live, view-only version of any report with external stakeholders without giving them access to your Statusbrew account.
What is the difference between a template report and a custom report?
Templates include pre-built widgets for common use cases. A custom report starts blank and lets you build your dashboard from scratch using any metrics and dimensions from the widget library.
Can I add widgets to a template-based report?
Yes. After creating the report, click Add widget to add widgets from the Widget Library or build a custom one. You can also use AI to generate widgets automatically.
Which reporting templates should I use to get a summary of all the profiles connected?
Statusbrew doesn't have a dedicated "profile summary" screen. To see a summary of all your connected profiles' performance, go to Reports, click Create a new report, select Use a Template, and choose Brand Overview. This template pulls key metrics like followers, engagement, reach, impressions, and top posts across all your connected profiles in one view.
Pinterest data doesn't appear in the Brand Overview dashboard because the metrics the template uses (such as followers, engagement, and reach) aren't supported by Pinterest's API. The Brand Overview widgets simply don't have Pinterest as a compatible network, so even if you add a Pinterest profile as a data source, it won't populate those widgets.
To report on Pinterest performance, you'd need to build a custom report using Pinterest-specific metrics like impressions, saves, pin clicks, and engagement rate.