Looking for a Facebook analytics or reporting tool?
Bookmark this blog, as this is going to end your search.
Meta Suite has made many things difficult for its users, including reporting, especially when you manage multiple Facebook pages.
Its dashboards are not very user-friendly. You have to toggle between tabs to read analytics for multiple profiles, and the Paid vs. Organic report is also not very straightforward.
I know the tool is Free, but if you are investing effort and time to understand past campaign performance, this is also a cost.
And if the analytics are not user-friendly, you won't be able to get a direction for future campaigns.
On top of that, you have to find good analytics tools and compare.
I got you this time. I have explored and compared the best social reporting tools for you so that you can focus on choosing the best one for you and offer better ROI to your clients.
Top Facebook Analytics Tools Comparison Table
Features | Statusbrew | Sprout Social | Hootsuite |
|---|---|---|---|
Pricing | $129/m (3 users, 10 profiles) | $299/m/user (Unlimited Profiles) | $149/m/user (10 profiles) |
Paid Vs Organic | Yes | Yes | Yes |
Tag Reporting | Yes | Yes | Yes, but in $299 plan |
Competitor Benchmarking | Yes (Under $229 plan, no limit) | Yes | Yes (Maximum 5) |
Team Insights | Yes (Under $229 plan) | Yes (Under $399 plan) | Yes, but in $299 plan |
Best Time Reports | Yes | Yes | Yes |
Sentiment Report | Yes (Under $229 plan) | Yes (Under $399 plan) | Yes |
Shareable Links | Custom Shareable links | Yes (Add-on) | Yes, but in $299 plan |
Download Reports | Yes (PDF, CSV) | Yes (Under $399 plan via email) | Yes |
Let's talk about these top tools and a few more in detail.
Statusbrew
Statusbrew is a complete social media management tool, usually compared with top tools like Sprout Social and Hootsuite, because it offers 1:1 feature parity at a fair cost.
Statusbrew offers 20+ templates for creating dashboards with one click. Additionally, it tracks 250+ KPIs and offers 100+ widgets so you can create the reporting dashboards you like.
Statusbrew offers 9 widgets, 2 templates, and 40+ KPIs for Facebook only, which can be further represented in 20+ different visuals.
You can analyze Paid vs Organic performance reports with 1 click.
Any external or internal user can review the reports via shareable links or email or download them in PDFs, CSVs, etc.
Shareable links are totally under your control. You can lock the date range, remove unnecessary tabs, change the time zone, or give the report an expiry date.
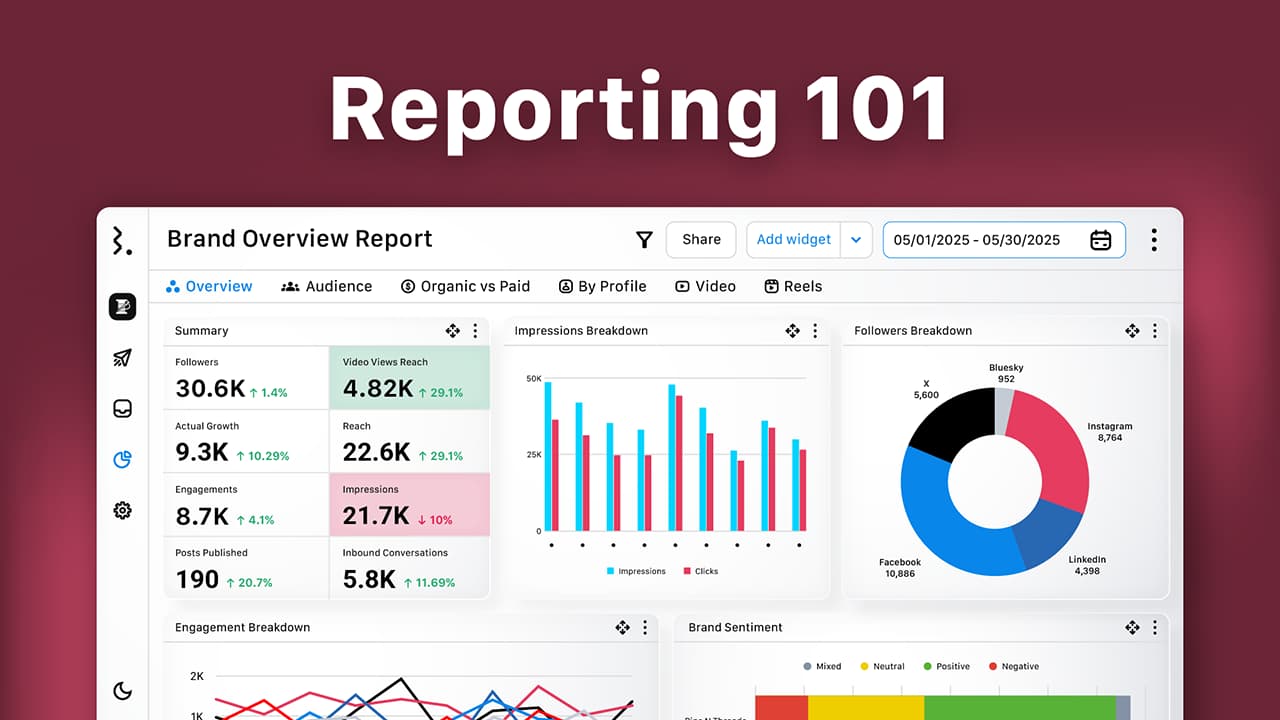
Check out a Facebook Overview reporting template created with 1 click in Statusbrew.
Statusbrew can bring back 12 months of historical data during migration.
Pricing:
Standard plan starts at $129/m (3 users, 10 social profiles)
Sprout Social
With Sprout Social, you can easily visualize Facebook data, everything from overall page performance to the details of individual posts.
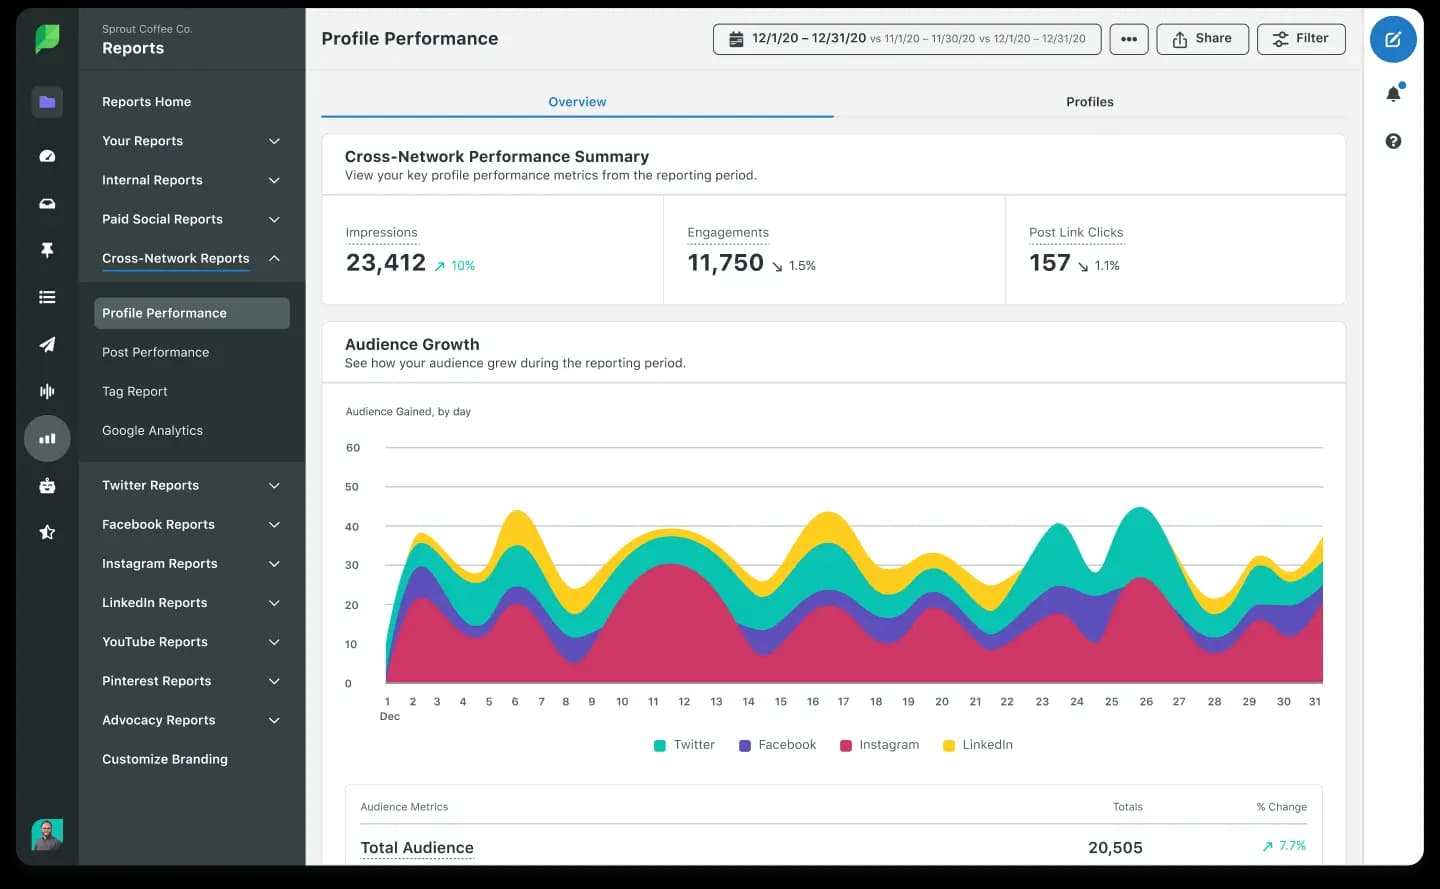
It also shows you how your audience is growing over time, which helps you understand what content works best to attract new followers.
Sprout makes it easy for you to pull together analytics reports that look slick and professional.
You can also export these reports as PDFs or dig deeper by downloading the raw data in CSV format.
The only challenge is that if you need basic reports, $199 will seem a little unfair. If you are like a person who knows "Numbers make everyone happy" and want to dig deeper into more data, you have to pay $299 per month, which is again costly for one user.
Pricing
Standard starts at $199 per user (Very basic reporting features)
Note: In case you have tried Sprout in past, you should check our Sprout Social alternatives blog.
Social Insider
Social Insider gives you a proper deep dive into how your page is doing compared to others.
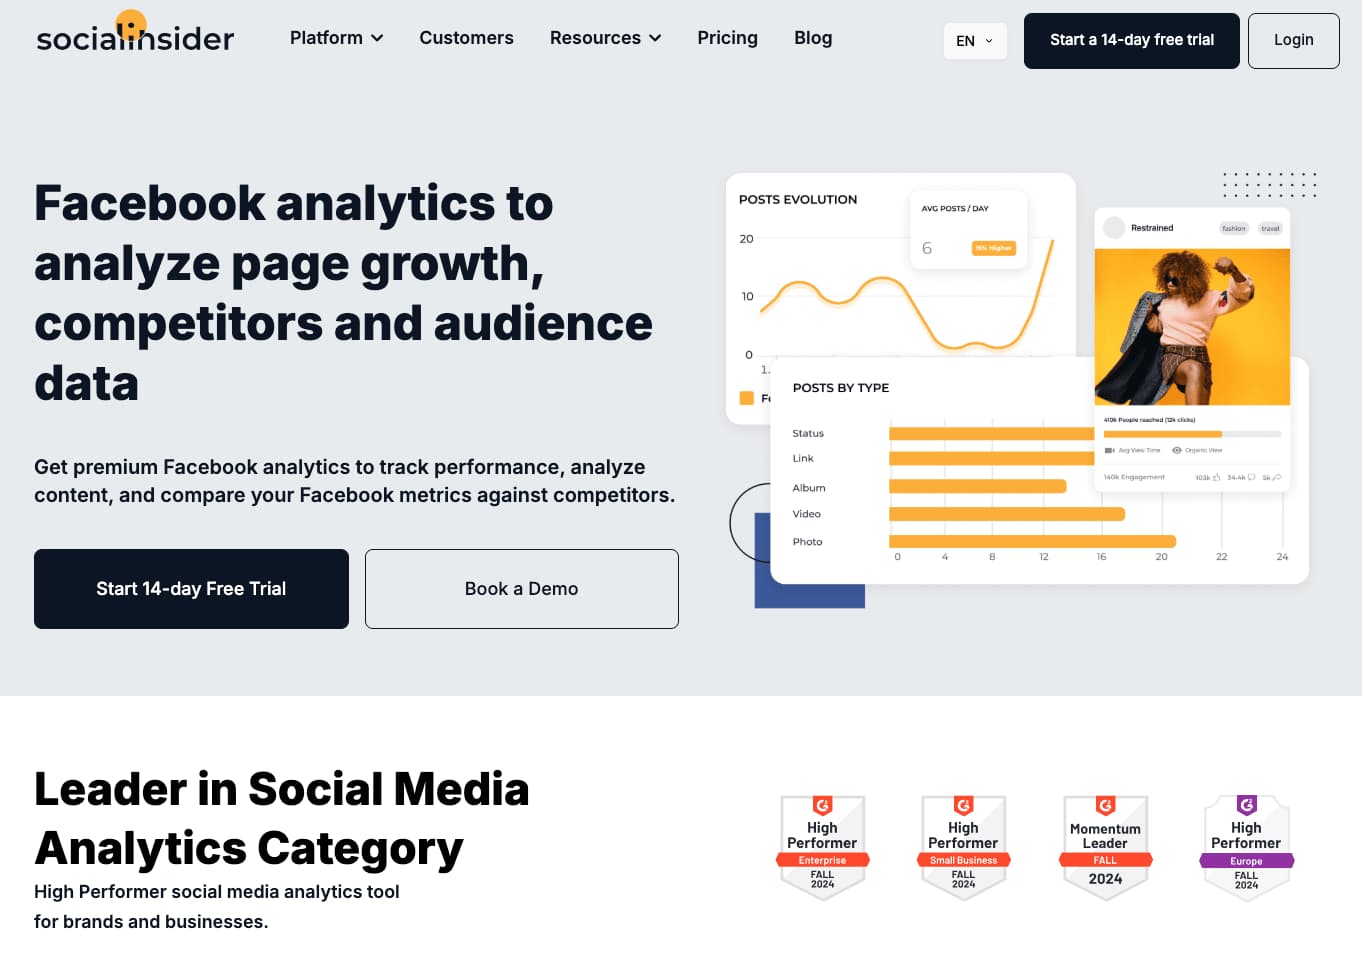
It's not just about how many likes or shares you've got; it digs into how you're doing on engagement, reach, and all that, and it shows you how you stack up against your competitors.
You can directly compare your page’s performance with competitors, looking at everything from engagement rates to follower growth. This will help you understand where you stand in your niche and what strategies might work.
This feature allows you to tag and group posts based on keywords or themes, making it easier to analyze performance based on different content pillars and understand what drives value for your brand.
Pricing
Adapt starts at $82 per user (Only 3 months of historical data, 20 social profiles)
Sendible
Sendible offers two types of Facebook reports: a Quick Report that pulls an overview of the most important Facebook metrics with a single click, and more advanced Custom Branded Reports that you can tailor, brand, and automate.
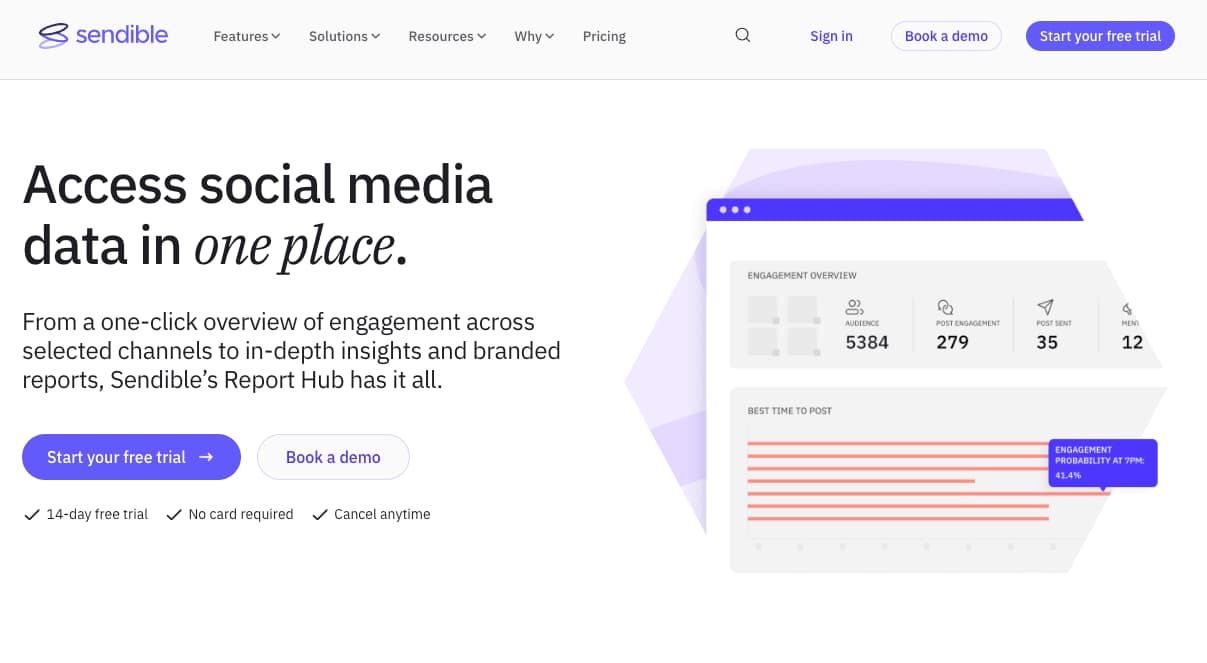
With one click, you can get a snapshot of growth patterns, engagement shifts, Reels performance, and the best times to post-perfect for quick check-ins.
Create presentation-ready Facebook reports for stakeholders or clients. Add or remove modules, customize the cover page, combine data from other social platforms, and export in multiple formats.
Track organic versus paid likes to understand what drives your Page’s growth and adjust strategy accordingly.
Pricing
Scale starts at $199 per month (2 users)
Measure Studio
Measure Studio is for the teams that thrive on data. It’s one of the most advanced Facebook analytics platforms that brings both organic and paid content under one hood, so your efforts reduce, but your results multiply.
The standout feature shows how algorithms perceive your posts, so you understand exactly how content is categorized and how that impacts your reach.
Whether it’s campaign performance or audience behavior across platforms, you get the flexibility to measure what actually matters to you.
Identify your best formats by comparing top-performing posts to your averages. Group posts by campaign and compare them head-to-head. And when it’s time to share results, forget dull spreadsheets.
Measure Studio’s reports come as clean, presentable slides with real-time data.
Pricing
Not available publicly
Rival IQ
Rival IQ simplifies the whole process by pulling all the important stats into one place. It makes it easier for you to see how many people are engaging with your posts and how your FB ads are performing.
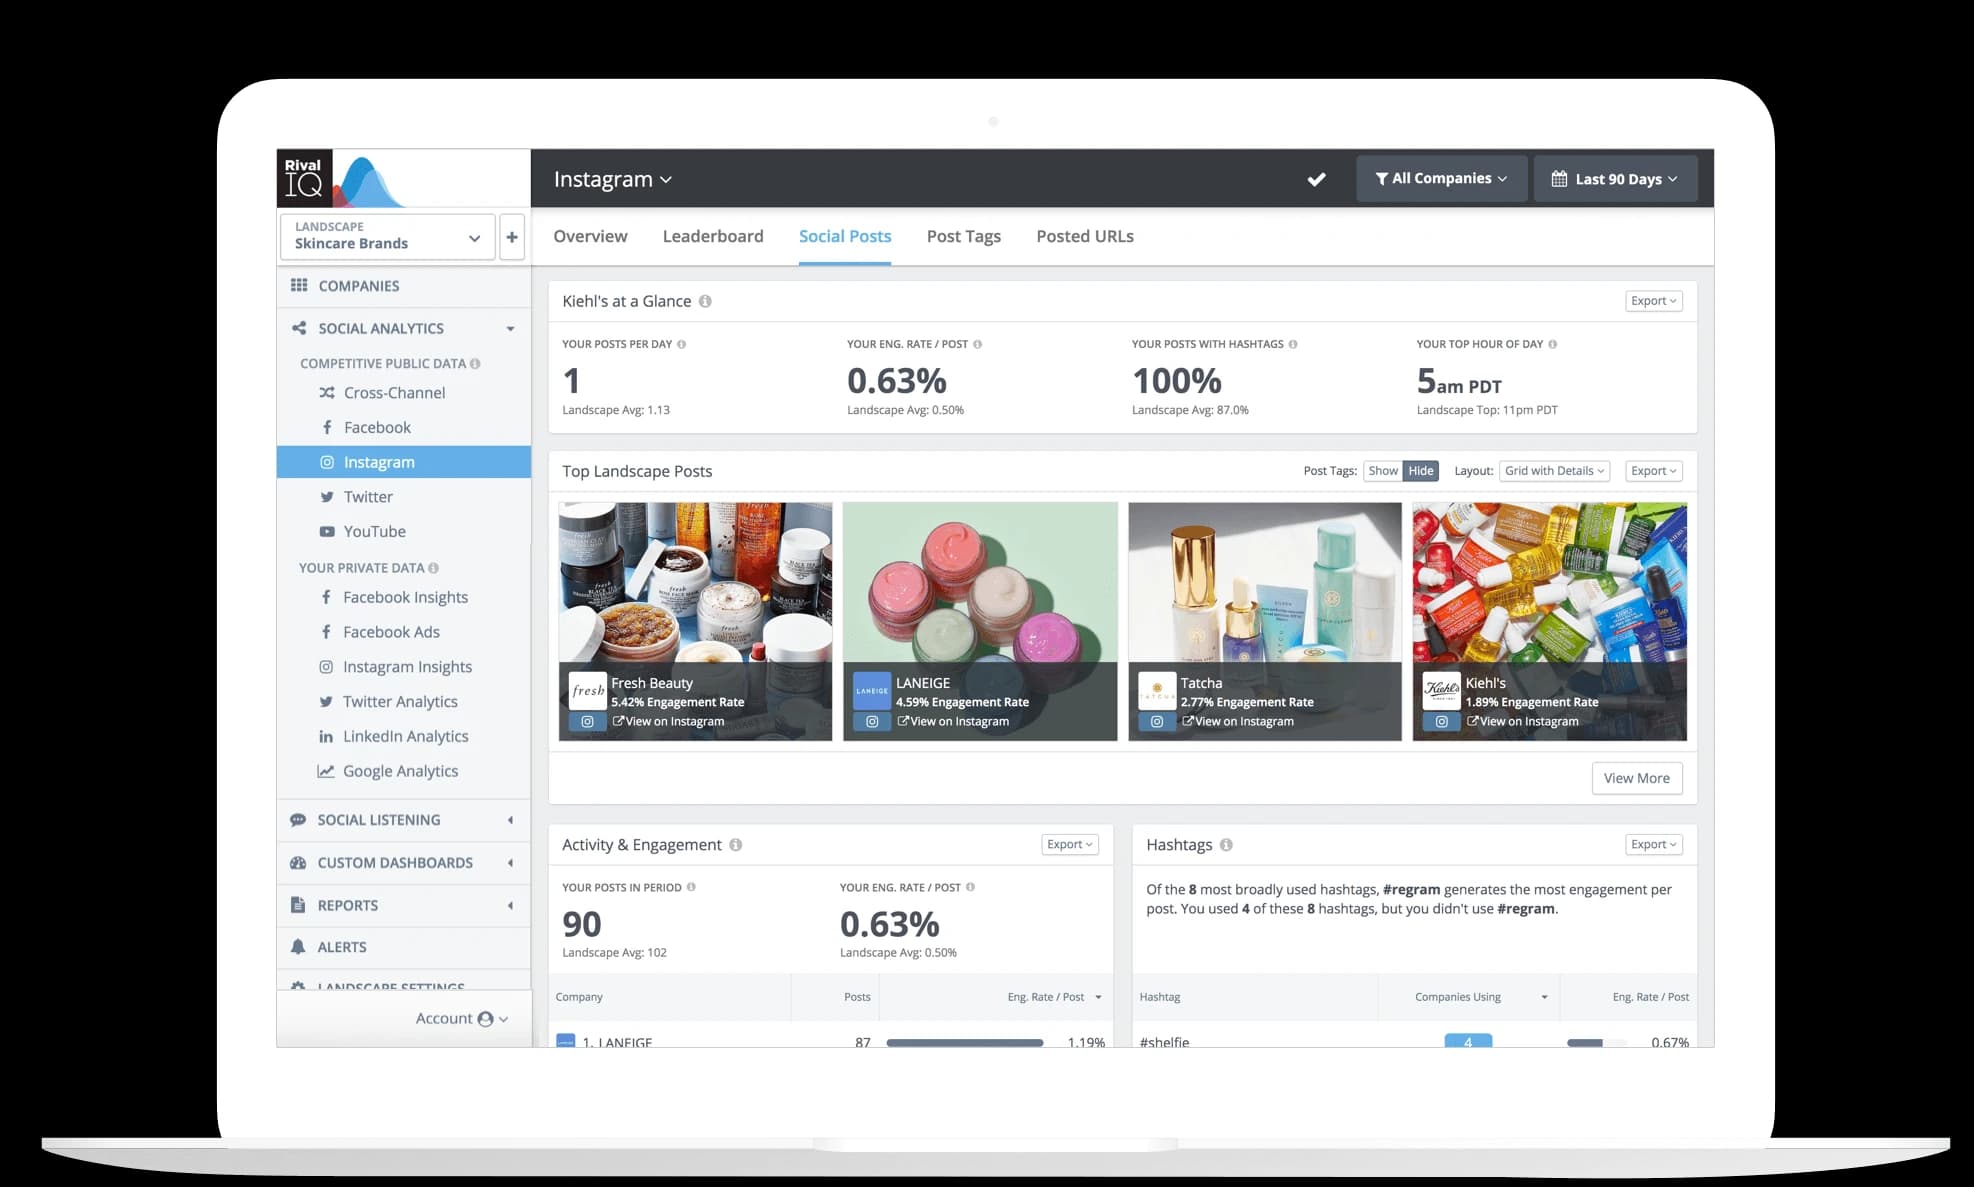
Whether it's figuring out why one post did better than another or deciding if you should boost a post based on what's worked in the past, Rival IQ gives you the insights you need.
This feature allows for a detailed comparison with competitors, showing where you stand regarding engagement, reach, and overall social performance.
With machine learning, Rival IQ identifies when a competitor has boosted a post, providing insights into their strategies that you can learn from or counter in your planning.
Pricing
Drive starts at $199/m/user
Find Your Ideal Facebook Analytics Tool
Picking the right Facebook analytics tool boils down to what you need it for.
Suppose you're a growing agency managing several social media accounts and need something that makes life easier.
Statusbrew is spot on in that case because it helps you create detailed reports across different platforms without much fuss.
For those of you who need to get into brand listening data, Sprout Social bangs on. They’re perfect for anyone managing many client accounts or needing robust tools that play well with other business systems, especially in larger organizations.
It’s all about finding the proper sync between your preferences & the tool’s offerings.
FAQs
How can I get the best time reports for my Facebook pages?
Tools like Sprout Social and Statusbrew have ready templates, and you can create best-time reports in 5 minutes.
Which core KPIs should we track across Pages?
Fans, Fan Growth, Reach, Impressions, Engagements, ER (by reach), Posts, CTR (if links), Response Time, First Response Rate.
Can I share live dashboards with clients securely?
Yes. Statusbrew supports shareable links with controls: lock date range, set time zone, hide tabs, and add an expiry. Thus, you can securely share reports with stakeholders.
What export formats are available?
Mostly, tools support export formats like PDF and CSV.
Can we track team performance (response time, resolved volume) per Page?
Yes. Build a “Team Insights” dashboard filtered by Page and agent to monitor FRT, response rate, and workload.
Can we benchmark against competitors?
Yes. Create competitor sets per market and track engagement rate, posting cadence, and growth alongside your Pages.
Can we backfill historical data when migrating tools?
Yes—typically up to 12 months of historical data can be restored for Facebook Page insights.