
Facebook analytics will stop being accessible after June 30, 2021. What Does this mean for your business?
We're here to help you navigate this change, and with the help of this guide, you'll be able to leverage Facebook's new reporting solutions to grow your business.
So let's get started.
What's Happening With Facebook Analytics
Facebook quietly announced that Facebook analytics is going away at the end of June 2021. Here's what it said in the official business help center post on the same:
"Facebook Analytics won't be available after June 30, 2021. Until then, you can access reports, export charts, and tables, and explore insights."
Facebook didn't give a direct reason for shutting down the analytics, but it did offer a solution for it.
Facebook has recommended users to the following business tools to use after Analytics is removed:
Facebook Business Suite: Offers insights about a business's audience, trends & content (but is not available to everyone).
Ads Manager: View results for Facebook campaigns and ads
Events Manager: Manage Facebook pixel and Conversions APIs. Also reports on actions that are taken on a business's website & app.
We'll take a look at all of these tools in detail.
Facebook Business Suite
Facebook Business Suite simplifies the need for managing presence on Facebook & Instagram.
Facebook Business Suite Insights offer results on organic & paid social media efforts across Facebook & Instagram. It offers metrics, trends & visual reports that help you understand which Facebook page works for you & where you can make improvements. This'll help you optimize the way you spend your time and resources.

Insights offer the below-mentioned type of metrics at the account, platform, and post level.
- Reach (organic vs. paid)
- Engagement
- Impressions
- Likes
- Comments
- Followers
- Audience Demographics
- Ad account's spend
By using these metrics, you can understand which strategies are successful and how to best spend your resources on Facebook.
Facebook Ads Manager
Using the Facebook ads manager, you get insight into all your Facebook ads & Instagram ads. All your ad campaigns are visible on the Facebook ads manager dashboard (even if they aren't active or have been completed).
To access the Facebook ads manage,
- Go to facebook.com/adsmanager
- From the left side pane, click on the nine-dot menu
- Now click on Ads Reporting

Here are the metrics available for your ad campaigns:
-
Results Archived: This includes conversions, leads generated, event response
-
Reach: Total number of people that saw your ads
-
Impression: Total number of times your ads were seen; by whom isn't taken into account
-
Frequency Number of times your ad is seen, on average, by a single user. Frequency lets you know if your campaign is in good health
-
Relevance Score How relevant Facebook believes is your ad for that target audience. Your relevance score will directly affect the cost and placements of your campaigns
-
Clicks: Total number of clicks generated
-
Cost Per Result: How much it costs to generate a result (clicks, app installs, etc.) It's up to you to decide if the cost per result is worth it. If not, you can work optimizing the ad set
-
Amount Spent: Total amount spent running the ad
Customize the reports according to your preference & display the metrics that matter to your business. Once you're done customizing, click on the save button and proceed to export the report by clicking on the download button.
You can export the report in these formats.

Facebook Events Manager
For businesses looking to drive sales on the platform, Facebook's Events Manager is the unsung hero.
If you've added Facebook pixel on your website, the Facebook events manager let's you track these events:
- Page Views
- Purchases
- Leads
- Specific buttons clicked (e.g., Subscribe)
- Add payment info
- Add to cart
- Initiate checkout
When you go to Facebook events manager, you see three tabs: Data Sources, Custom Conversions, and Partner Integrations.
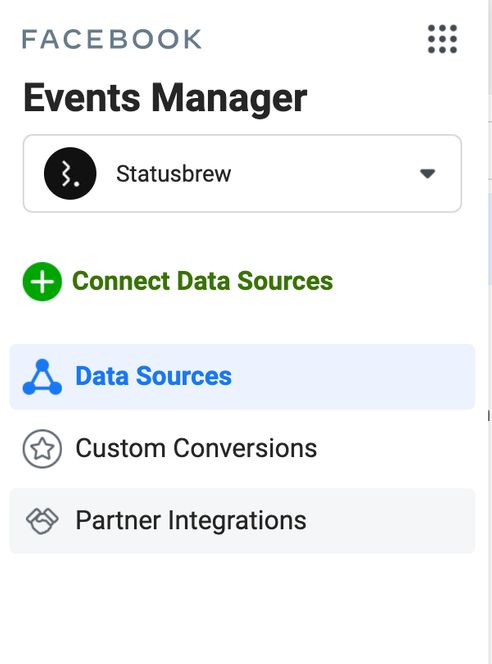
Data Sources
Facebook offers advertisers three different types of Data Sources:
-
Web: Web data sources refer to things that can be automatically tracked with the help of the Facebook pixel. If you have an online business/eCommerce store, it is crucial that you have this data source set up on your website.
-
App: Add data sources that let you track activity within mobile apps that can be connected to your Facebook manager account
-
Offline: This includes things like offline lead generation, in-store sales, or when customer information is gathered from a third-party source.
Custom Conversions
Custom conversions allow you to show and track a custom conversion event on your website. You can define a custom event on your company website to Facebook. For instance, you can create a custom conversion for product sales, leads captured, subscriptions, or scheduling appointments.
Partner Integration
Next up is 'Partner Integrations.'
This includes tools and software that can be used to install, optimize and run Facebook events.
If you own any of these tools, you should investigate how they have integrated with Facebook Events Manager.
Stay On Top Of Your Metrics With Statusbrew's Facebook Reporting
Statusbrew's Facebook Analytics offers insights for activity, engagement, impressions, reach, growth, demographics, and a lot more. The Facebook report provides you with an aggregated analytics of all the Facebook pages in a Statusbrew Organization over the chosen date range.
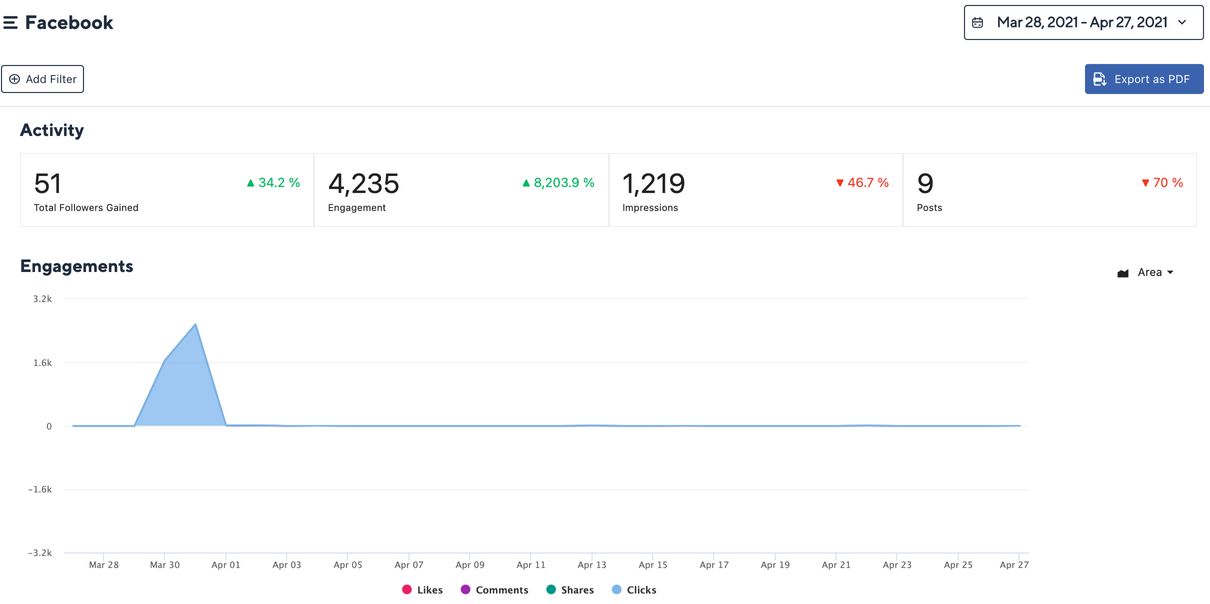
Here are the metrics available in Statusbrew's Facebook report & Facebook Paid Performance reports:
- Activity
- Engagements
- Impressions
- Audience Growth
- Reach
- Posts
- Top Engaged Posts
- Demographics
- Facebook Stats by Channel
- Sentiment Analysis
- Video Views
- Video views Action
- Video Viewed Time
- Campaign Summary
- Paid/Ad Impressions
- Cost Per Impression (CPI)
- Paid/Ad Engagement
- Cost Per Engagement (CPE)
- Clicks
- Cost Per Click (CPC)
- Video Views
- Cost Per View (CPV)
- Mobile App Installs
- Cost Per App Install (CPA)
- Conversion
- Cost Per Conversion (CPCon)
These metrics allow you to calculate your team's performance, discover opportunities to manage the team's workflow better, and allocate proper resources for unparalleled social care.
Try out Statusbrew for your business, sign up right now & start your free trial.
Additionally, you can also get a breakdown of your ad content by:
- Ad Account
- Campaign
- Channel
You can customize the reports as per your preference and even add your company logo. Facebook Reports in Statusbrew can be exported in the form of PDF.
Lastly, we'd like to know how you measure the performance of your Facebook pages. Do let us know in the comment section down below.


Explore the Statusbrew range of social media tools
Cancel anytime!