
With constant innovation and growth, Twitter has become a gold mine for businesses to build opportunities, grow brand and drive business revenue.
With more and more businesses inclined towards Twitter, it has become an avenue for businesses to generate leads. It's challenging to stand visible among the noise. At this point, Twitter analytics becomes your savior, as it offers you the insights to optimize your marketing strategy and get the desired results.
Tracking Twitter analytics is crucial for your business's social media growth. It provides you data on audience engagement, content performance, followers growth, and whether your brand's Twitter strategy effectively works.
Are you not tracking Twitter analytics? You are missing the insights that can define your strategy and maximize ROI.
Not sure where to start? In this guide, we have encased how to use Twitter analytics and track metrics. Drill deep into the blog, get ideas on leveraging Twitter analytics to improve your brand's Twitter strategy.
- What Is Twitter Analytics?
- Advantages Of Tracking Twitter Analytics
- Key Metrics To Track With Twitter Analytics
- How Can Statusbrew Help You In Twitter Analytics
- How To Convert Twitter Analytics Into Brand Growth
What Is Twitter Analytics?
Twitter analytics can be defined as a platform built for data tracking on Twitter. It displays the insights specific to your Twitter account, and you can also leverage data on the activities of your Twitter account. Twitter analytics is similar to Instagram, Facebook analytics, or Google analytics. Graphs and reports are used here to display the essential metrics.
You can track key metrics such as followers growth, engagement rate, top tweets, impression, and more with Twitter analytics. The tool has been available since 2014 for all Twitter accounts, both business and personal Twitter account users.
Businesses can get a monthly Twitter report card where an easy-to-understand summary shows the Tweet impressions, mentions, profile visits, top follower, top tweet, and top follower. Using this tool, you can make a data-driven decision and improve your social media strategy.
Armed with the insights, you can optimize your Twitter strategy to drive the best results. You can gain followers, resulting in more lead generation opportunities and business revenue growth.
Following are the dashboard and metrics available through Twitter Analytics in a nutshell. Let have a look:
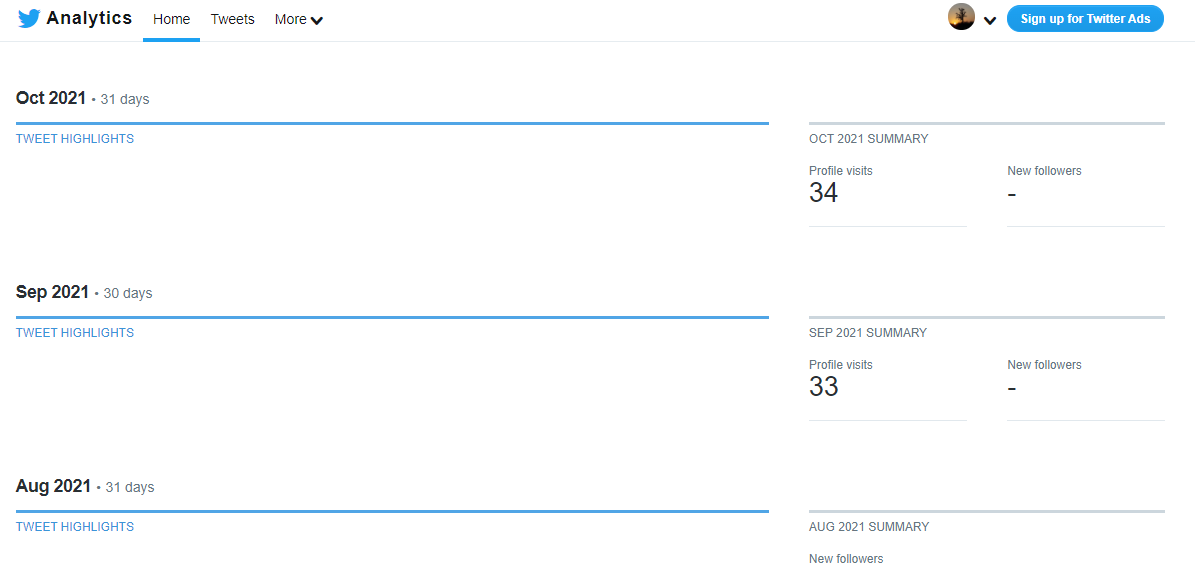
1. Analytics Dashboard
The Twitter analytics dashboard is the first thing you encounter after opening the analytics. You can get a snapshot of key metrics here named Twitter highlights for each month. The metrics include top Tweet, mention, and your account's top follower. After that, you get the summary of the additional insights for the month, such as the number of tweets you sent, number of visits your Twitter profile got, number of mentions your account received, total number of new followers you gained, and your tweet impressions.
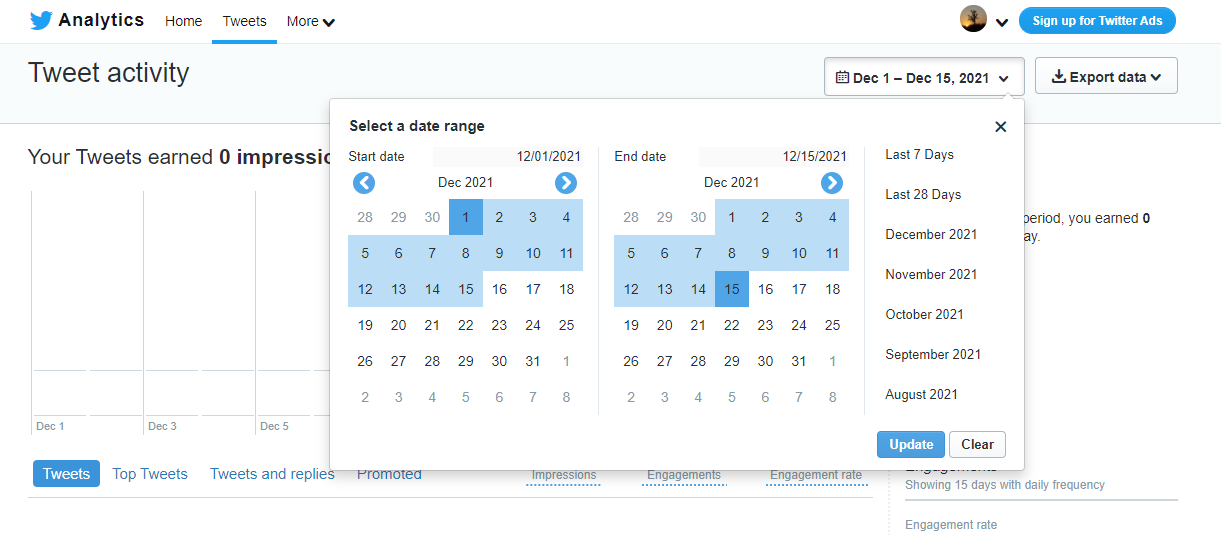
2. Activity Dashboard
In the Tweet activity dashboard, you can track your brand's performance insights over a specific time. The graph offers you a breakdown of impressions day by day over the last 28 days. You also can choose a time frame from the calendar date range button. In this section, you can find daily Twitter insights such as Impressions, Engagements, Engagement rate.
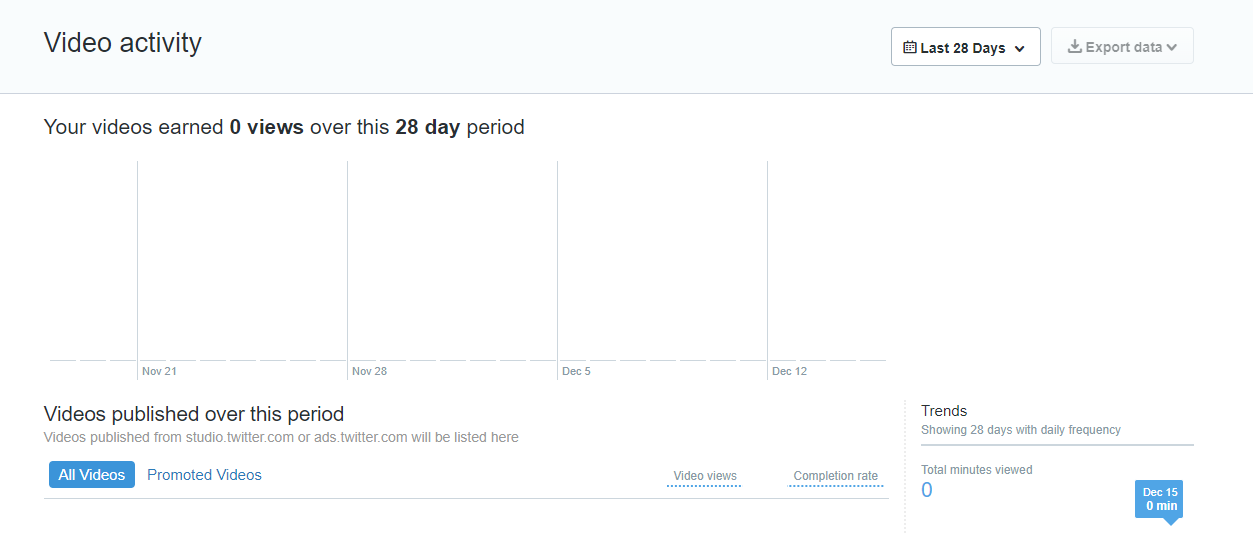
3. Video Activity Dashboard
You can find this dashboard by navigating to 'More' in the menu. Now select 'Videos' from the dropdown. Video activity dashboard offers you the metrics for the videos you have published using Twitter Media Studio and Twitter Ads. The essential metrics you can assess here: total number of video views, video completion rate, total minutes of video viewed, video retention.
4. Conversion Tracking Dashboard
You can learn how your brand's Twitter advertising spends converts into action on the Twitter conversion tracking pages, such as installs, sign-ups, or purchases. You can set a website tag that allows your brand to access website conversion tracking analytics.
![]()
Twitter also offers a personalized Business Insights page. You can find it on Twitter for the Business section under Advertising and then navigate to Analytics.
Suggested Read: How To Master Twitter Algorithm
Advantages Of Tracking Twitter Analytics
Most of the powerful social platforms come with in-built analytics, including Twitter. Twitter analytics helps you monitor and track metrics like engagement rate, follower gain or loss, retweets, impressions, etc.
The analytics tool helps you to make a decision based on data. With the data in hand, you can make better decisions for your social media campaigns to get desired results. Twitter analytics offers you several benefits. Here we have mentioned the the significant benefits you can get from Twitter analytics:
Know What Your Audience Wants
With Twitter analytics, you can get insight into what type of content is performing best for you. It will tell you where and what your followers engage and respond to. Is it regular text posts, photos, videos, polls, GIFs, or everything? It will also let you know which days your posts are performing well and on which days it is not.
Without the data provided by the analytics tool, you can't be sure of what type of content is working for you and what is not.
Track Your Growth Easily
It isn't easy to measure your growth without data, and using spreadsheets doesn't make your life easy either. However, Twitter analytics will do all the maths for you to concentrate on data rather than calculations. You can easily track your follower growth per month and view the growth trend over a period.
Twitter analytics also helps you know what type of content helped you to acquire new followers and what type of content is turning them away.
Understand the basics of a successful social media profile/page and turn them into a weapon of itself!https://t.co/RJkYVcsCOa
— Statusbrew - Social Media Management Tool (@Statusbrew) December 13, 2021
Key Metrics To Track With Twitter Analytics
To make your life easier and not to get duped when looking at the Twitter analytics dashboard, we have listed down all the key metrics that you can track with Twitter analytics:
1. Top Tweet
It is the best performing tweet with the maximum number of engagements or impressions over a period of time. You should track your top tweets because it helps you know which of your tweets have been performing well and if there is any pattern or trend that you can draw. This metric helps you assess what type of content is relevant to your audience.
When you find out the tweet that is performing the best, you want to consider promoting it. If you are spending money on boosting your posts, you may want to upgrade to the best-performing content.
2. Tweets
On the Homepage of your Twitter analytics dashboard, you can see how many tweets you have published in a month. The data will help you keep track of your daily or monthly content publishing goals.
3. Followers
This Twitter analytics enables you to track the number of followers you have gained or lost over a period of time. You can also track your current follower count.
Tracking follower growth is excellent. However, it is best to track the metrics that directly impact your business, like your post engagements and clicks. It doesn't do any good for your business if you have a larger follower count yet low on engagement and interactions on your posts.
4. Profile Visits
Twitter analytics provides you the data about the number of profile visits on your account over a period of time. It is the number of people who visited your Twitter profile and feed.
Tracking this metric will let you know if people are taking a further step to know more about you and to find out whether your Twitter profile is worth following or not rather than just interacting with one or a few of your posts.
5. Top Follower
This metric lets you know about the Twitter account having the most significant number of followers that followed you in a month. Tracking this metric will let you know about your new followers with high reach and influencing potential. You can use this metric to thank your new follower with a mention in one of your posts. This new top follower can be a good contender for forthcoming influencer drives.
6. Top Mentions
This Twitter analytics metric tells you about the tweets that have mentioned your Twitter account and have also received the greatest number of engagements. This metric also covers other profiles' tweets that have mentioned you in their posts.
You should keep track of this metric because you can engage with the Tweet performing the best which has been mentioned you. Engaging with such tweets, irrespective of negative or positive, will increase your brand's visibility among that account's followers.
7. Impressions
It is a essential metric to keep track of. Impressions determine the number of times your Tweet has been seen by other Twitter users organically over a certain period. It also includes retweets and quotes tweets. You can measure the impression at both the overall account level and specific Tweet level.
With impressions, you can determine how popular a Tweet can be. However, with this metric, you can't get the number of unique accounts that saw your Tweet. It tells you about the tweets that have reached multiple feeds. This metric is essential and widely used to determine brand awareness.
Impressions metric is a way to measure your reach, letting you know which of your contents are grabbing your audience's attention.
8. Hashtag Analytics
Twitter Hashtag analytics helps you track the number of views your Tweet received. This matric matters because it lets you assess how many people have viewed your content. Amalgamation with the engagement gives you the engagement rate for each tweet and your overall account. Hashtags are sometimes a primary factor for getting solid impressions. Track the metrics and play around to know which hashtag works best for you.
9. Engagements
This metric helps you measure the number of interactions taken place with any one of your Tweet. Similar to impressions, this metric can also be viewed at both overall account level and individual Tweet level. Engagement on a Tweet includes all possible ways of interaction such as likes, media expands, replies follows from a Tweet, retweet, link clicks, and many more.
The reason behind tracking this metric is that when someone stops interacting with your tweet for a brief amount of time, your Tweet has gained their interest and they have found something interesting about it. Keeping track of your engagements will help you to know which tweets are performing for your brand. This metric is usually used to measure your performance against community engagement and brand engagement goals.
10. Link Click
Link Click measures the number of times people have clicked on a link inside your Tweet. It helps you to track if your audience finds the links you are posting engaging. This metric can also be measured at the tweet level and overall account level.
11. Engagement Rate
It is the rate at which your audience is interacting with your tweets. Engagement rate can easily be determined by dividing your total Twitter engagements by your total impressions.
This metric is helpful to determine how your overall Twitter account is performing rather than only determining engagement or impressions. A high engagement rate means the Tweet initiated a conversation. However, a low engagement rate does not mean that your tweet performed poorly. If it has got deep impressions and low engagement rate, the content is worth sharing, and it doesn't require anyone to comment on it.
It plays a vital role in driving traffic to your website directly from Twitter. You can analyze the tweets that receive the highest engagement rates and determine the reason for their success, such as hashtags, video, caption, question, etc.
12. Cost Per Result (CPR)
This metric is useful when you have availed of the services of Twitter advertising. It determines the average cost of every appropriate action a user takes on your Twitter ads.
Whenever you are running an ad on Twitter, it is necessary to determine what metrics outline an ad campaign's success. You can also track metrics like impressions, engagement rate, results, etc., for your ad campaign on Twitter.
How Can Statusbrew Help You In Twitter Analytics
Statusbrew helps you seize your Twitter audience's potential to drive more business. With Statusbrew's built-in features such as brand keywords and hashtags insights, you can boost your Twitter efforts. It's all-new Reports Lab offers you in-depth insights into your Twitter profiles and your team performance to execute impactful strategies and to visualize success.
The Reports Lab allows you to measure data the way you want. You can avail endless customization using the widget and exports and share reports with your team and clients. Reports can be shared in PDF form as well.
Statusbrew Twitter Report provides you with aggregated analytics of all the Twitter profiles in a Statusbrew Organization based on your chosen date. Before going deep into the data, you can get through the Statusbrew Reports Lab.
Get Free Access To Reports Lab
Key Metrics You Can Track
Activity
This widget summarizes your key statistics across all Twitter profiles in your organization. You get the in-depth data on total followers gained, the total number of engagements for Twitter profiles, and post details such as the total number of tweets excluding replies.
Engagement
The engagement widget aids you in visualizing your audience engaging with your content across Twitter profiles. You can get the percentage of change compared to the corresponding previous period. You can get the aggregated number of Likes, Comments, Retweets, and Clicks you received on your tweets during the reporting period.
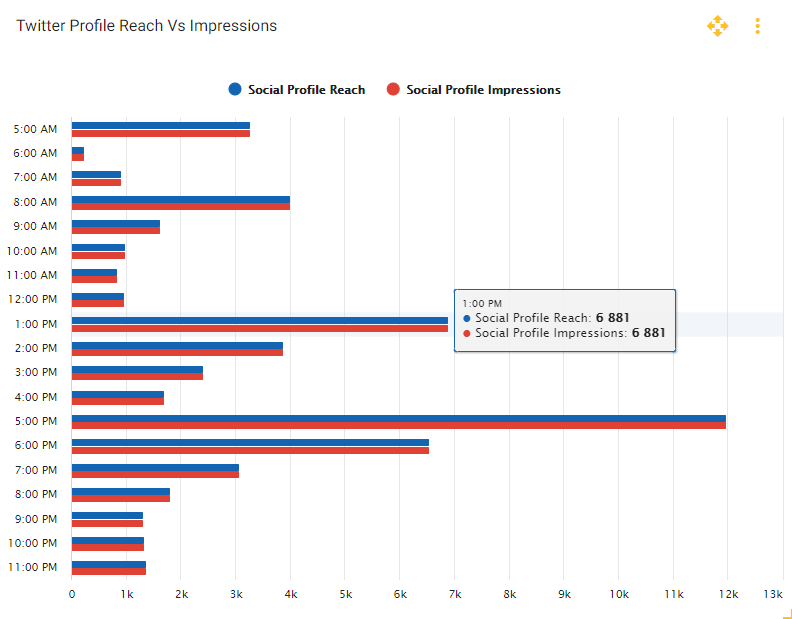
Impression
You can track the data to get the number of times your content is displayed to the user and get insights on the changed percentage over a period. Note that it offers only organically achiever impressions.
Audience Growth
This widget breaks down your followers gained, lost, and net growth for Twitter across all days. Here you can get New Followers, New Unfollowers, Total Audience Growth.
Statusbrew's Twitter Analytics further offers post analytics where you can get the number of outbound tweets, excluding replies, along with change percentage over the corresponding period.
-
The total engaged posts provides you with tweets with maximum engagement, which you have posted during the selected date range. You also can get insight into the likes, retweets, comments, and clicks on your most engaged tweets.
-
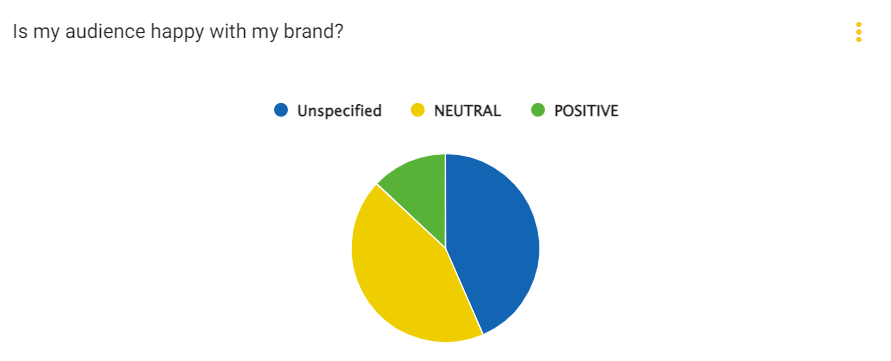
The reporting tool offers you the track of the sentiment on incoming DMs and mentions grouped by positive, neutral, or negative emotions. You can assess your followers' perspectives and opinions towards your marketing campaigns and accordingly can adjust your approach if required. And analyze your customer's views towards your marketing campaigns on Twitter.
- Statusbrew also allows users to compare Twitter profiles; you can quickly compare Twitter followers and follows and leverage quantifiable engagement metrics to get a wholesome view of your Twitter profile.
How To Convert Twitter Analytics Into Brand Growth
Diversify Your Twitter Presence
If you have a different product line or your brand is located in other regions, having multiple Twitter accounts is a strategic choice to grow your business. Evaluating profiles' performance is crucial; you also shall measure the profiles' aggregated performance.
Here Twitter analytics tools such as Statusbrew come in handy. In Twitter natively you can analyze one profile at a time; Statusbrew allows you to group different profiles and track overall Twitter performance.
Identify Top Performing Content
While preparing a Twitter strategy, pinpoint best-performing tweets and assess the success patterns. By tracking impressions, engagement, and interactions, you can get clarity on the type of content that can draw followers' attention. And based on that content, you can create a blueprint for future content plans to gain success.
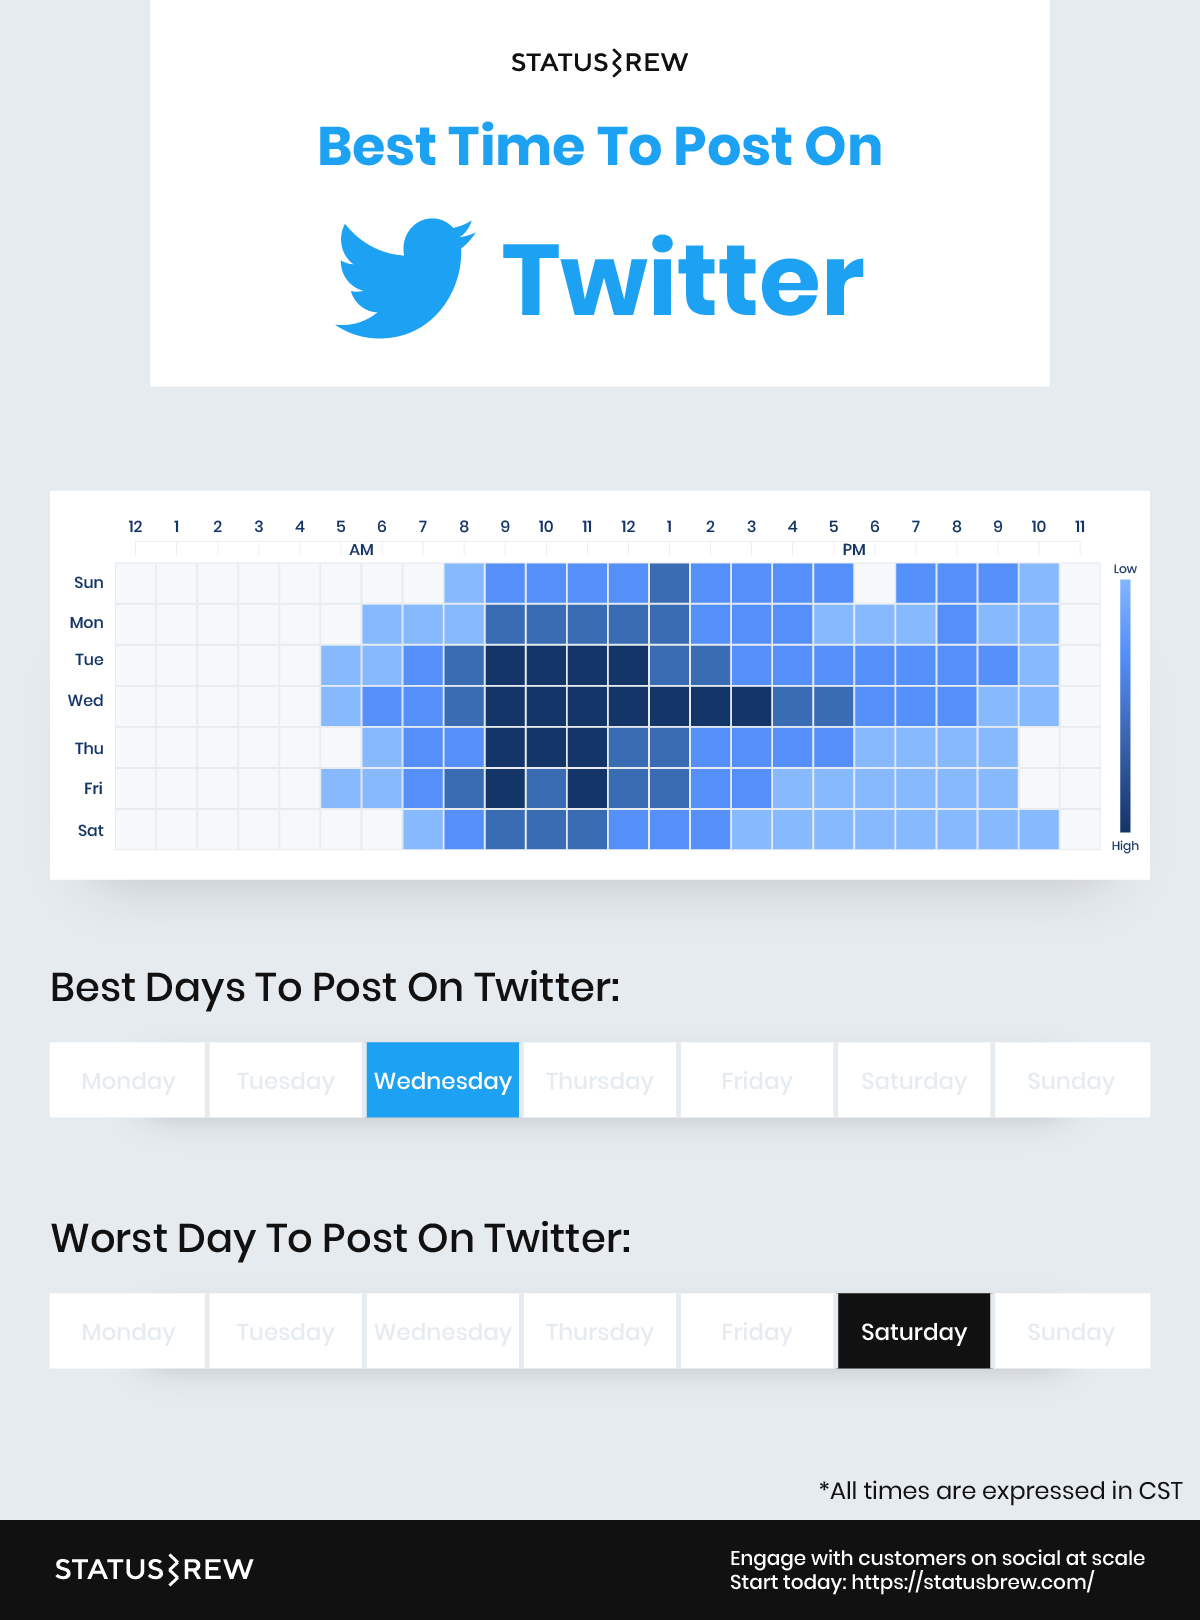
The Best Time To Tweet
Twitter is a platform that focuses on short, real-time information sharing. Hence you must identify the best times to post on Twitter. While with Twitter native analytics, you can avail the engagement rates on specific days. To get precise data, including the breakdowns per hour or day, Statusbrew can be your helping hand.
Tailor Content For Audience
Assessing the audience is one of the significant parameters of the brands' success. You can leverage Twitter ad managers to get brevity on your audience's age, gender, location, household income, and even buying styles. Take this information as a base to craft tweets that can directly communicate to your Twitter ideal audience.
Measure Impact
It is wise to take your Twitter performance in a broader social context to assess the bigger picture. Compare the results across all social platforms to identify the gap. It also helps make more informed decisions for a twitter strategy and deliver a more consistent experience to your audience. You can pull the analytics of your other social media platforms such as Facebook, Instagram from tools like Statusbrew.
Assess Your Twitter Spend
While you engage in Tweet promotion to attract more audience, ensure that money is invested well. It is always advisable to develop a social media budget to do this. Track all your Twitter data before preparing the budget, and let it guide you to invest in deciding on tweets to get the most out of every penny spent.
Suggested Read: How To Create A Social Media Budget For Your Business In 2022
Wrapping Up!!
Analytics helps businesses to thrive in the rapidly evolving social media landscape. You can monitor the market and swiftly adapt to your customer's ever-changing needs by monitoring Twitter analytics.
Tracking the Twitter metrics helps you get resources to level up your Twitter game. When you leverage accurately collected, organized, and analyzed, you can turn this data into a valuable strategic asset.
Twitter's native analytics is an excellent place to accumulate data, but Statusbrew offers you deeper data into your Twitter profile, along with providing insight on other social networks.
Want to know more about Statusbrew Twitter Analytics? Explore Statusbrew Today!
Statusbrew is a unified Social Media Management tool that supports Facebook, Instagram, Twitter, YouTube, Linkedin, Pinterest and even Google Business!


Explore the Statusbrew range of social media tools
Cancel anytime!