
With a total of over 3.8 billion users, social media has its popularity growing. Brands are spending a lot of time on Social media.
With more people online than ever before, brands are learning that using social listening can help them understand consumers more and see trends as they emerge.
Being aware of social media benchmarks helps you understand how your content strategy engages with your audience, and if not, benchmarking can direct you to areas where there is room for improvement.
Here are some social media benchmarks to keep up with the continuously evolving social media space.
Facebook Benchmarks
If Facebook were a country in 2021, it would be the highest populated. With 2.74 billion monthly active users as of January 2021, Facebook is the biggest social media network worldwide.
Activity (Posts)
-
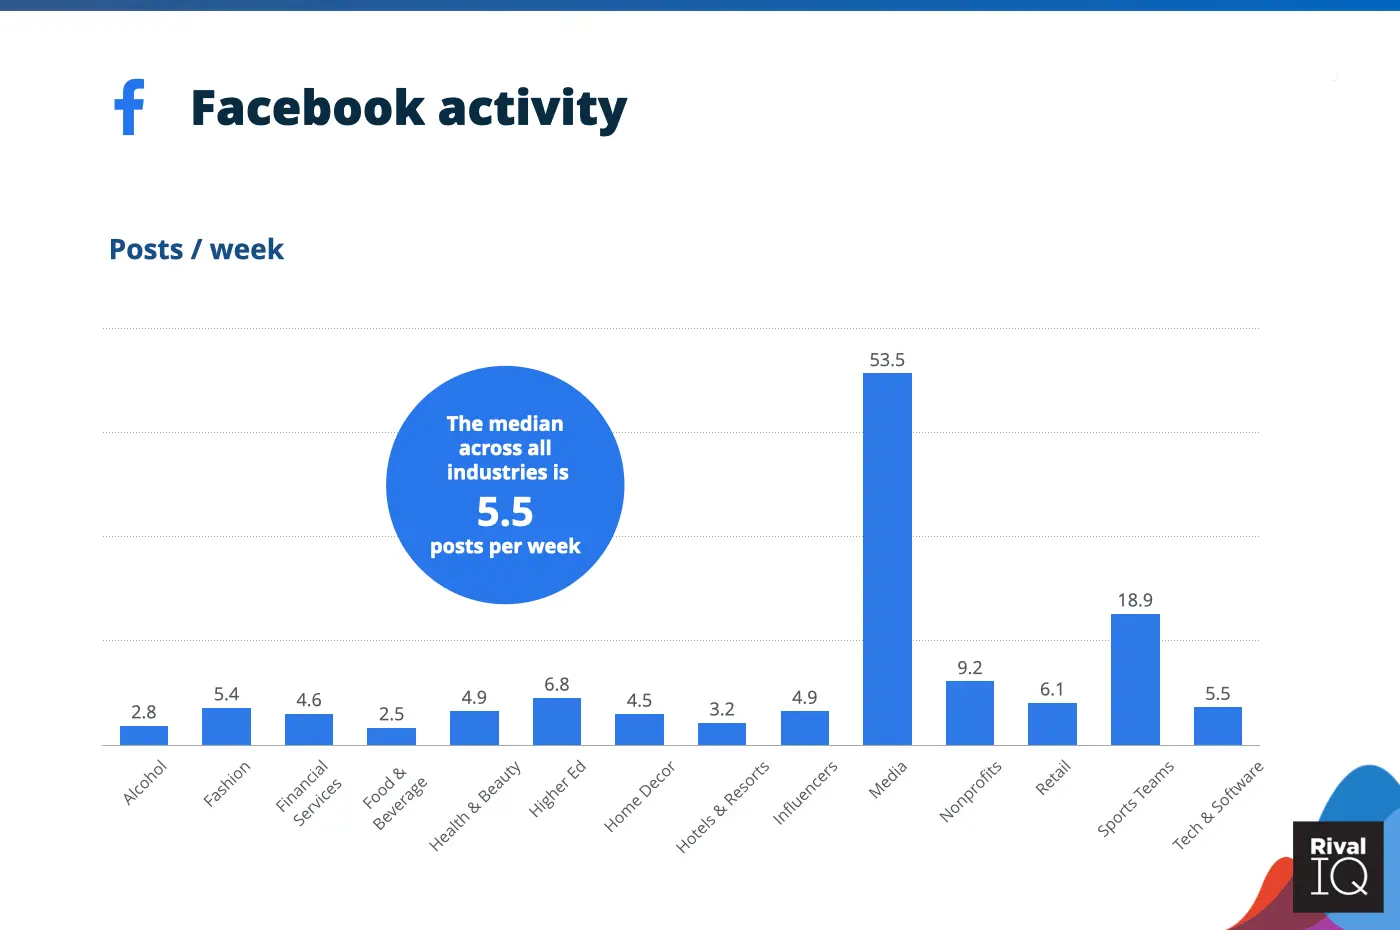
Brands publish an average of 7.5 Facebook posts per day
-
More frequently publishing industries on Facebook per week were Media (53.5), Sports Teams (18.9), and Nonprofits (9.2)
-
Less frequently publishing industries included Food & Beverages (2.5), Alcohol (2.8), and Hotels & Resorts (3.2)
-
This brings the median to 5.5 posts per week
Source: <a href="https://www.rivaliq.com/blog/social-media-industry-benchmark-report/" target="_blank">RivalIQ</a>
Engagement Rate
-
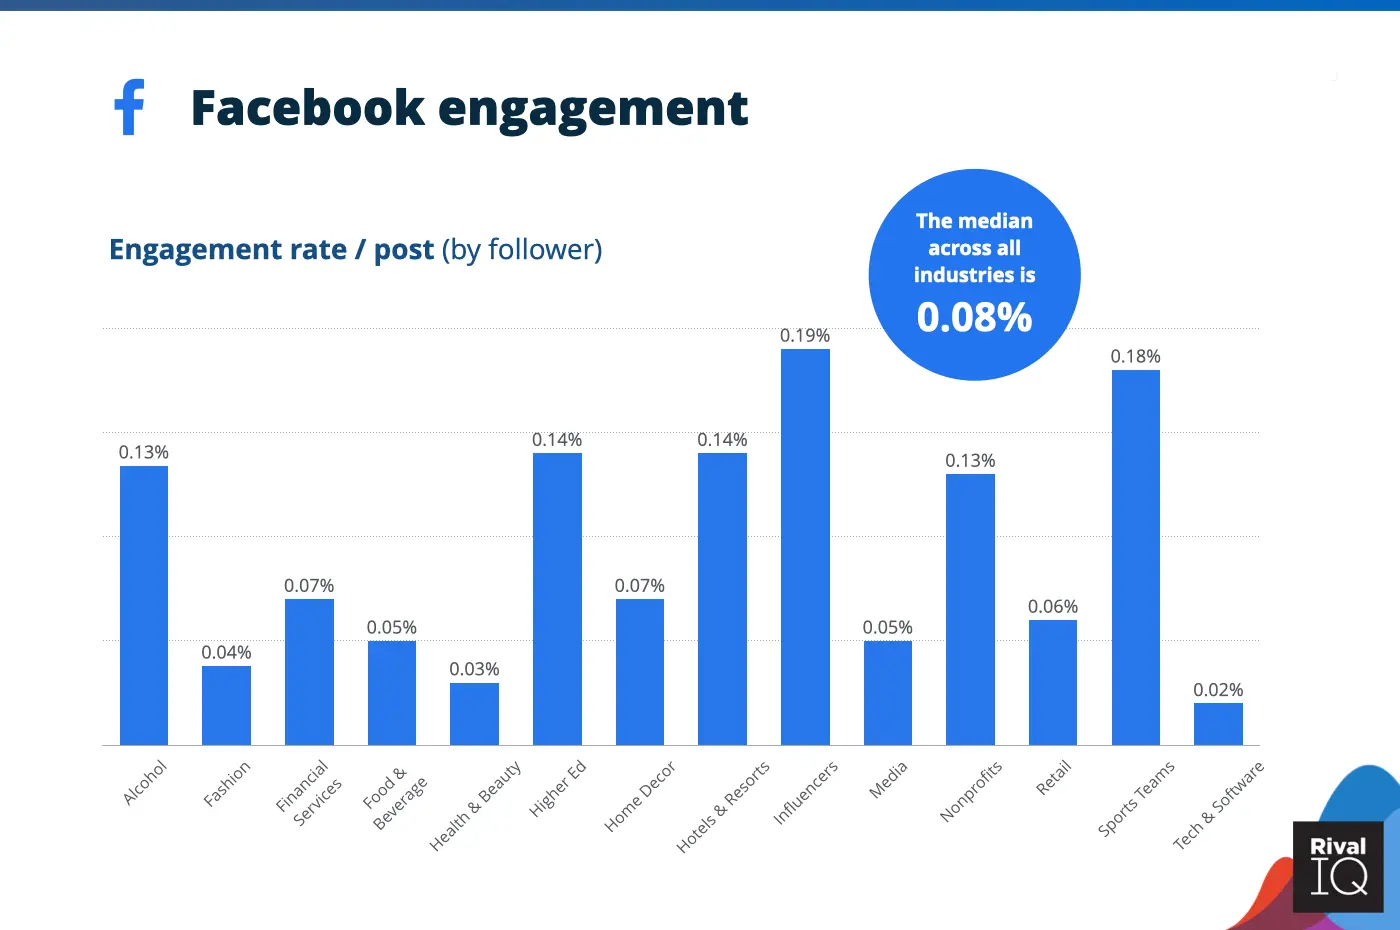
The highest engagement rate across all industries is 0.19% (Influencers). The median across all-industry is 0.08%
-
Influencers (0.19%), Sports Teams (0.18%), and Hotels & Resorts (0.14%) had the highest engagement rate. Tech & Software (0.02%), Health & Beauty (0.03%), and Fashion (0.04%), followed by Media (0.05%), had the least engagement rate
-
It has to be noted here that the number of posts sent has no direct relation to the engagement rate. Content is what attracts your audience the most
Source: <a href="https://www.rivaliq.com/blog/social-media-industry-benchmark-report/" target="_blank">RivalIQ</a>
Click-Through Rate (CTR)
- The highest CTR for Facebook is 1.61%, while the average being 0.9%
Cost Per Click (CPC)
-
The cheapest clicks on Facebook are for the Apparel industry ($0.45 per click), while the average CPC is $1.72
-
The highest CPCs on Facebook at $3.77 are from Financial Advertisers
Conversion Rate (CVR)
- The fitness industry has the highest CVR of 14.5%, while the average is 9.21%
Instagram Benchmarks
Instagram being one of the fastest growing networks, has a user base of 1.2 billion monthly active users.
Activity (Posts)
-
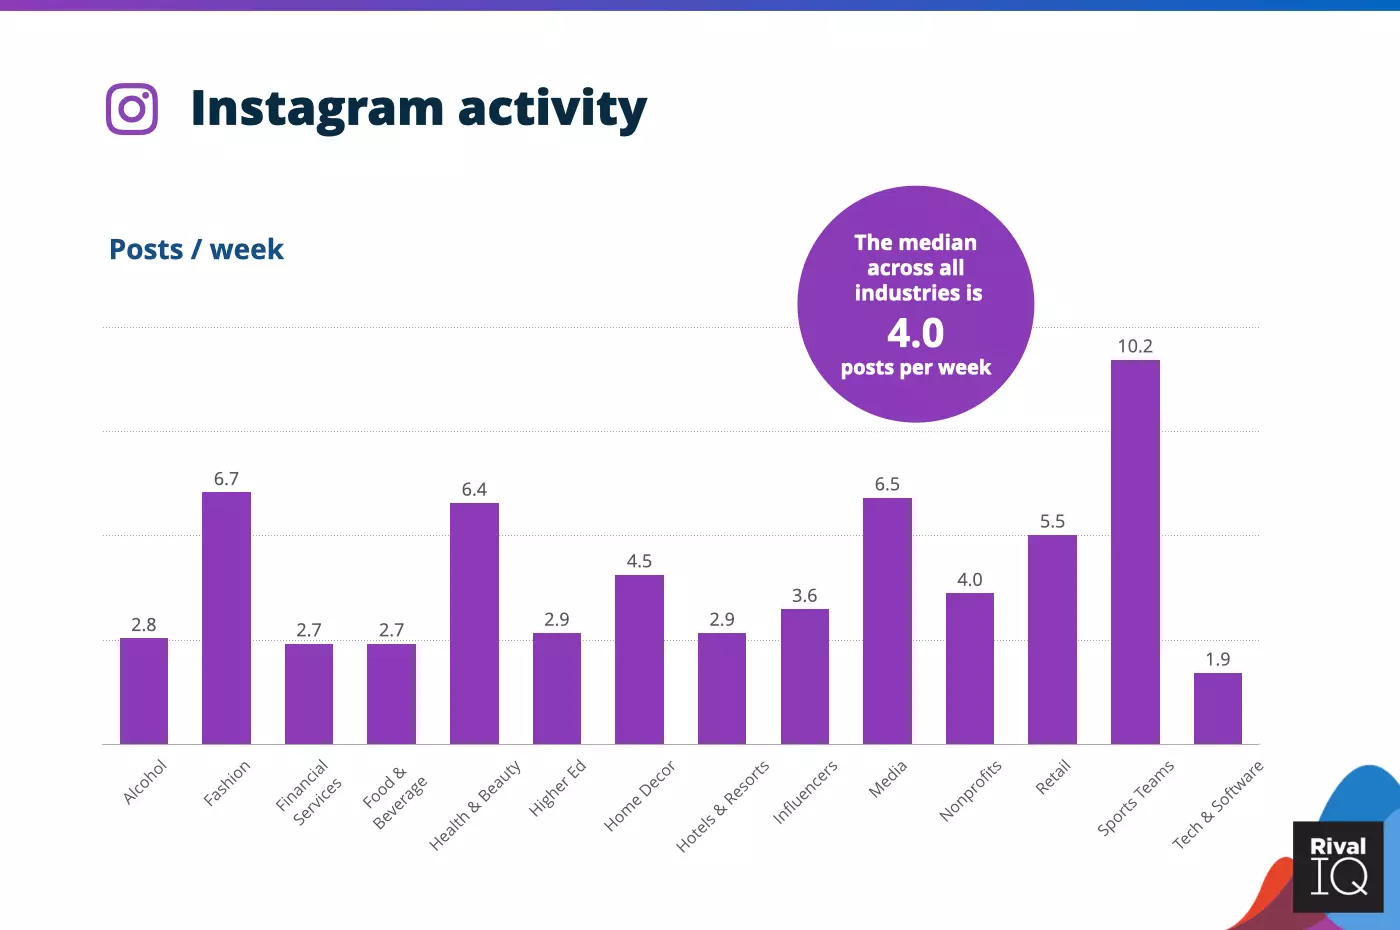
On average, across all-industry brands publish 4-4.5 posts per week
-
Similar to Facebook, industries like Sports Teams (10.2), Fashion (6.7), and Media (6.5) have the highest number of posts per week. Tech & Software (1.9), Financial Services (2.7), and Food & Beverages (2.7) have the least number of posts every week
Source: <a href="https://www.rivaliq.com/blog/social-media-industry-benchmark-report/" target="_blank">RivalIQ</a>
Engagement Rate
-
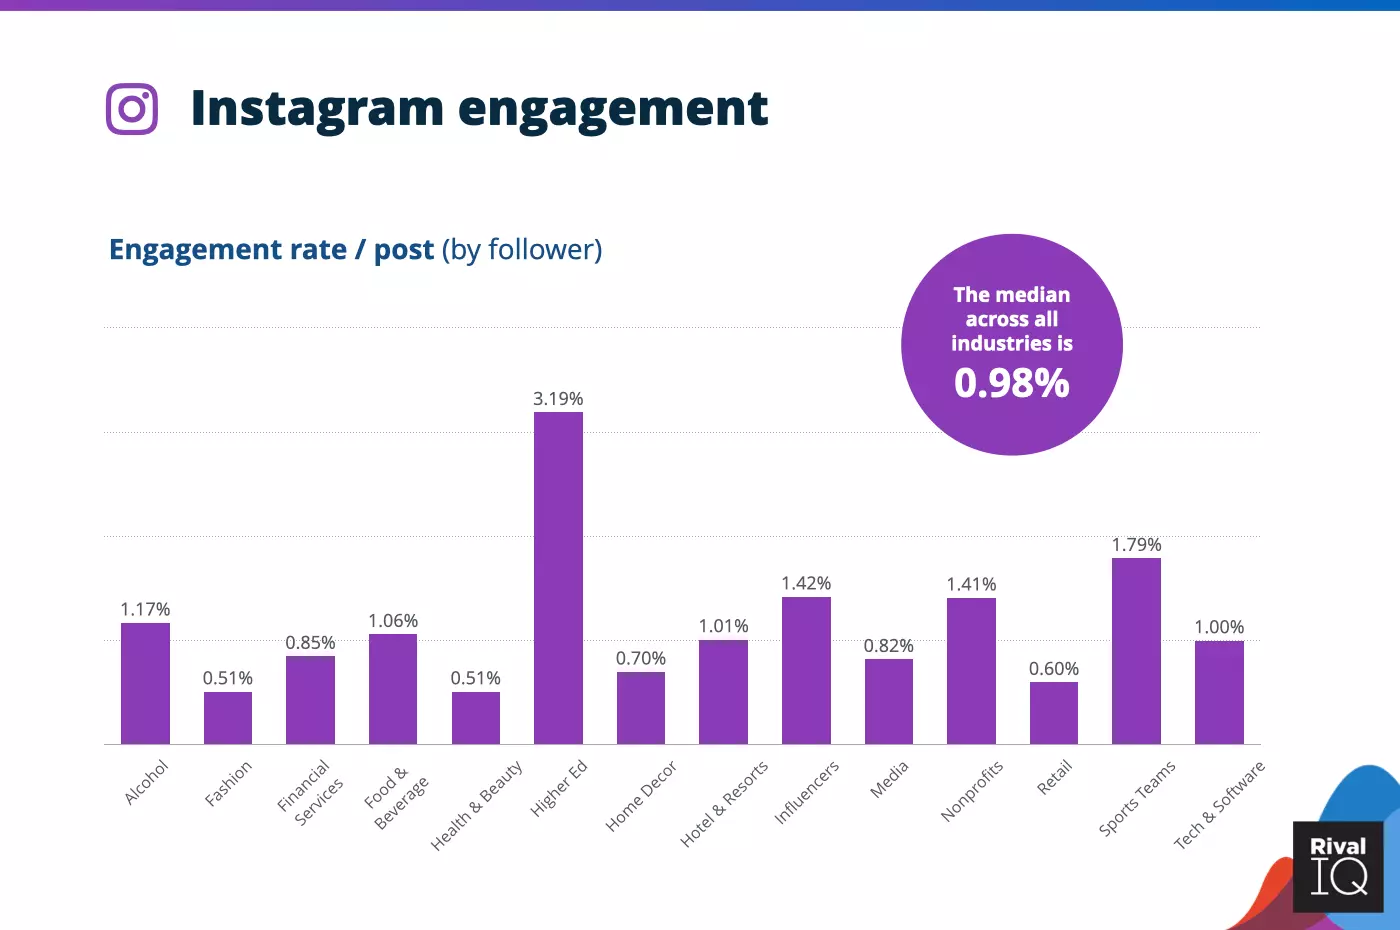
The median across all industries is 0.98%. The highest engagement rate for the Instagram is 3.19%. As a brand on Instagram, you should aim to achieve an engagement rate of 3.19%, but if you are doing over 0.98%, you are doing above average
-
Industries like Higher Education (3.19%), Sports Team (1.79%), and Influencers (1.42%) have the highest engagement rate on Instagram, while Health & Beauty (0.51%), Fashion (0.51%), and Retail (0.60%) have the least engagement on Instagram
Source: <a href="https://www.rivaliq.com/blog/social-media-industry-benchmark-report/" target="_blank">RivalIQ</a>
Click-Through Rate
- Instagram has a CTR of 0.88%
Cost Per Click
- Instagram at $0.67 has lower CPC than Facebook
Twitter has more than 1.3 billion accounts and 353 million monthly active users are using it. It is the third-most-popular social media network with marketers, with 59% of marketers actively using the platform.
Activity (Posts)
-
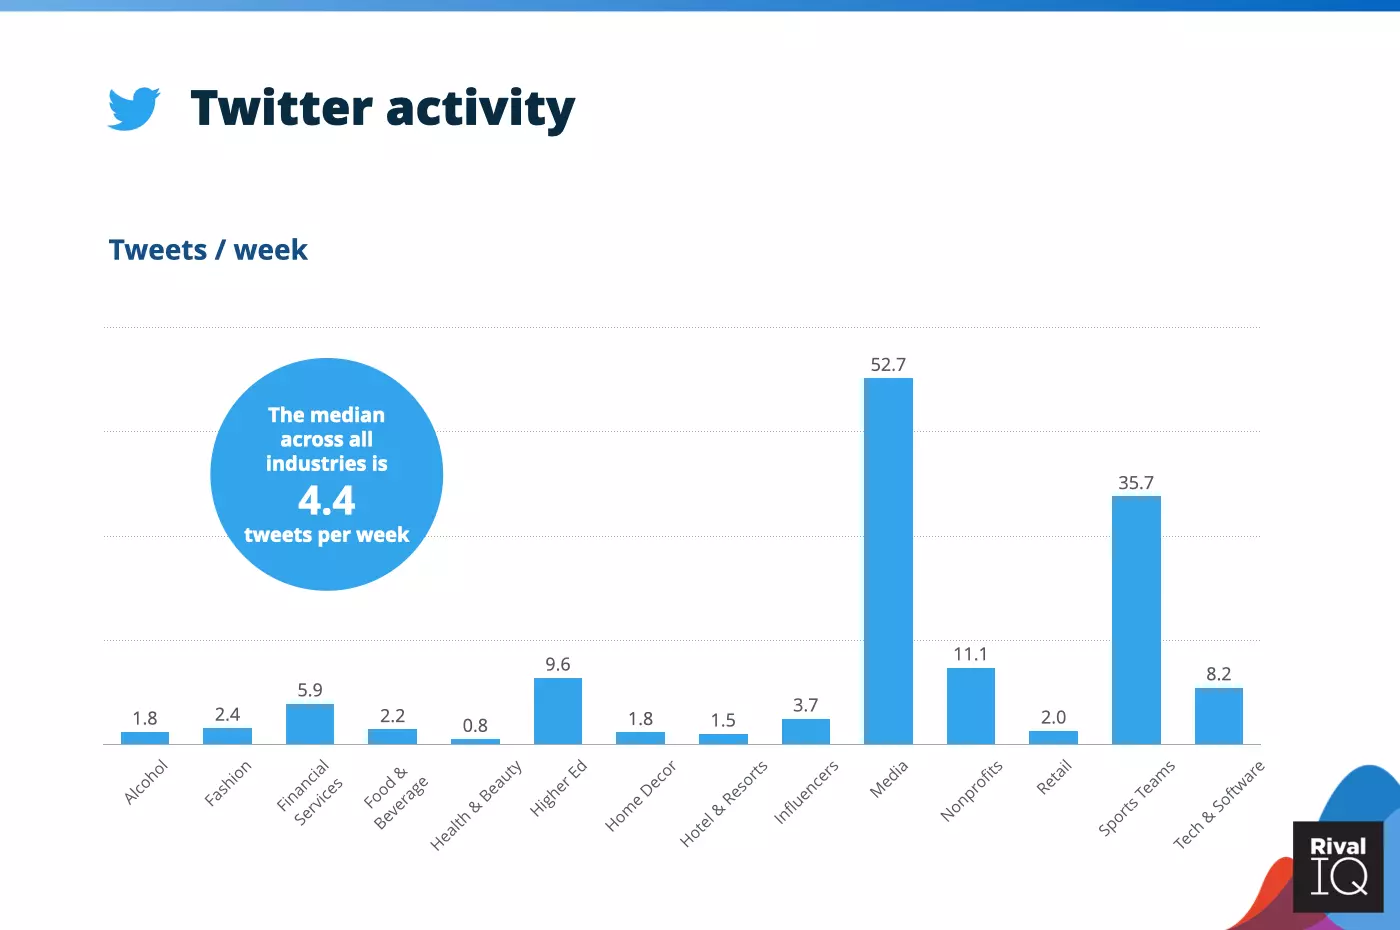
The highest is 52.7 tweets per week, which means 7.5 tweets per day
-
The median across all industries for tweeting on Twitter is 4.4 tweets per week.
Industries like Media (52.7), Sports Team (35.7), and Nonprofits (11.1) have the highest number of tweets per week. While Health & Beauty (0.8), Hotels & Resorts (1.5), and Home Décor (1.8) have the least number of tweets per week
Source: <a href="https://www.rivaliq.com/blog/social-media-industry-benchmark-report/" target="_blank">RivalIQ</a>
Engagement Rate
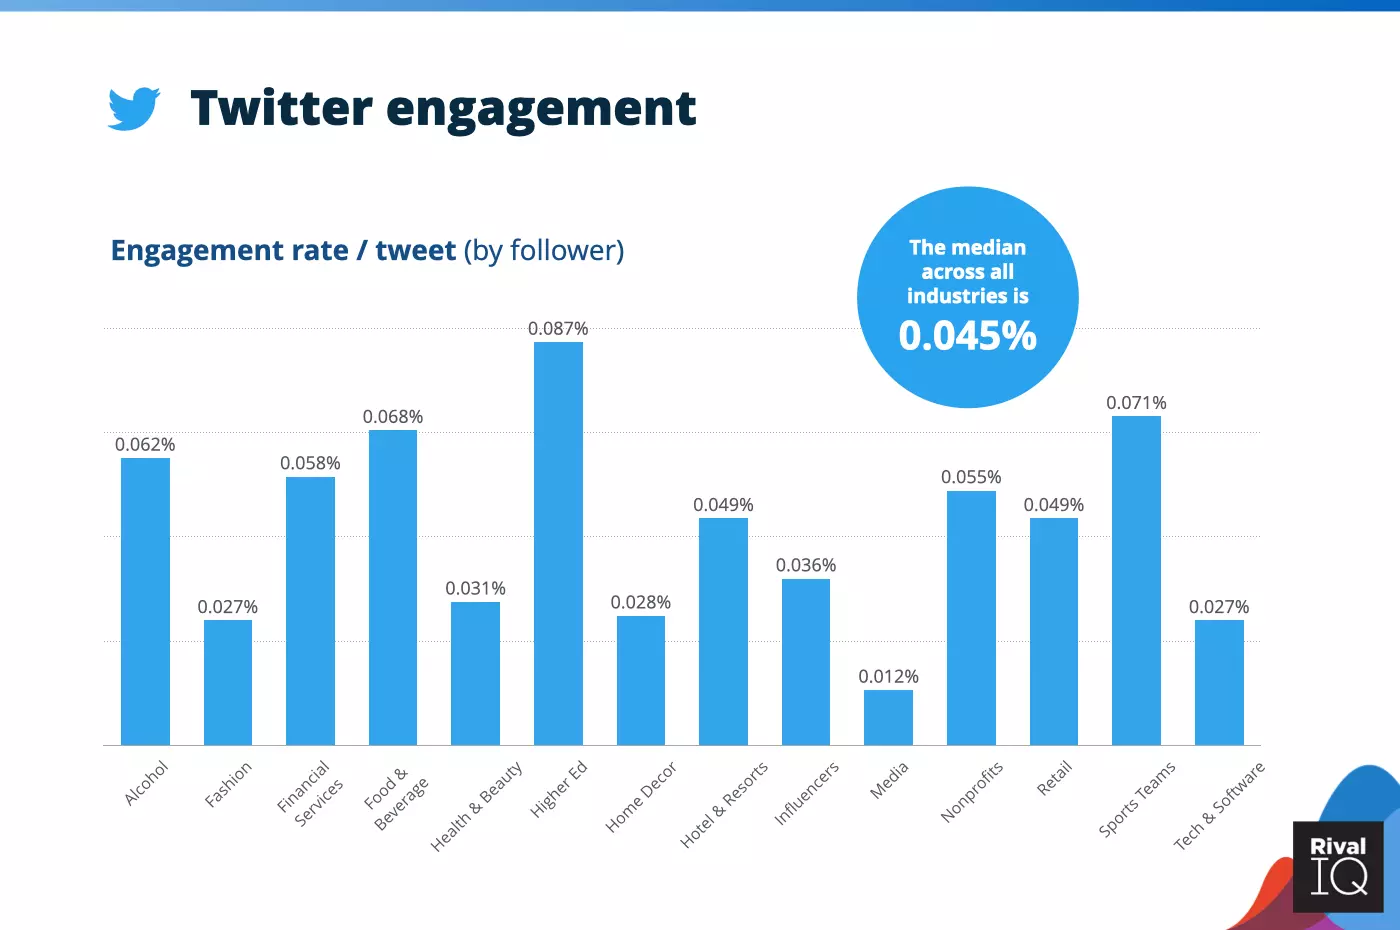
- The median across industries is 0.045%. Highest being 0.087% for the Higher Education industry. Followed by the Sports Team (0.071%) to Food & Beverages (0.068%)
Source: <a href="https://www.rivaliq.com/blog/social-media-industry-benchmark-report/" target="_blank">RivalIQ</a>
Cost Per Click
CPC for twitter is $0.33.
Click-Through Rate
CTR Twitter is 1.55%.
Knowing the current social media statistics can help brands update their strategy and set new goals. Are your engagement levels very different from the mentioned ones? These statistics work as a benchmark, but it is always a good idea to further research specific details on your product's performance.
Get true insights with 80+ social media metrics and stay ahead of the competition with deep insights about every nook and corner of your social scene with Statusbrew.


Explore the Statusbrew range of social media tools
Cancel anytime!