How to use bar graphs?
To compare data between specific categories in your social media analytics, we recommend using bar charts.
Bar graphs are useful for showing the relative size or value of two or more discrete objects (numbers).
Steps to create a bar chart
Go to Report and select any report.
Click on Add Widget and go to Create a custom widget.
Click Add Series, then choose Followers(for example).
The preview on the right shows the total number of followers across. At this point, you cannot separate or compare the data.
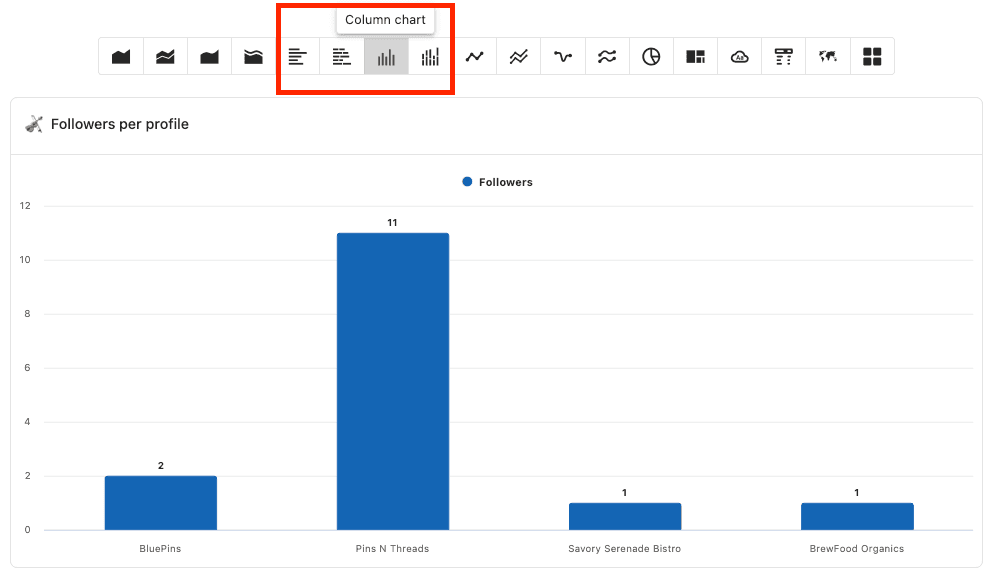
Selecting Data Sources as a dimension shows the number of followers for each connected social profile.
Select Bar chart in the visualization. Selecting this displays a Bar chart showing the number of followers for the selected profiles.