How to make a number chart?
You can create a number chart in reports.
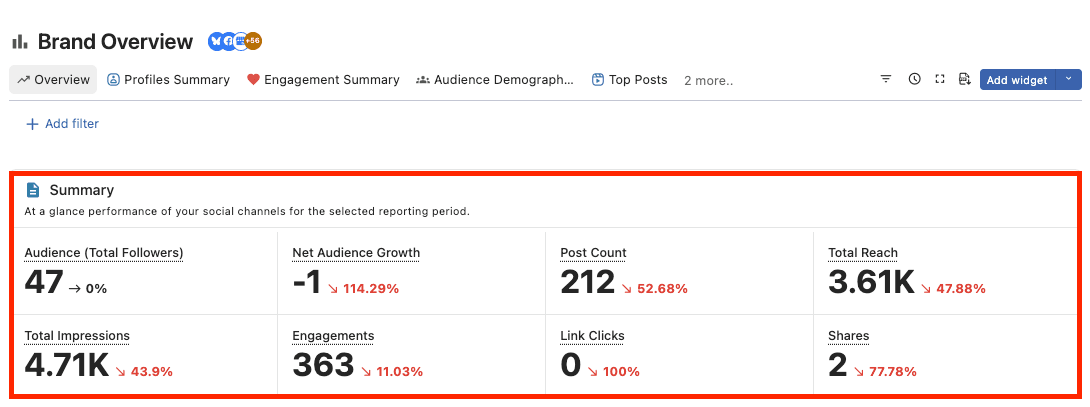
A number chart displays a single value in a widget, allowing you to see the data numbers at a glance.
Steps to create a number chart
Number charts are great for displaying data for basically any metric.
When creating a new
Click Add Widget at the top of the report screen.
Select Create a custom widget.
Enter the widget name and description.
Visualization is Number chart .
Select the values you want to display in the widget and add filters and sorting if necessary.
Finally, click Save and you're done.
To edit an existing widget:
Click the three dots in the top-right corner of the widget, then select Widget Settings.
Select Number Chart from the visualization dropdown.
When you're done, click Save.
Conditional formatting
You can set conditions in the number chart.
You can color the panels of values that meet a goal, or even those that don't, making the data easier to see.
Click the three dots in the top-right corner of the widget to set conditions,
Click conditional formatting
Select a metric, color, operator, and value.
Operator choices are Equal to, Greater than, and Less than.
Once everything is set up, click Create.
For example, to set "Social Profile Actual Growth value is less than 1, highlight in Red",
Metric: Social Profile Actual Growth
Color: Red
Operator: Less than
Value: 1
