How to add Benchmark Target lines?
You can see your goals and actual figures at a glance by setting up Benchmarks/ Target Lines for you, enabling you to quickly & clearly improve your strategy and provide feedback.
Steps to set a benchmark
Statusbrew reports allow you to set Target lines in the widget settings. Let's take a look.
1. To add Target lines (Benchmark) to your numbers, go to the relevant widget settings.
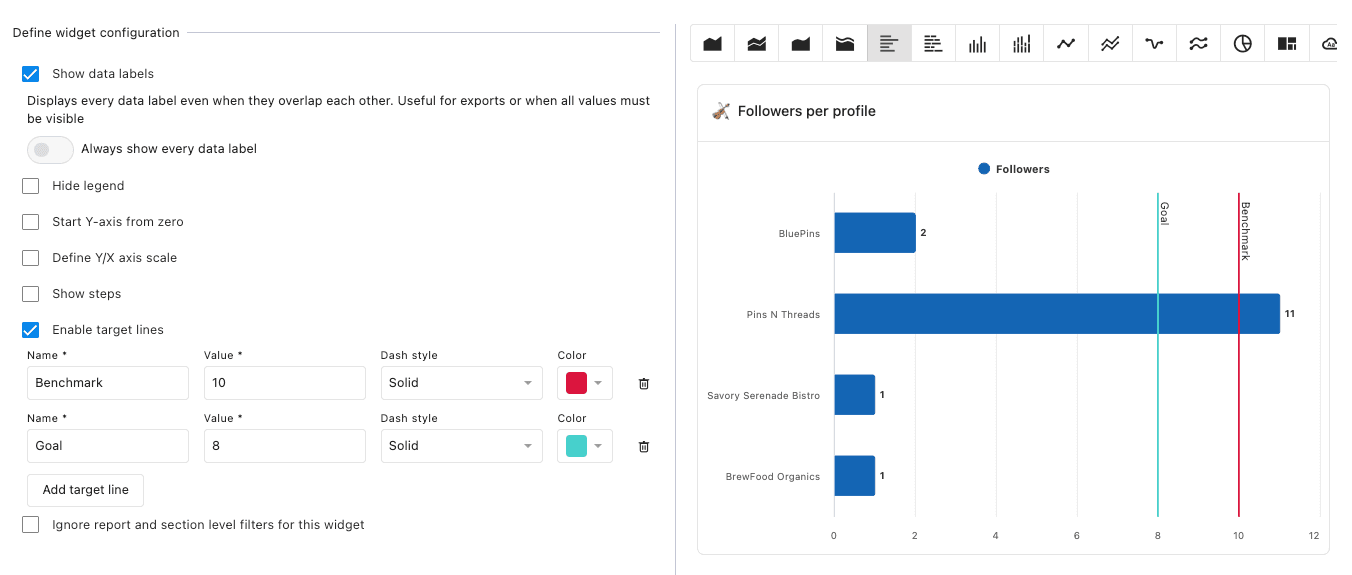
2. Under Define Widget Configuration, select Enable Target Lines.
Depending on the visualization you have selected, it may not be possible to add a goal line, in that case the "Enable Target Lines" option will not be displayed.
3. Select the name, value, dash style, and color of the target line. For line style, you can choose the visual of the target line from Solid (line), Long Dash (perforated), or Dot (dotted line). You can choose from 27 line colors.
I created a goal line with the following settings:
Name: Benchmark
Value: 10
Dash Style: Solid
Color: Red
4. Click Save to finish.
Note : If you want to add multiple goal lines, click Add Target Line and set them in the same way.
Benchmark additional settings
Depending on the widget settings, "Apply goal line" may not be available.
Available visualizations
Area Chart
Stacked Area Chart
Spline Area Chart
Stacked Spline Area Chart
Bar graph
Stacked bar chart
Column Chart
Stacked column chart
Line graph
Stacked Line Chart
Spline Chart
Stacked Spline Chart
Easily edit your benchmarks at any time and adjust your targets based on ever-changing competitive and industry analysis.