
To maximize your social media performance, you need to understand what's driving clicks, what's bringing engagement - what's working and what isn't.
Reports are a concrete, data-driven way of showing what you've accomplished.
In this blog, we will see tips to create an effective social media report, including key metrics to track and best possible presentation of a report.
6 Tips To Share Effective Social Media Report
Here are 6 tips to make your social media report an effective one.
1. Identify Stakeholders
Know who'll receive your reports? Sales, marketing, PR, senior management, customer support, or any other team. Tailor your report based on who’s going to read it.
The specific data you'll want to include in your social media marketing report will depend on the goals and related metrics that you're tracking.
2. Establish Goals
What is the desired outcome from your social media report? To prove your success rate, your brand value? Or to demonstrate target vs. achievement?
For example, your matrix may consist of:
· Number of leads generated
· Number of conversions
· Total revenue generated
· Total spent (on social ads)
· Social share of voice
· Social sentiment
This, of course, depends on who your stakeholder is.
You can include any of the three categories of reporting:
Regular Reports
You can use key metrics to show your progress on social media – increased number of followers, positive sentiment, etc. You may keep it to your brand alone or include competition for comparison.
One-off Reports
Run qualitative analysis after a one-off campaign, event, or product launch – to find if it worked as per expectations or not.
Research Reports
Social listening can help you to find data and insights for a particular topic, keyword, competition or trend.
3. Reporting Time Frames
Some metrics need tracking more often than others. Reporting time frames can be either daily, weekly, monthly, yearly, or campaign-related.
You'll also need reporting results after one-off campaigns, events, seasonal holidays, product launches.
4. SMART Answers
SMART, in this context, stands for:
Specific Measurable Achievable Relevant and Time limited.
What answers do you want from your reports?
For instance, if you're doing a report surrounding an event or product launch, a possible question could be – how many sign-ups or email IDs did you get? A monthly report could ask, how many newsletter subscriptions per post, per month?
Keep these SMART elements in mind when presenting your points. An example showing SMART report.
5. Presenting A Report
Keep it simple but informative. No one would read a dull report, while a highly complex report won't be understood or remembered by your stakeholders.
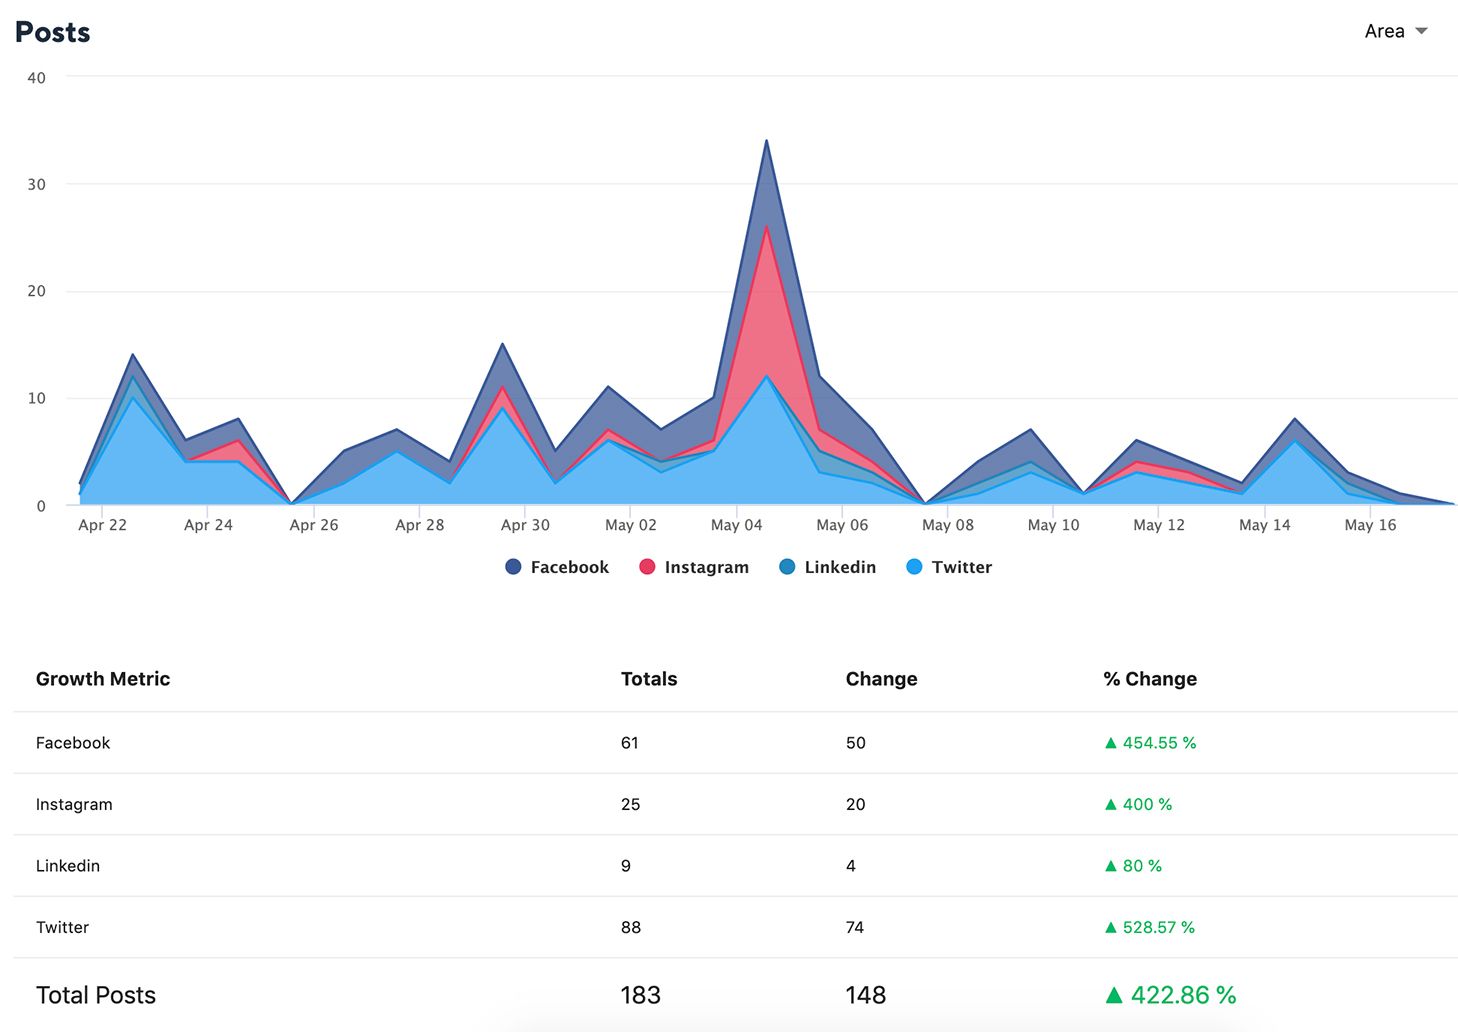
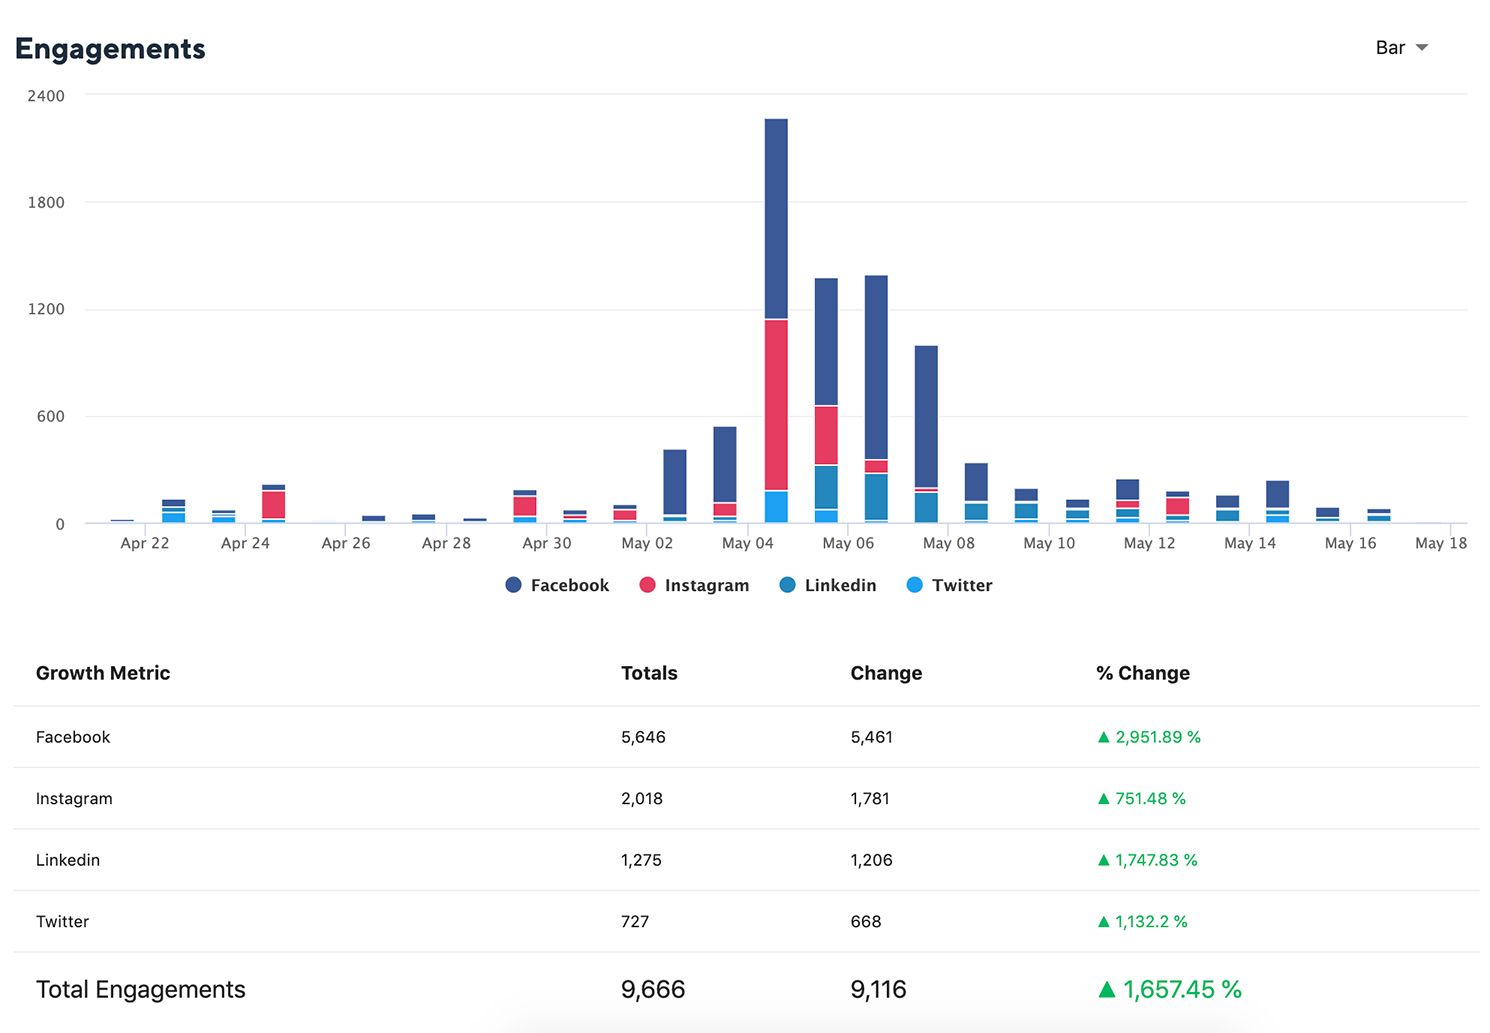
Where ever possible, use graphics (graphs or images). Use word clouds to put life into your reports and add context to your numbers.
Include short descriptions and examples of the social posts you're measuring. Finish with takeaways and analysis highlights.
An example showing a simple and informative report.
6. White-Lable Reporting
White labeling a report means adding your own branding to another company's product so you can present a unified front to your clients. When applied to a reporting tool, this is called white label reporting. White label reporting is important for your agency's branding efforts.
This is important for an agency’s branding efforts. If you do not include your branding within the reports, you’re missing out on an opportunity which can strengthen your brand and add a personalized touch to the report. The clients will be looking at your reports frequently, there can be a lot of brand reinforcement. If you are offering an agency dashboard for your clients, adding your branding to the report can also give a boost to your agency branding.
Furthermore, some of your clients might want to see their own branding on the automated reports. You can even have a combination of client and agency branding together.
Learn how to white-lable a report using Statusbrew.
An example showing a white-labled report.

Are you overwhelmed by social media reporting? Don't be. Monitor the metrics appropriate to your business, choose the social media reporting tool like Statusbrew reports that gives you the data you need from the channels you use, and present your insights in a clear, context-driven way.
Use Statusbrew to get true insights with 80+ social media metrics and stay ahead of competition with deep insights about every nook and corner of your social scene.
Post or schedule your campaign for Twitter, Facebook, Instagram, Youtube, Linkedin and Google My Business.


Explore the Statusbrew range of social media tools
Cancel anytime!