Facebook and Instagram Paid Performance Report
Facebook and Instagram Paid Performance Report contains campaign level data which is displayed against different metrics and KPIs (key performance indicators) to help identify the vital aspects of various campaigns. In order to generate this report, you need to connect your Ad Account with Statusbrew.
Facebook and Instagram Paid Performance Reports are available in Premium plan and above. See full feature comparison of Statusbrew plans here.
Admin, Primary Owner, Owner, and users with View Reporting permission for a particular profile/profile group can access reports. To view Facebook and Instagram Paid Performance Report,
Click on the Home button in the top left of your screen to open Statusbrew Home and click on Reports
Under the Reports section, click on Facebook and Instagram Paid Performance

Campaign Selector
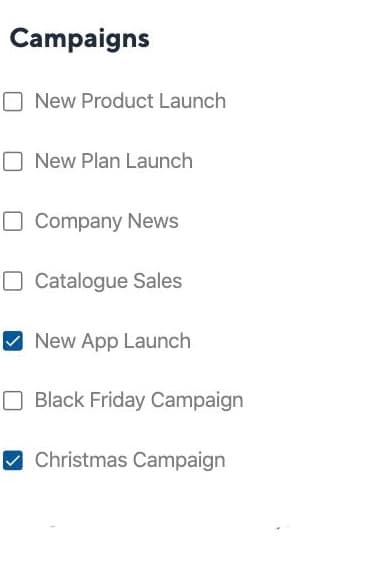
Select an activity date range and choose the name of the campaign(s) from the campaign selector to start building your reports.
By using the Compare to feature you can compare the change in the performance of a campaign in the current period versus the custom previous period.
Campaign Summary

The summary section gives you a brief analysis of your selected campaigns. You get an overview of the metrics such as Total Spend (Total amount spent on the selected campaigns), Impressions, CPM, Engagement, CPE, Clicks, and CPC.
Impressions
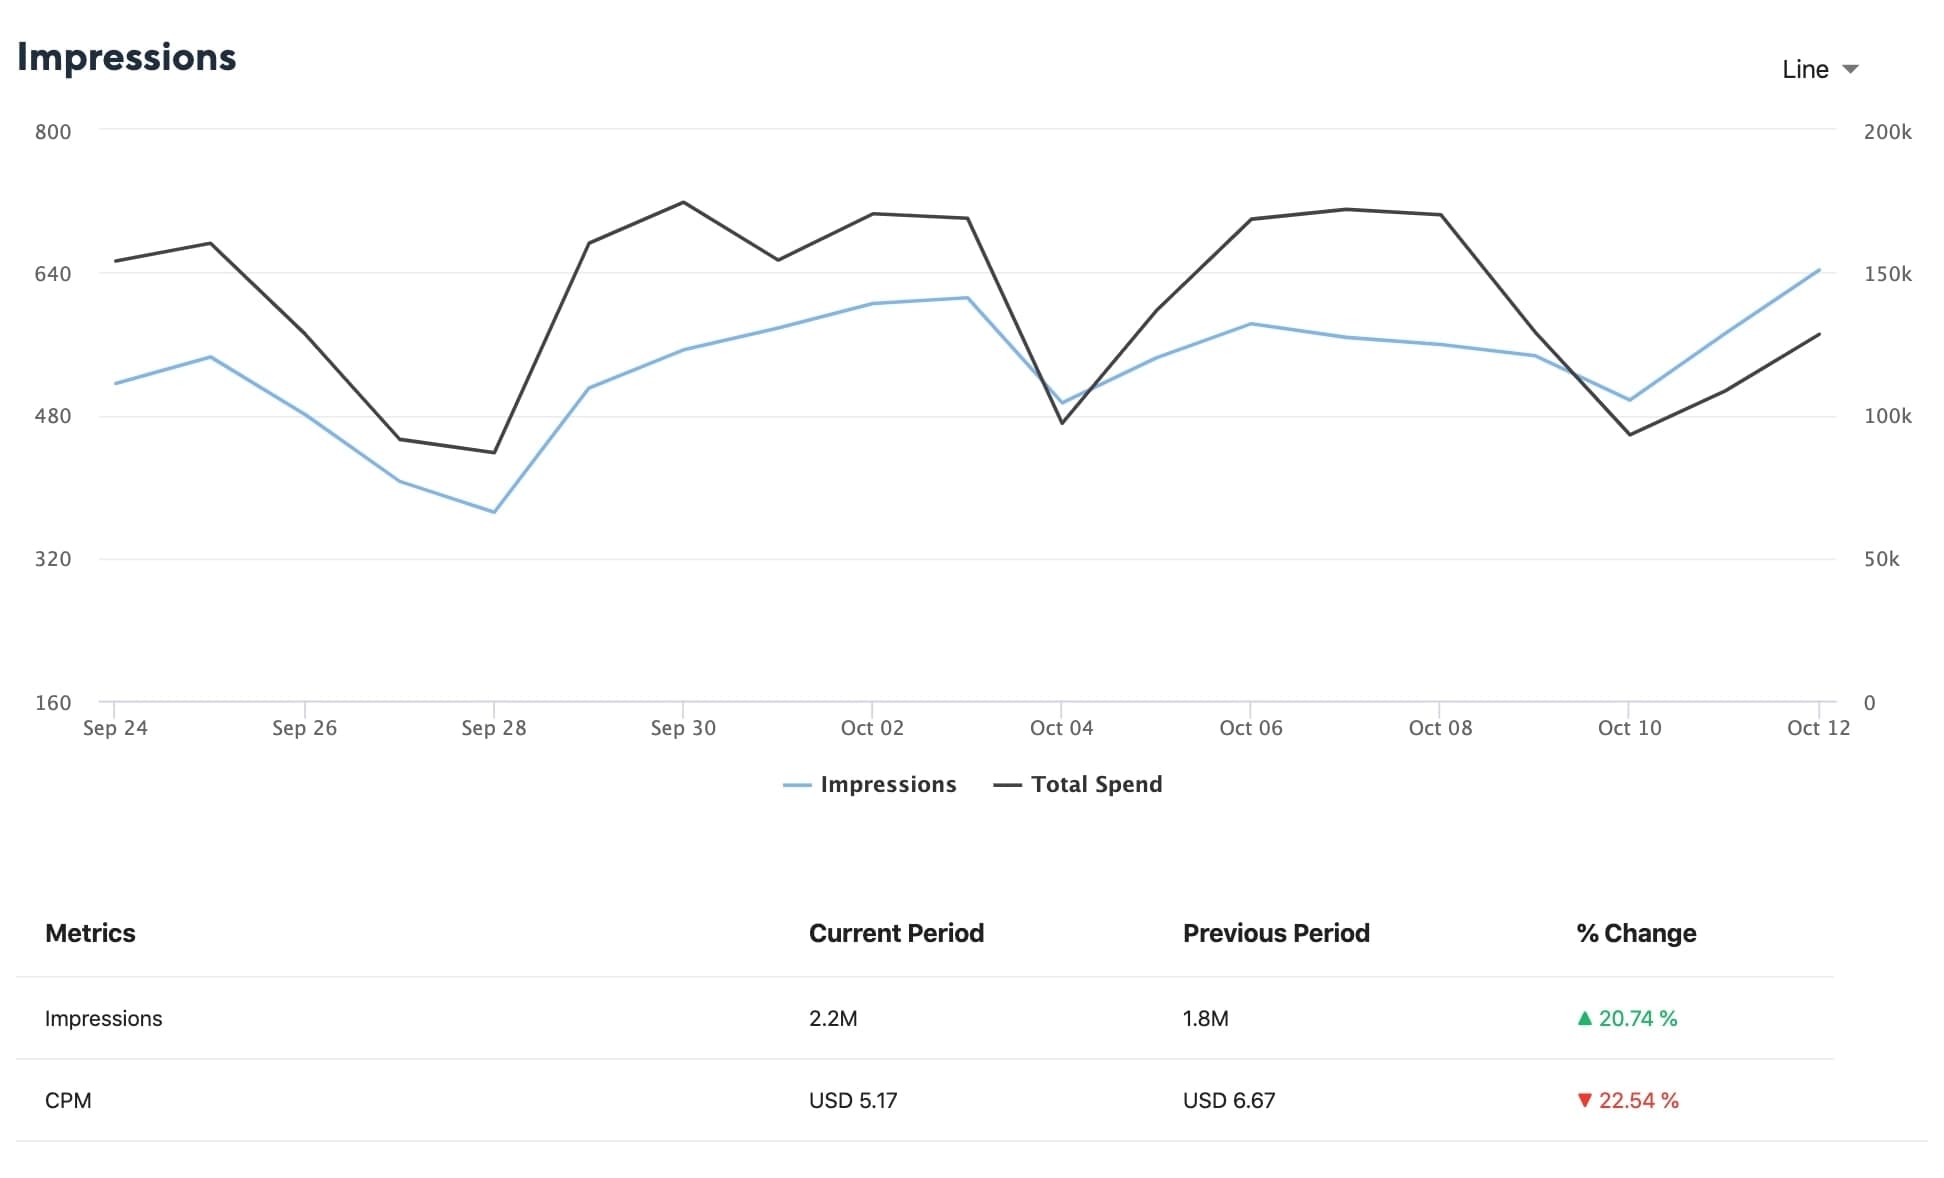
Get the total number of impressions received on your selected campaigns along with the average cost per 1000 impressions (CPM) across these campaigns.
Engagement
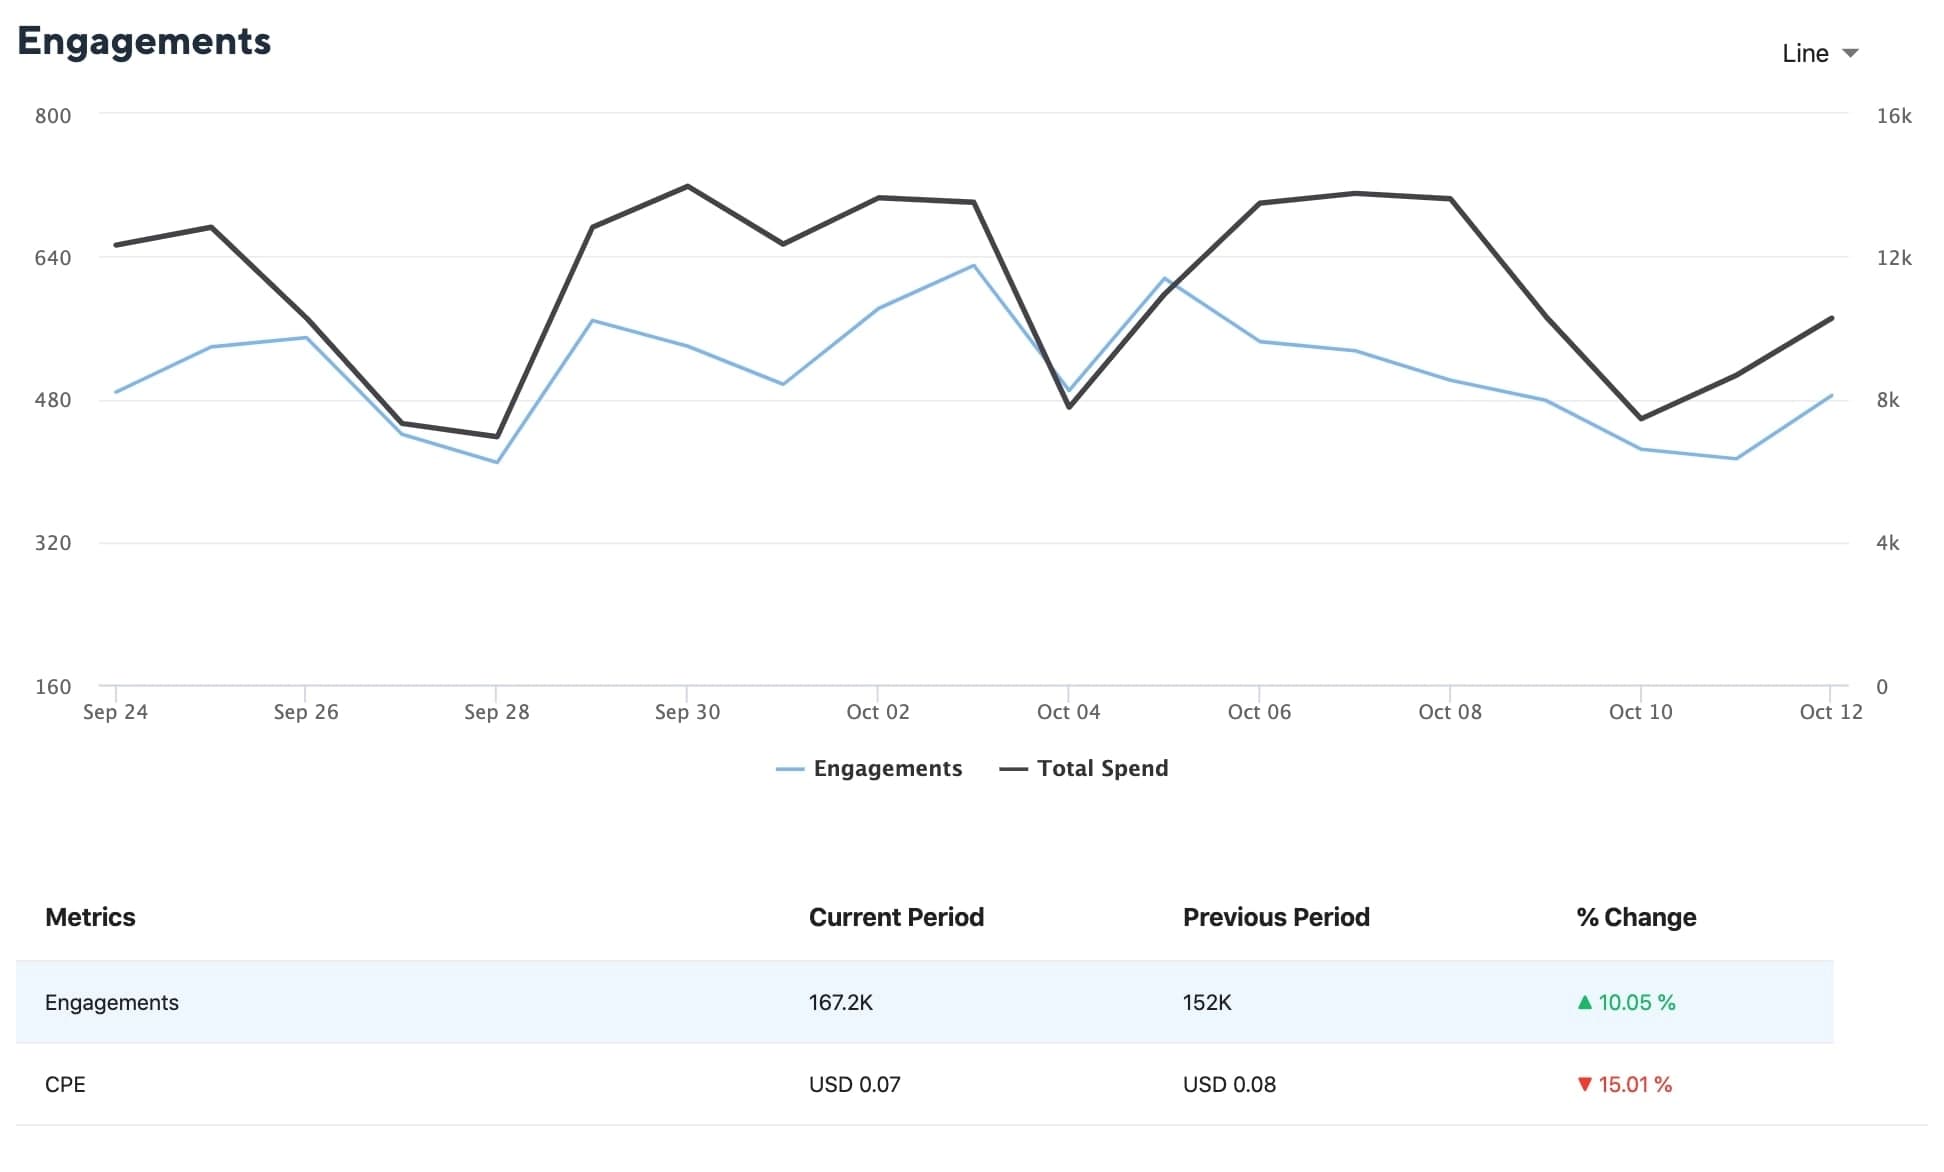
The total number of engagement driven by selected campaigns along with the average cost for a single engagement (CPE) received.
Clicks
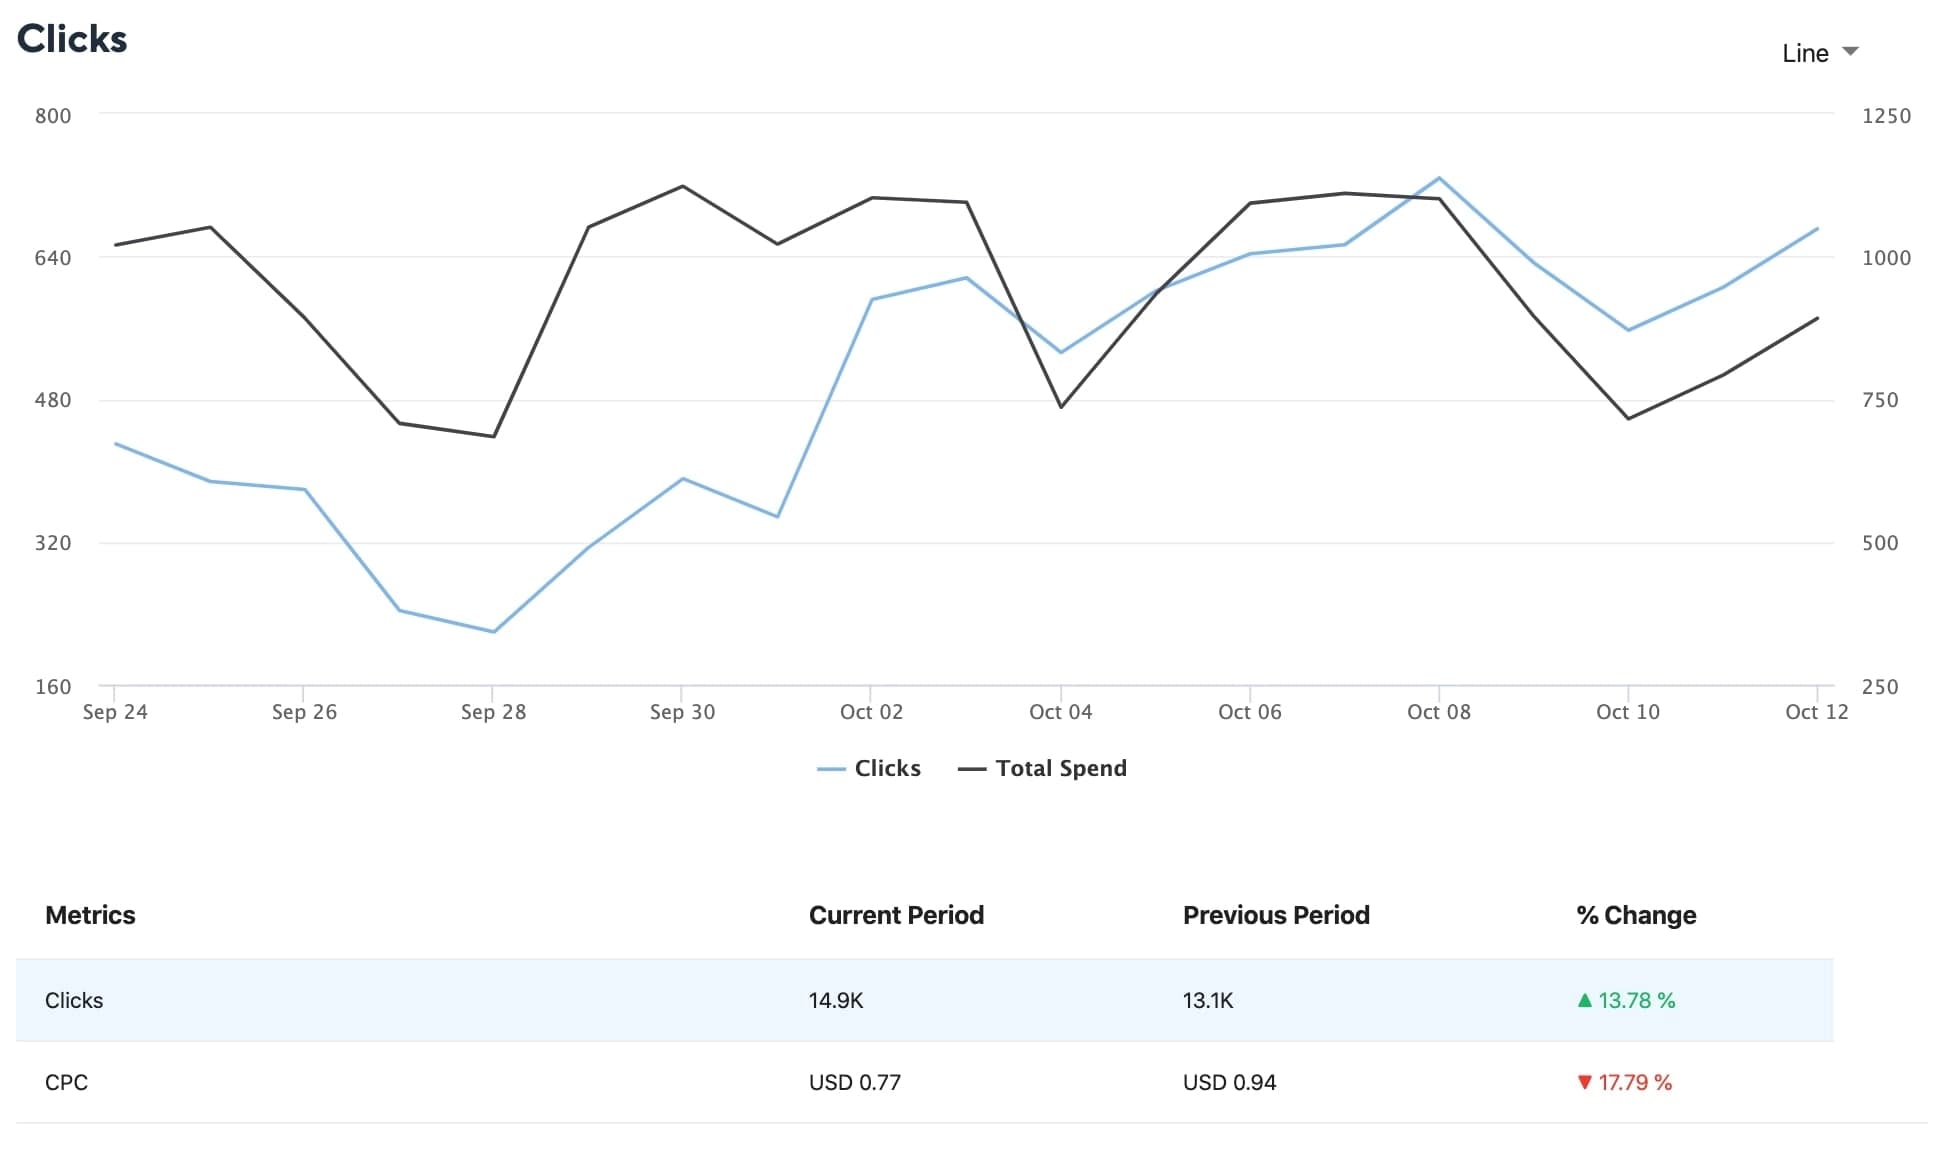
The total number of clicks driven by selected campaigns along with the average cost for a click (CPC) received.
Video Views
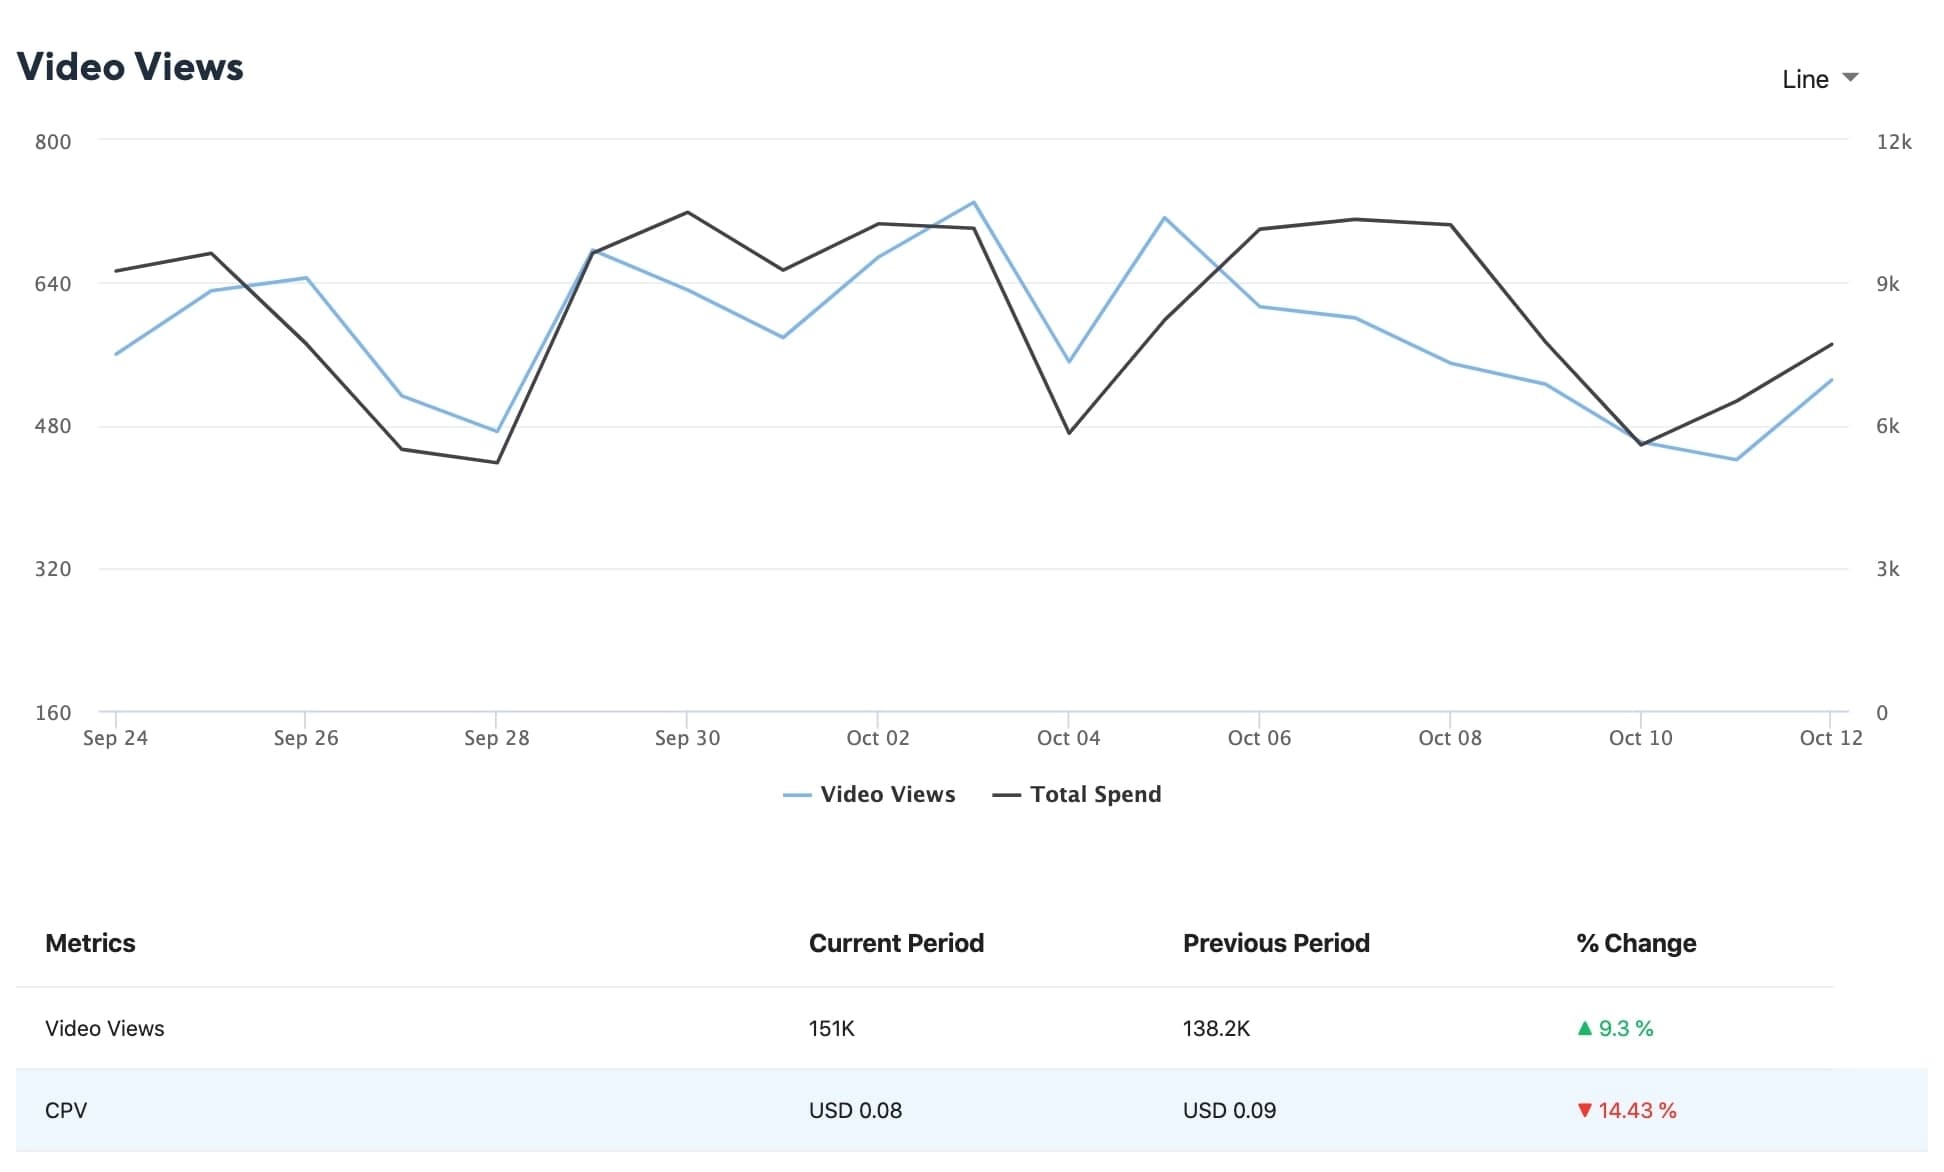
The total number of video views driven by selected campaigns along with the average cost of a single video view (CPV) received.
Mobile App Installs
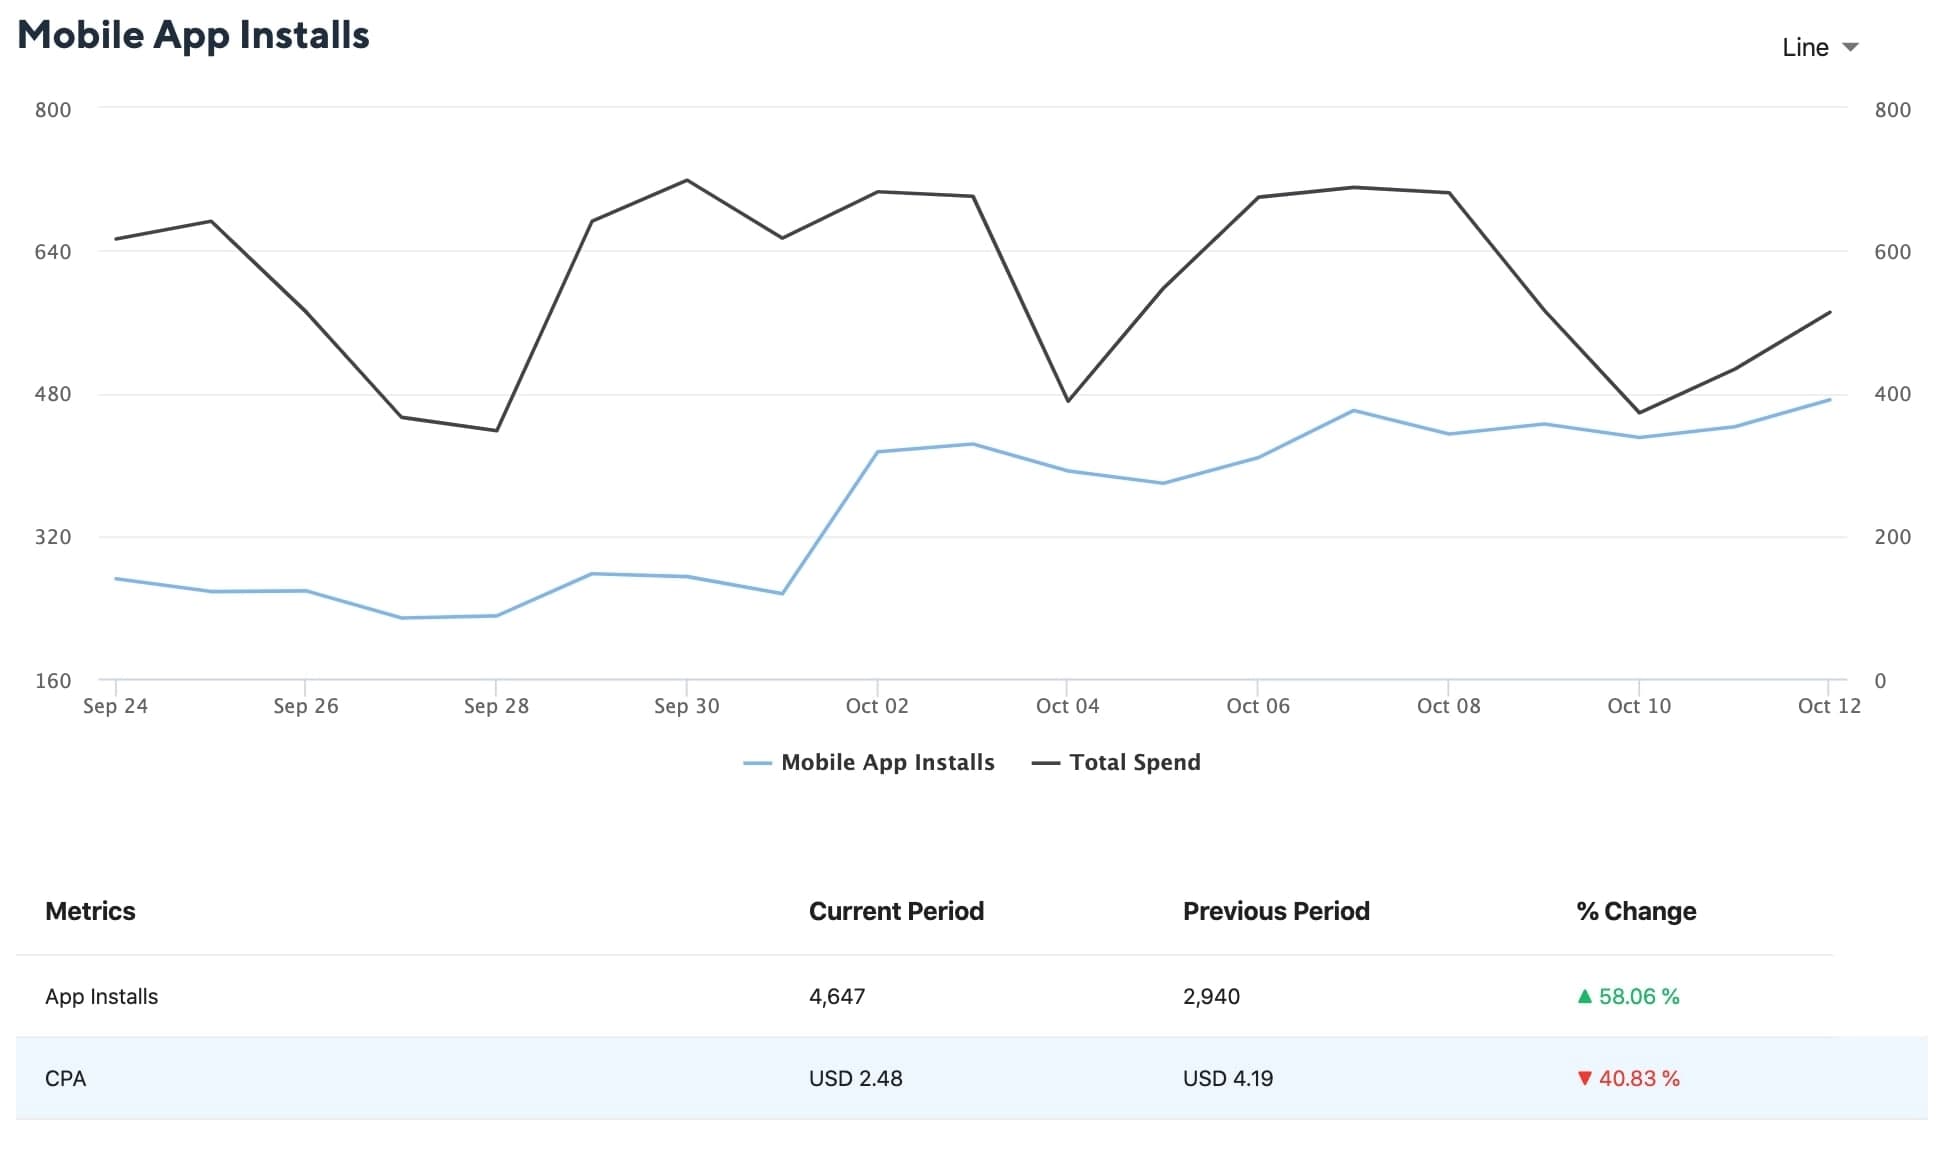
The total number of app installs received across selected campaigns along with the average cost per action (CPA).
Conversions
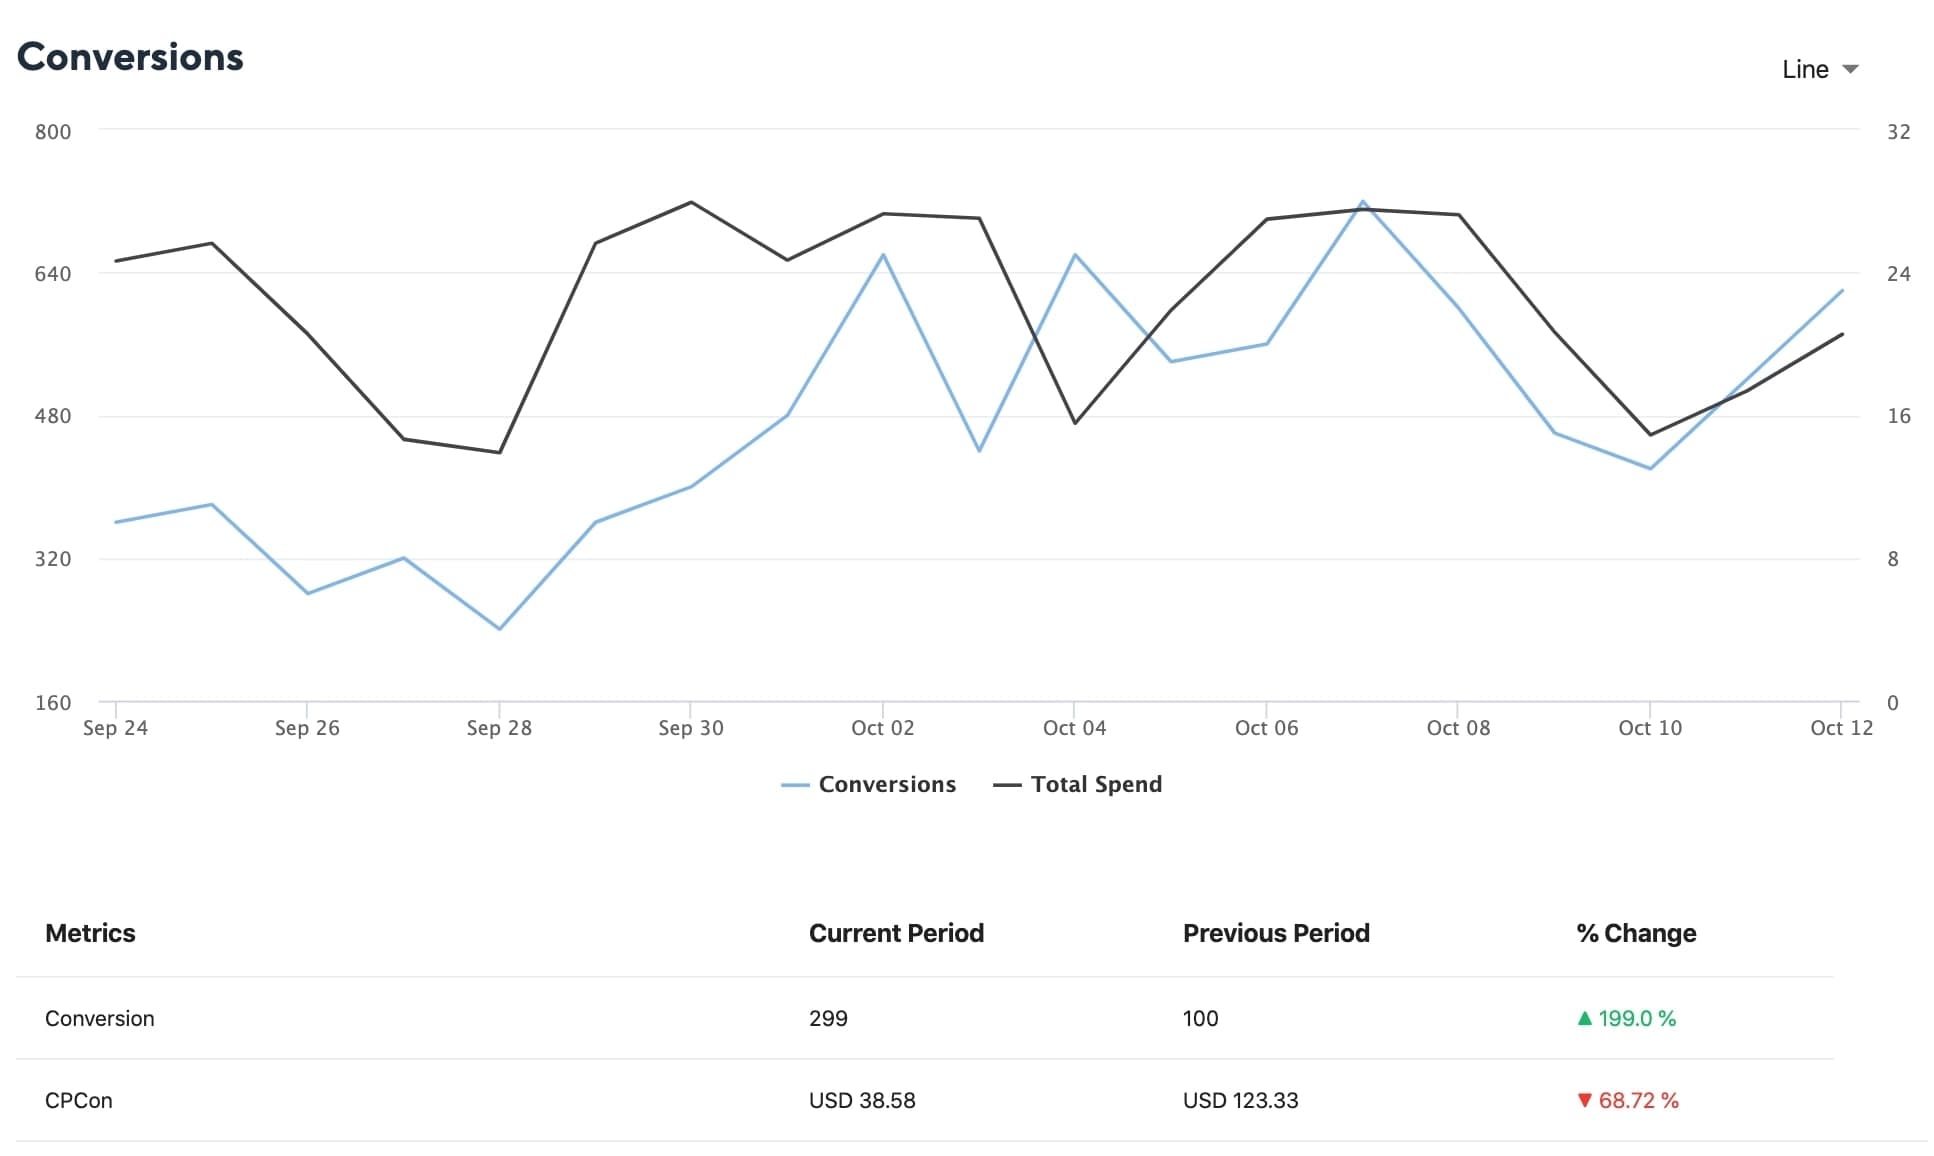
The total number of conversions driven by selected campaigns along with the average cost per conversion (CPC).
Additionally, you can also get a breakdown of your ad content by:
Ad Account
Campaign
Channel
All the graphs can be customized as per choice to Bar, Line, Area, or Tabular form. Facebook and Instagram Paid Performance Report can be exported in the form of a PDF.