Team Engagement Reports
Team Engagement Reports help you measure the volume of incoming conversations along with the team's effort in replying to those conversations from the Engage Inbox.
Leaderboard Reports are available in Premium plan and above. See full feature comparison of Statusbrew plans here.
Admin, Primary Owner, Owner, and users with View Reporting permission for a particular profile/profile group can access reports. If you wish to hide team member filter for a particular team member in Team Engagement reports & Leaderboard reports to meet compliance, contact our support team.
Access Team Engagement Reports for your organization by following these simple steps:
Click on the Home button in the top left of your screen to open Statusbrew Home and click on Reports
Under the Reports section, click on Team Engagement

Here are the widgets available in Team Engagement Reports:
New Conversations
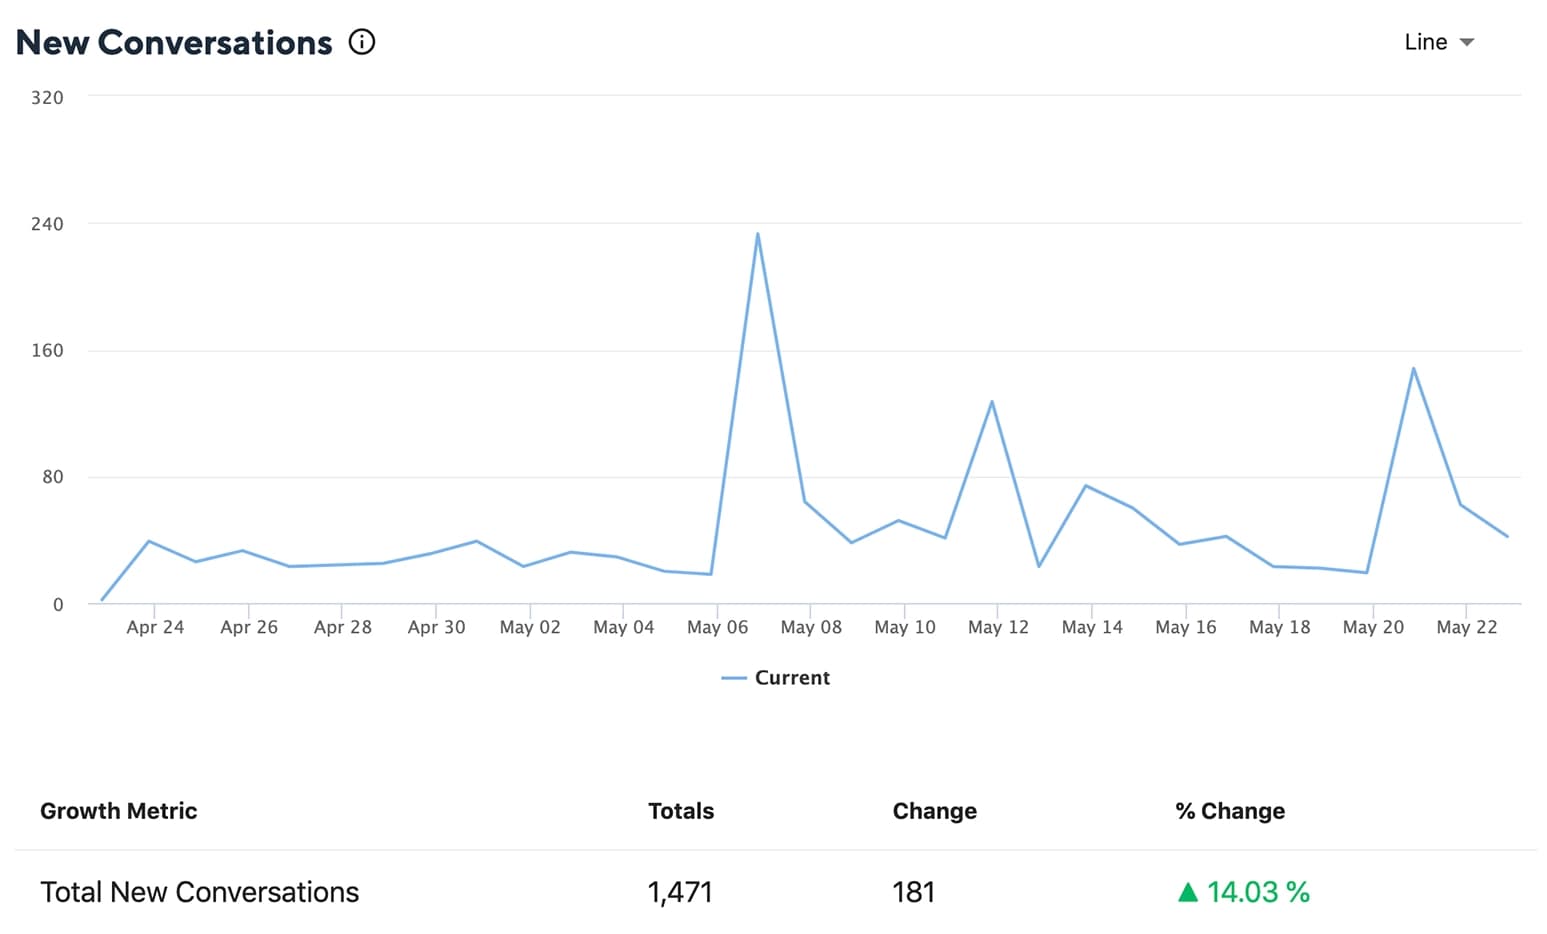
The number of conversations initiated by any new inbound direct message, comment on your post, or a rating on your business grouped by the date the conversation started.
Conversations By Type

The breakdown of all the incoming conversations by its type.
Conversations Participated In
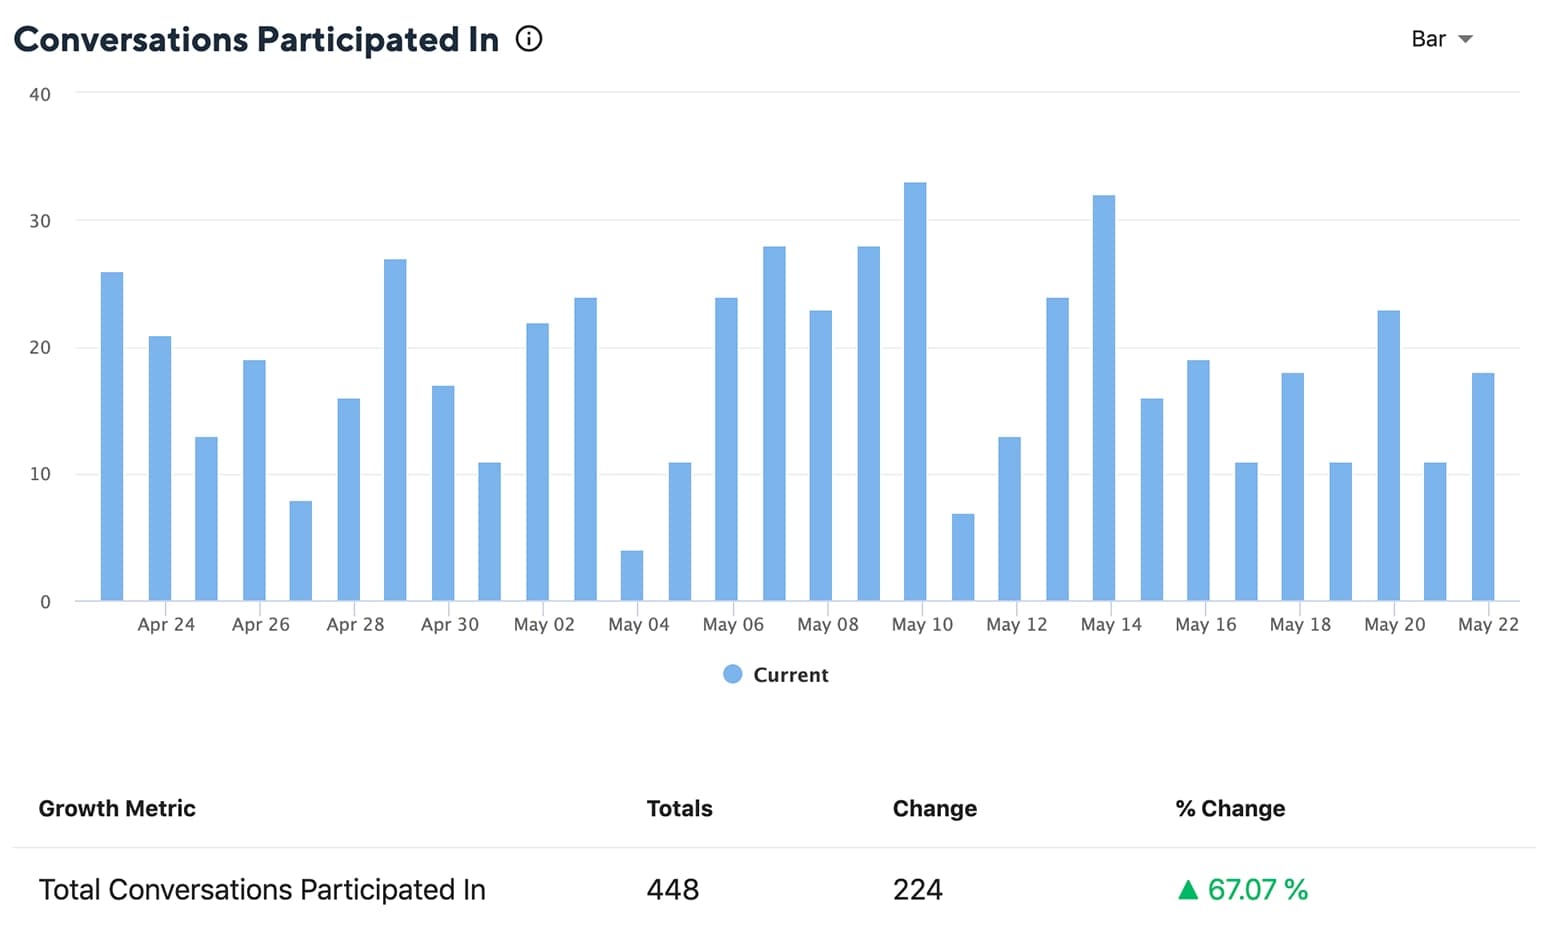
The number of conversations all team members have replied to, grouped by the date of the conversation response. Note that these conversations may have started before the selected date range.
Replies Sent
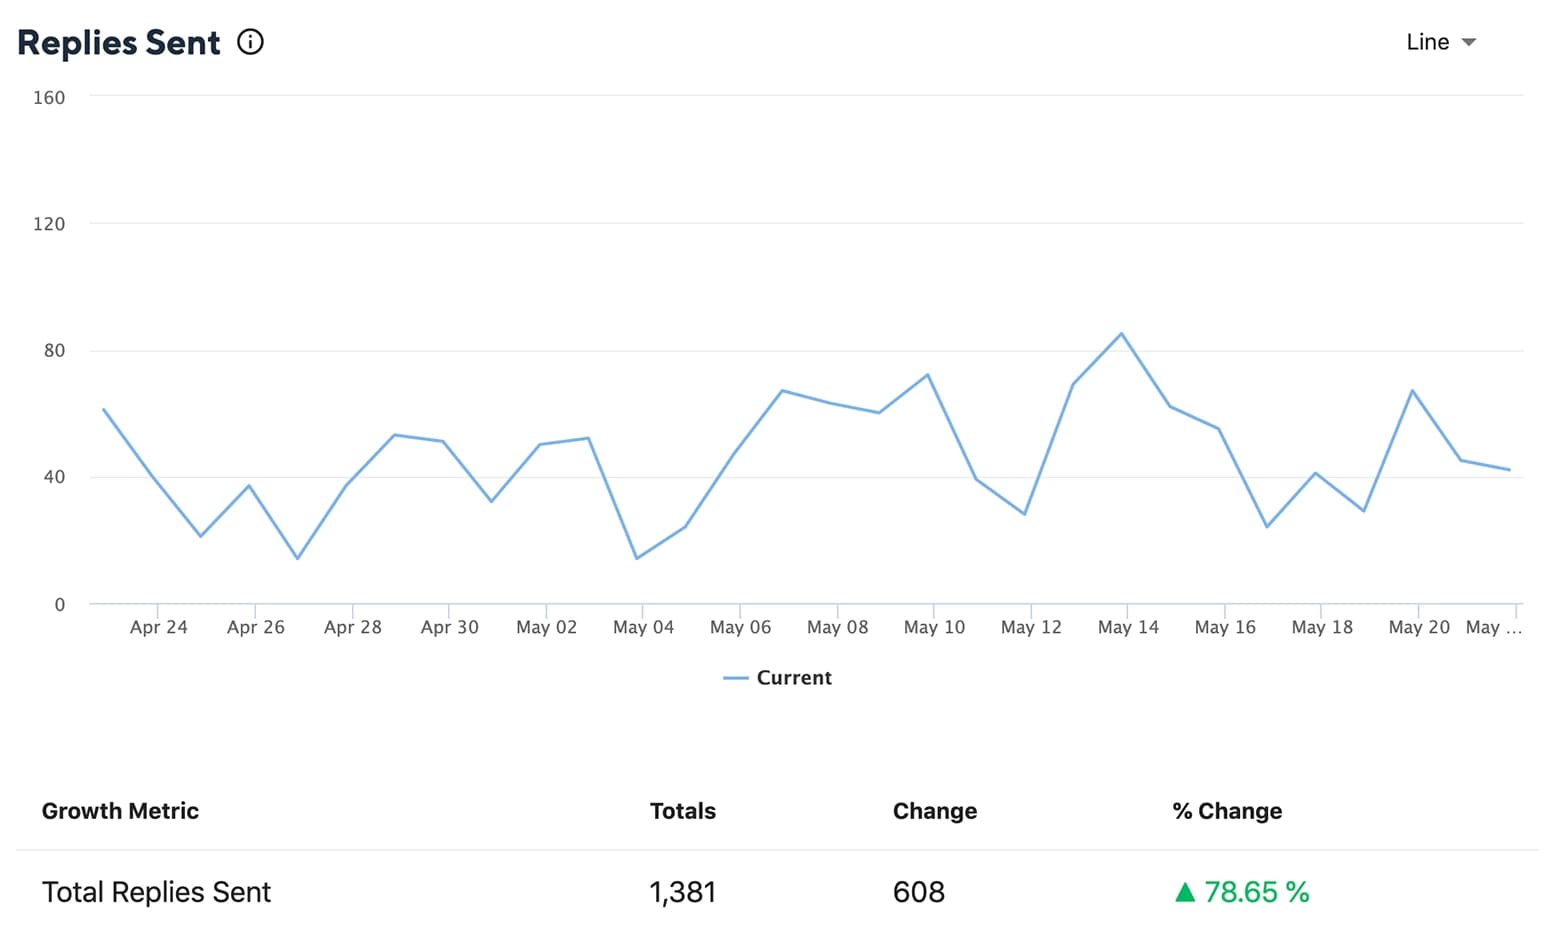
The number of replies all team members have sent in all the conversations, grouped by the date of the conversation reply.
Conversation Closed
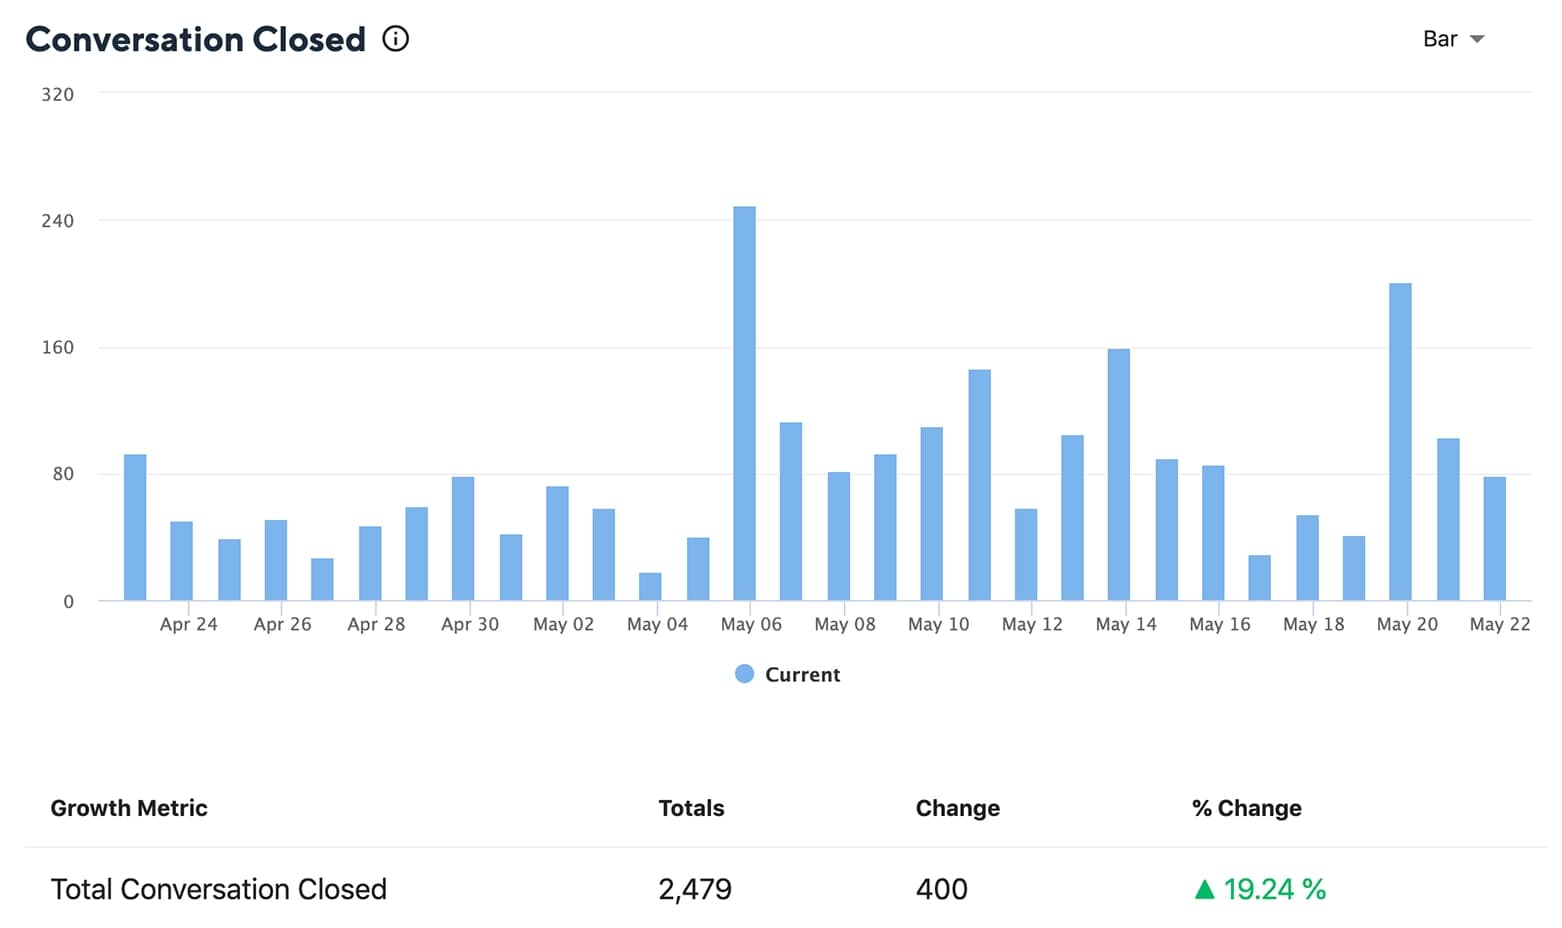
The number of conversations closed by all team members, grouped by the date the conversation was closed.
Median First Reply
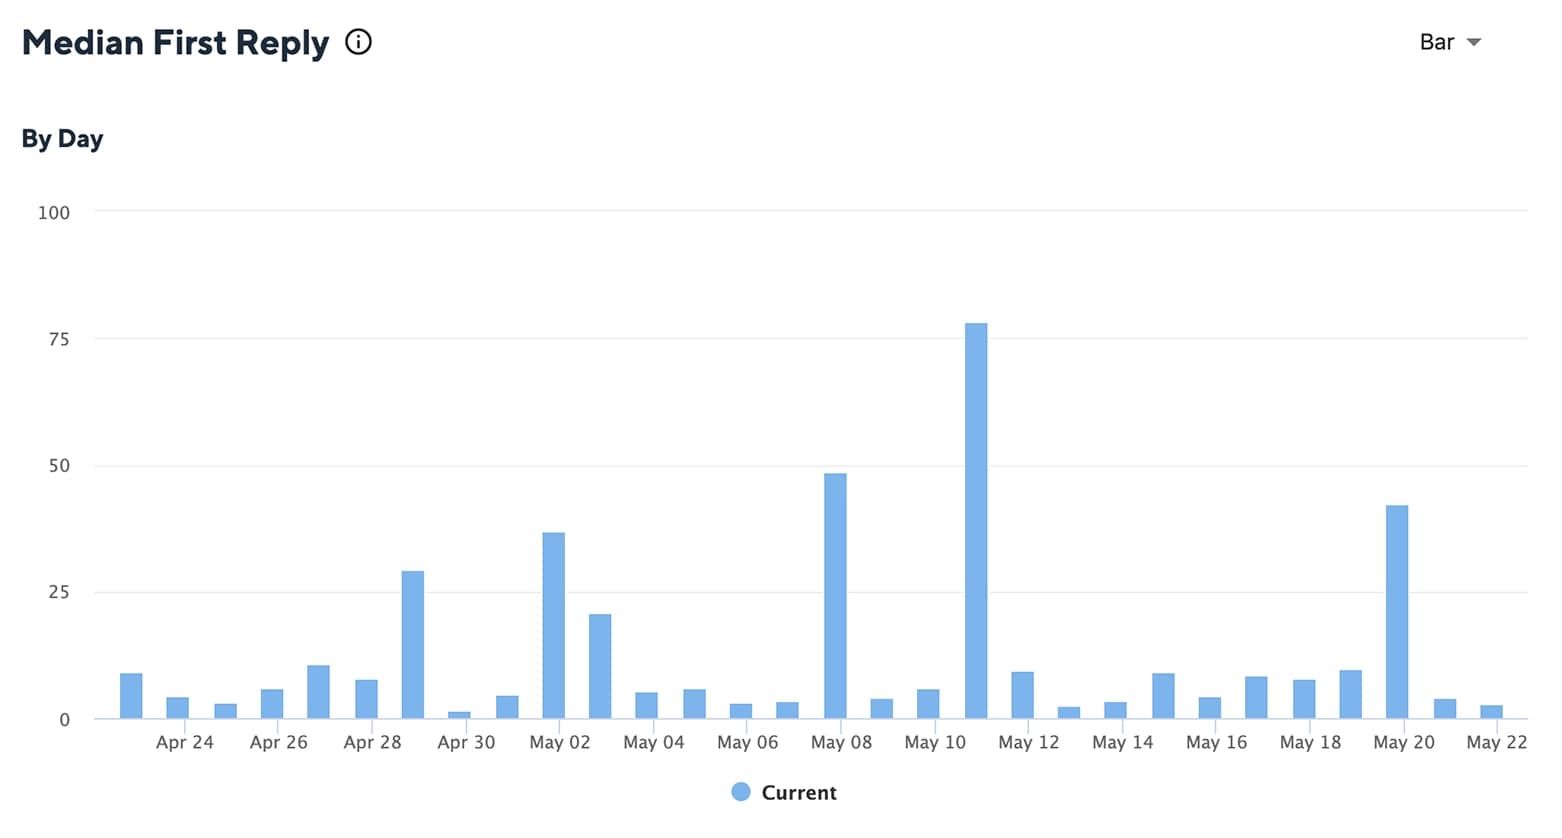
The median time it takes for the first reply to be sent to the incoming conversation by all team members, grouped by the date the conversation started. To get rid of any discrepancies for the median reply times, you can set up Office Hours for each social profile in different timezones and understand how quickly each executive is responding to customer queries over time. Learn more about Office Hours.
Median Reply Time
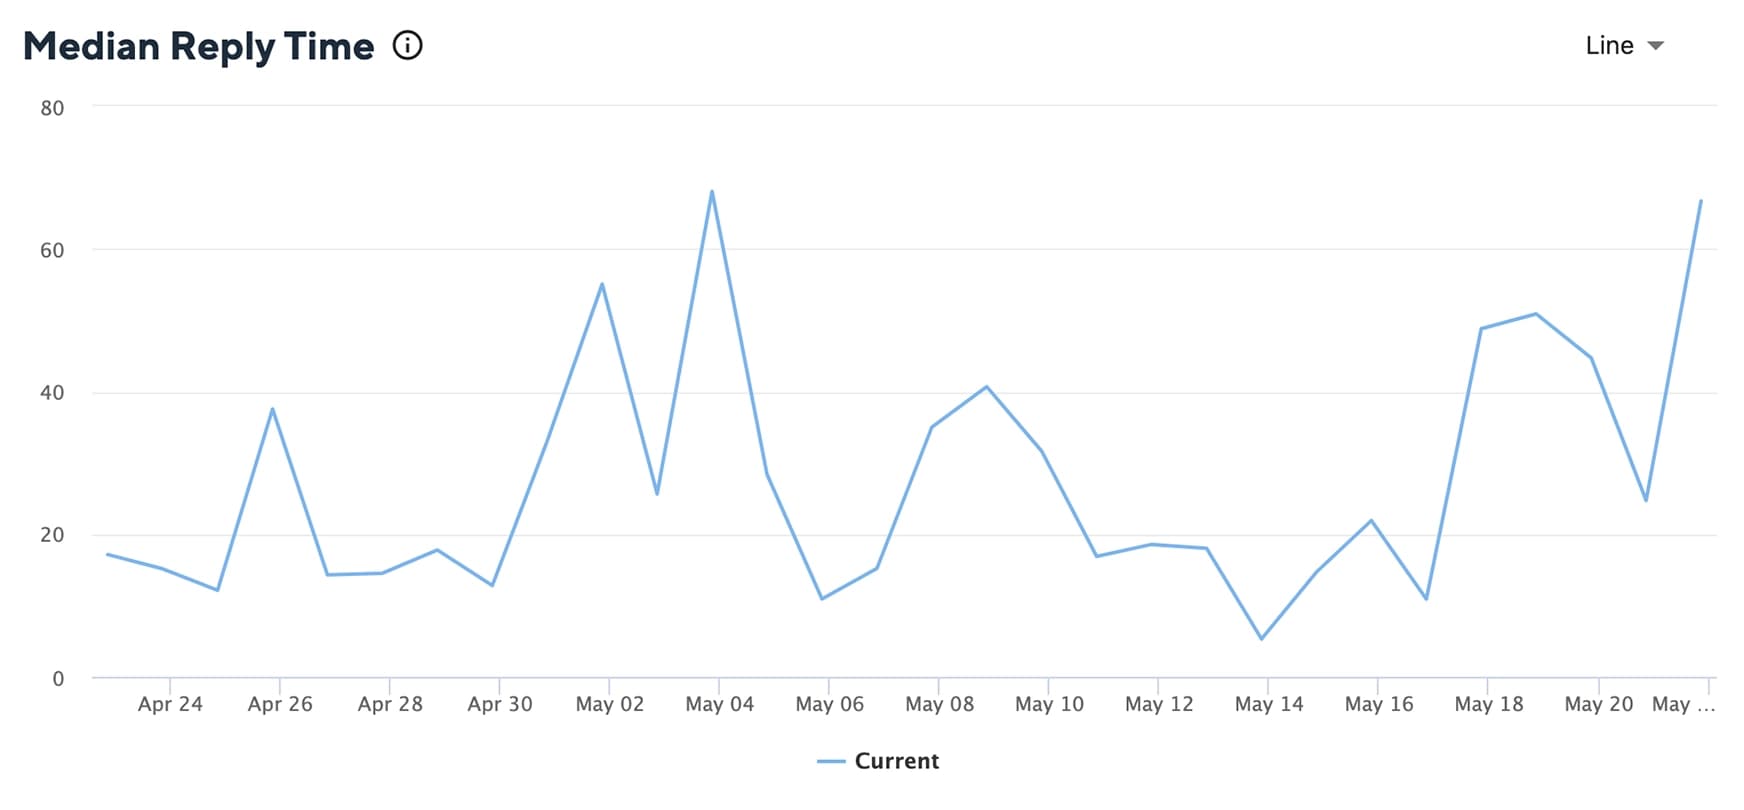
The median time it takes to reply to a conversation at any point by all team members including their first response, grouped by the date the conversation started.
Median Close Time
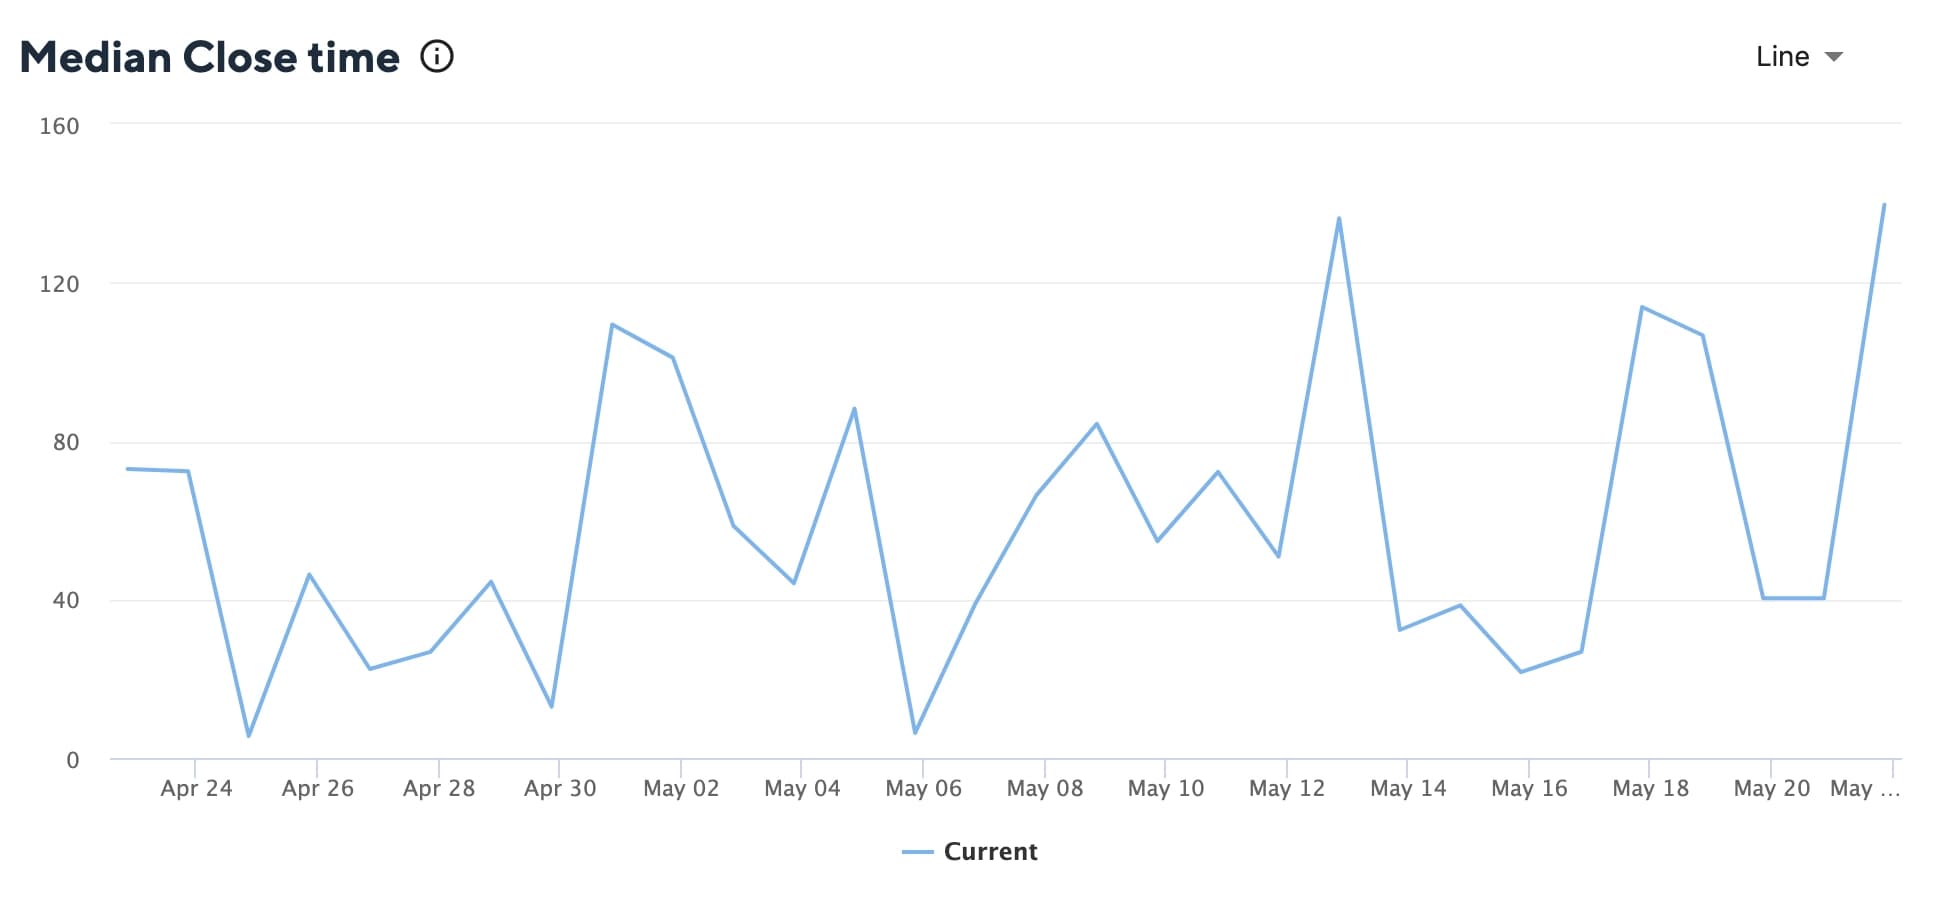
The median time it takes to close a conversation by all team members, grouped by the date the conversation started.
Busiest Period For New Conversations
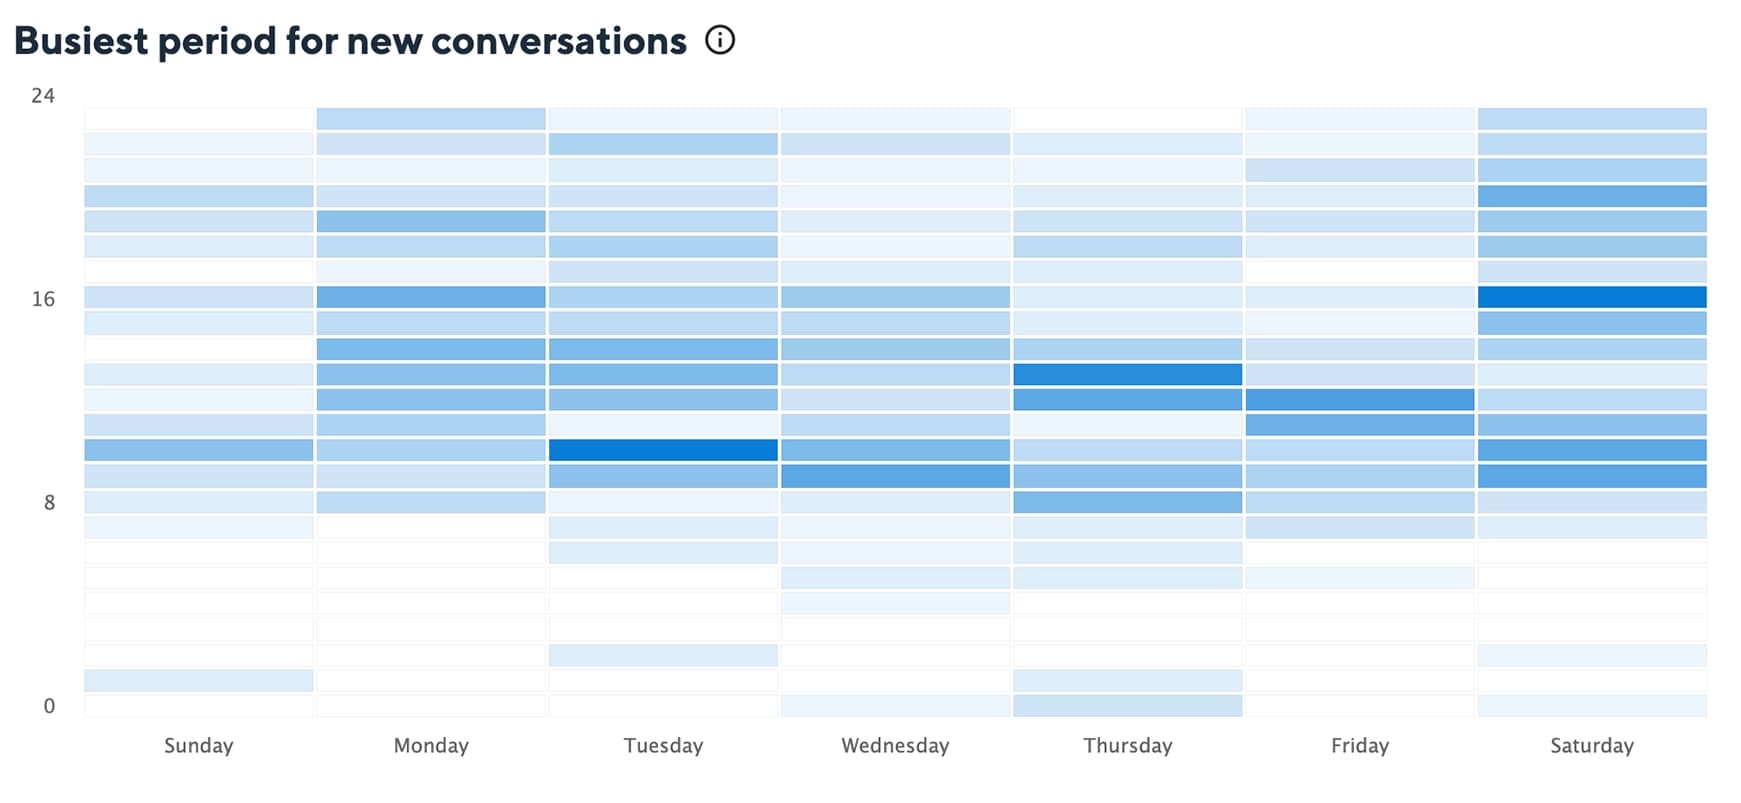
The average day and hour team members participated in the new conversations over the selected period. Light colors show the quietest hours, darker colors show the busiest.
Busiest Period (Most Responsive Time For Team Members)
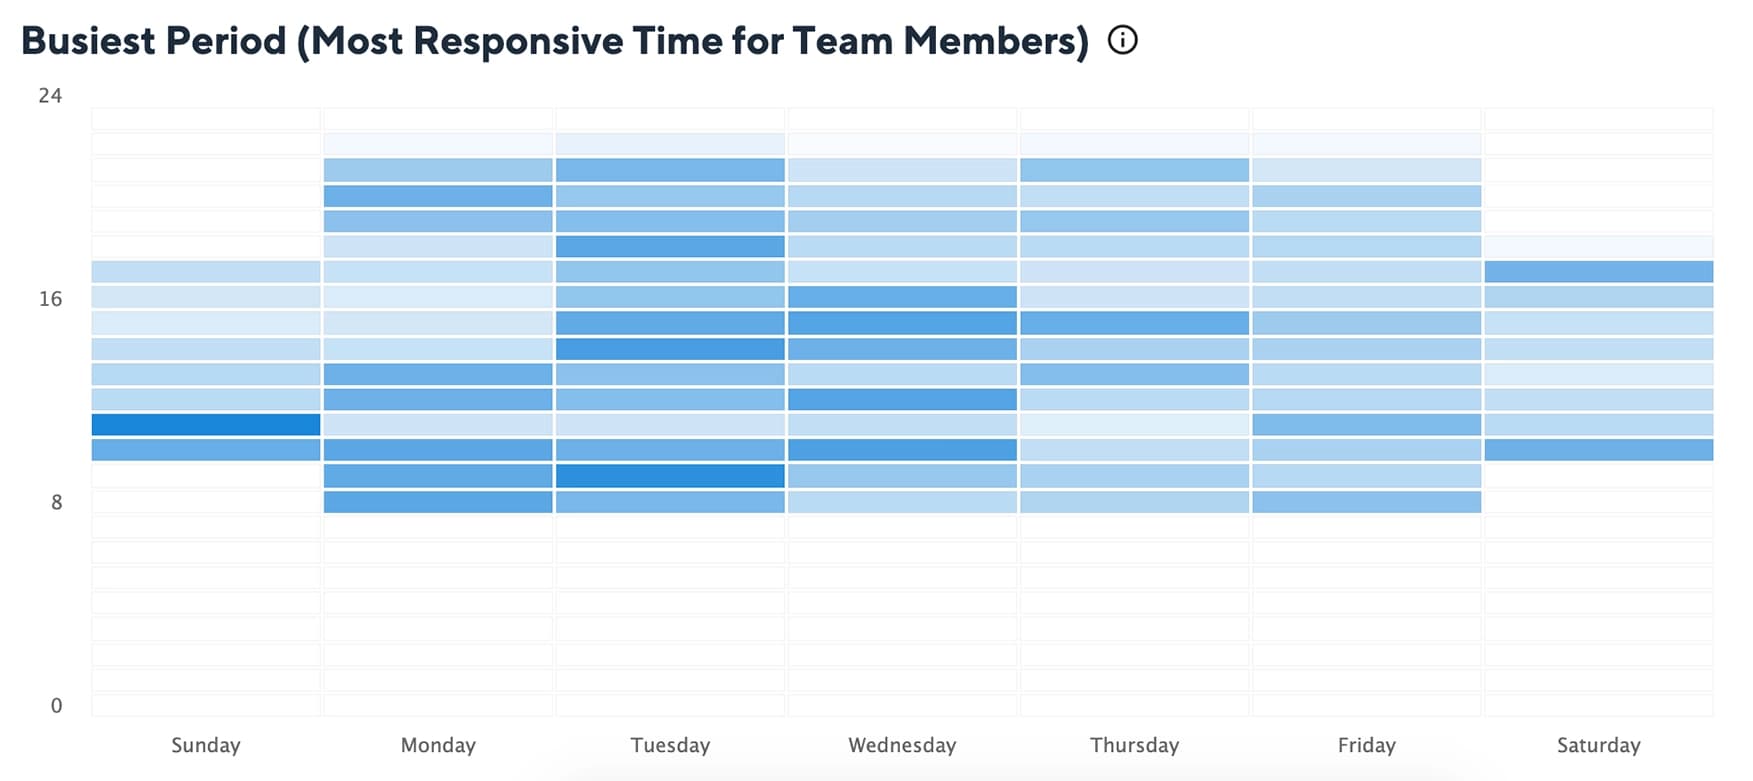
The average day and hour team members participated in the most conversations over the selected period. Light colors show the quietest hours, darker colors show the busiest.
All the graphs can be customized as per choice to Bar, Line, Area, or Tabular form. Team Engagement Reports can be exported in the form of a PDF.