In this post, we’ve compiled the latest social media statistics from various trusted sources across the web. We’ve organized them into different categories, such as platform-specific stats, advertising data, and trends for 2025.
Top Social Media Statistics For 2025
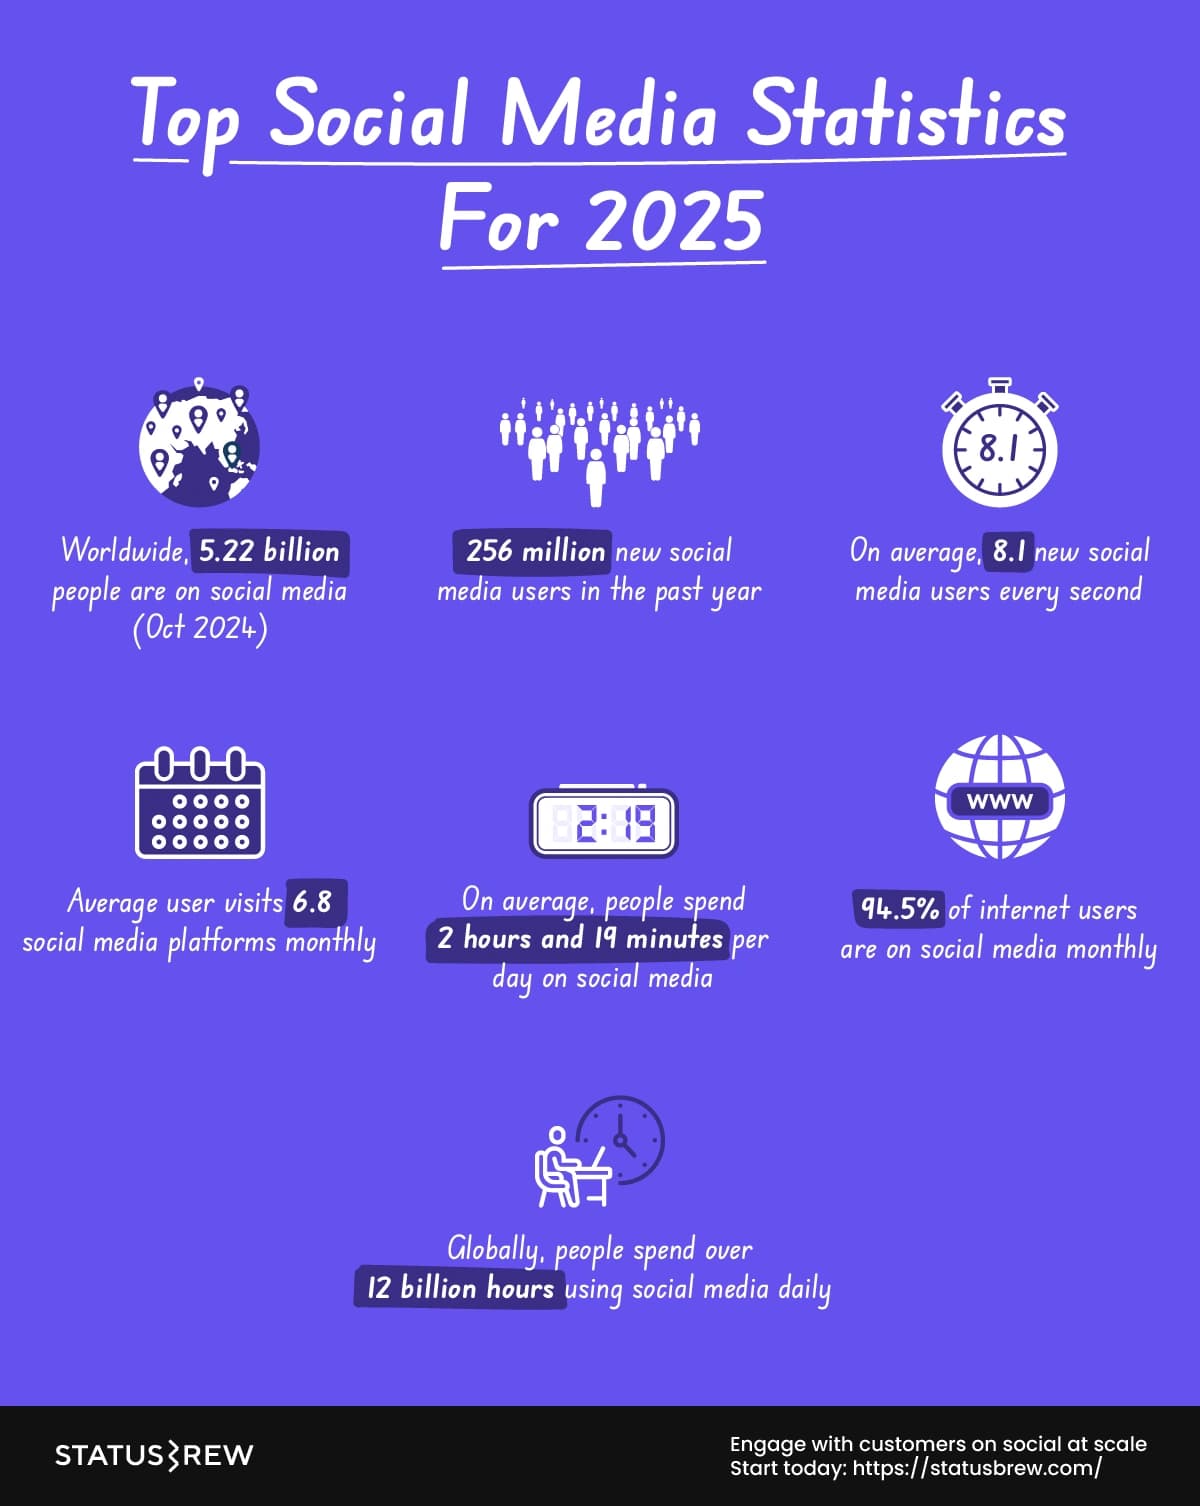
As of October 2024, there are 5.22 billion social media users worldwide, equating to 63.8% of the total global population.
Over the past year, 256 million new users joined social media, equating to an annualized growth of 5.2%.
This means that, on average, 8.1 new users joined social media every second.
94.5% of the world’s internet users now use social media each month.
The average social media user actively engages with or visits 6.8 different social platforms each month.
On average, people spend 2 hours and 19 minutes per day on social media, which accounts for approximately 14% of their waking lives (on the basis that most people sleep for between 7 and 8 hours per day).
Globally, people spend over 12 billion hours using social media platforms each day. This is equivalent to 1.38 million years of human existence every single day.
15 Most Popular Social Networks
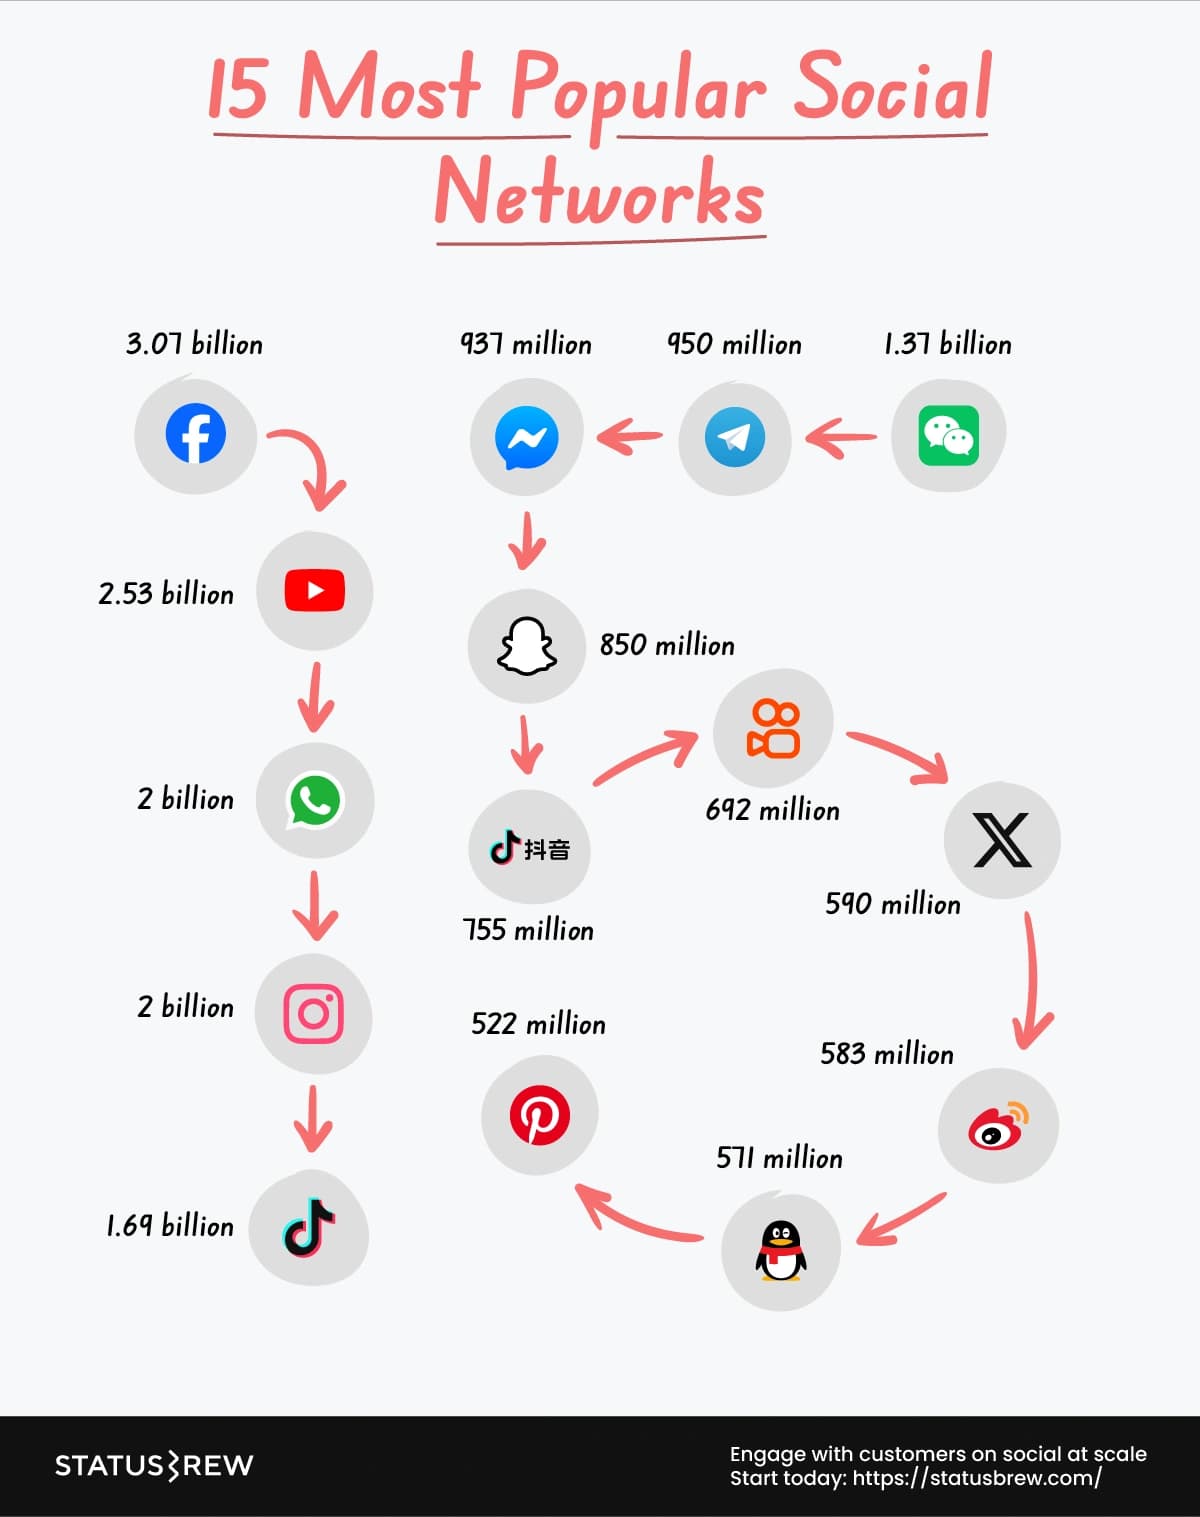
Here's a list of the popular social networks of October 2024, sorted based on the number of monthly active users (MAU):
Facebook: 3.07 billion
YouTube: 2.53 billion
Instagram: 2 billion
WhatsApp: 2 billion
TikTok: 1.69 billion
WeChat: 1.37 billion
Telegram: 950 million
Facebook Messenger: 937 million
Snapchat: 850 million
Douyin: 755 million
Kuaishou: 692 million
X (Twitter): 590 million
Weibo: 583 million
QQ: 571 million
Pinterest: 522 million
Facebook Statistics 2025
Facebook is the world’s most ‘active’ social media platform in 2024. (Source)
India has the largest number of Facebook users (378 million users). (Source)
Most Facebook users are male (56.3% of male users as compared to 43.7% female users). (Source)
The majority of Facebook users are between 25 and 34 years old (31.1%). (Source)
More than 2 billion people still use Facebook daily. (Source)
Facebook users spend almost 20 hours a month on the platform. (Source)
Only 1.5% of Facebook users say they access the platform through a desktop or laptop, while 81.8% use Facebook through their smartphones. (Source)
Facebook users spend 50% of their time watching videos.(Source)
More than 2 billion people watch videos on Facebook every month. (Source)
74% of non-skippable video ads on Facebook are watched all the way through. (Source)
72% of Facebook users still use the platform primarily to connect with their friends and family members. (Source)
54.3% of users follow and research brands on Facebook, and 59% of users have actively reached out to brands through Facebook.
More than 30% of adults access news from Facebook. (Source)
More than 200 million businesses use Meta apps every month to reach customers. (Source)
More than 91% of organizations have a Facebook presence. (Source)
62% of businesses are confident that Facebook marketing delivers a measurable ROI (Return on Investment). (Source)
Facebook’s Shop has reached around 64.6 million customers. (Source)
More than 19% of US customers start searching for products on Facebook. (Source)

Instagram Statistics 2025
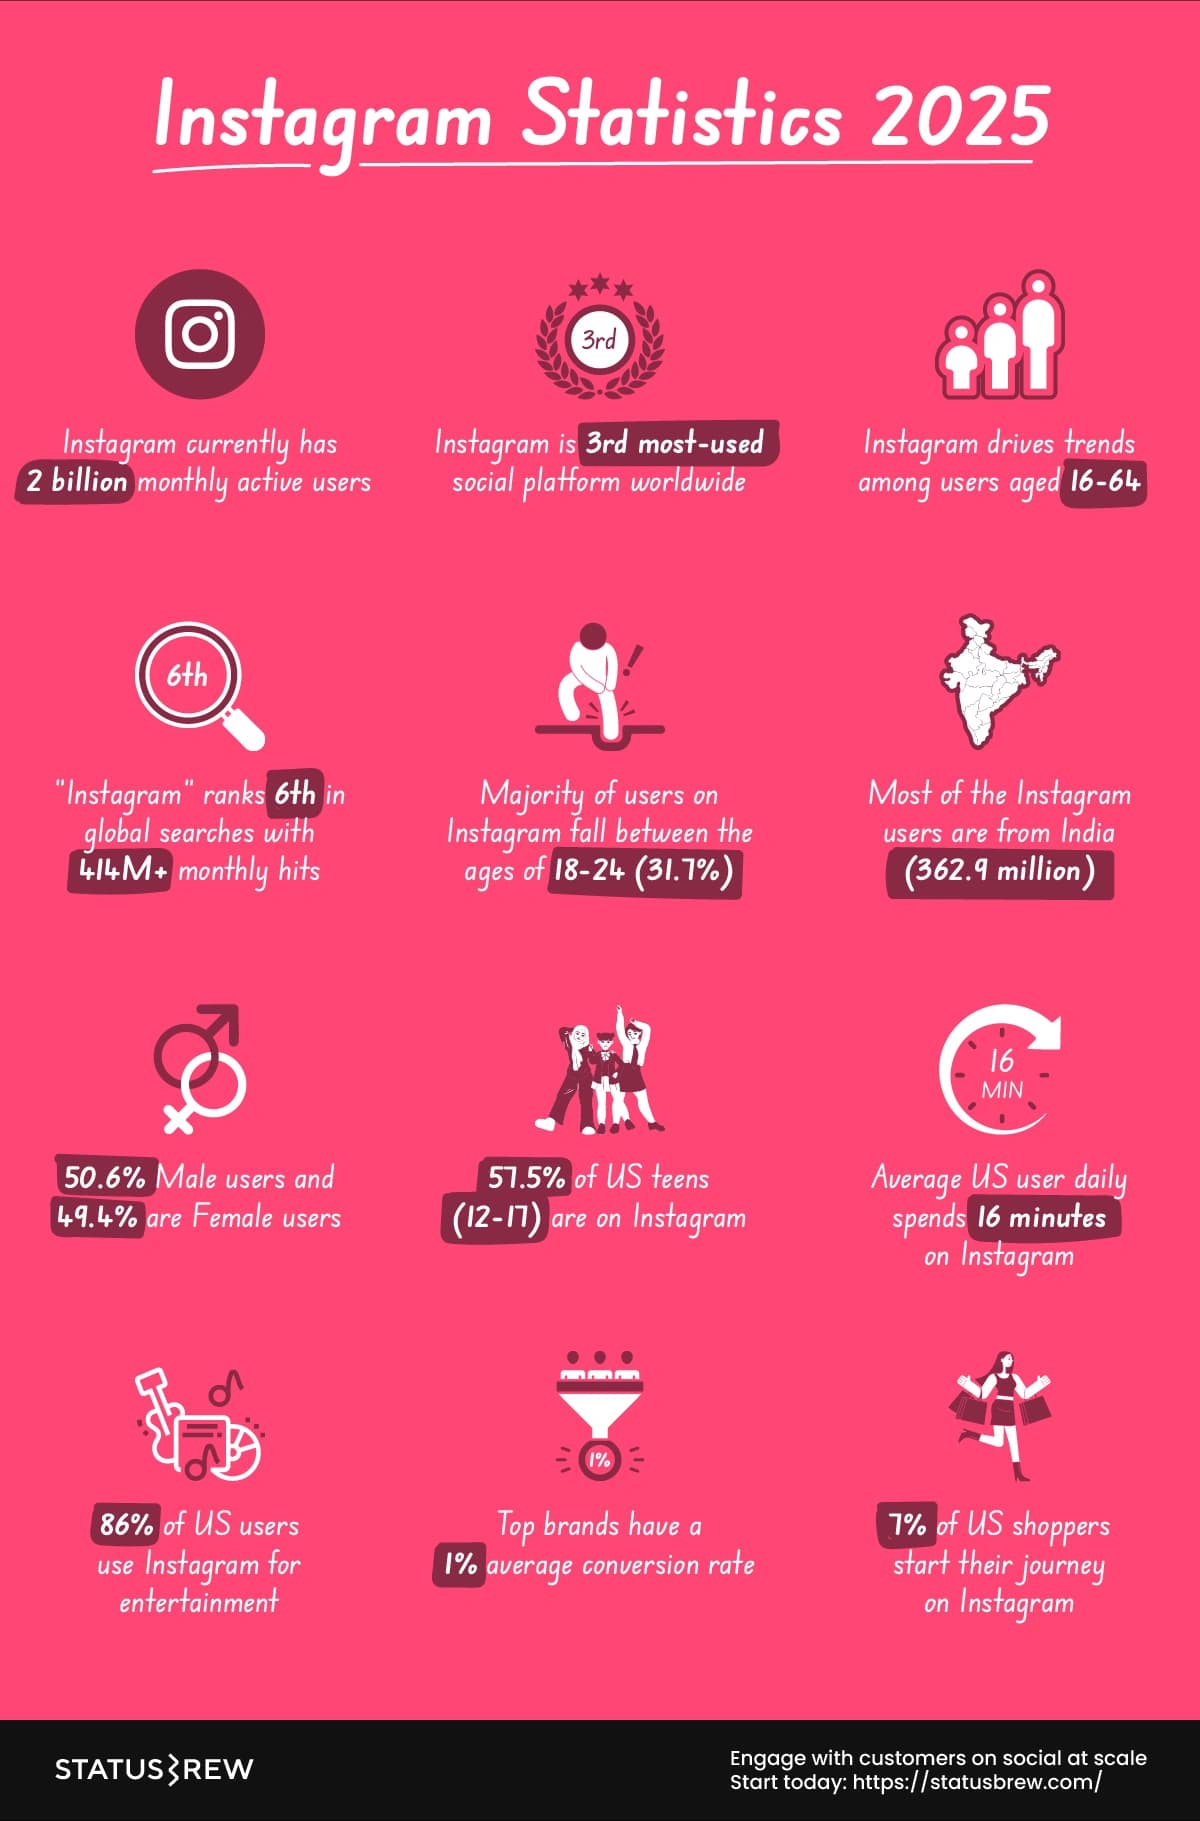
As of April 2024, Instagram has more than 2 billion monthly active users. (Source)
Instagram is the third most popular platform in terms of active users.
Instagram is the most likely platform to launch or inspire a new cultural trend, specifically among users in the 16 to 64 age group. (Source)
“Instagram” is the sixth most-searched term on Google, with over 414 million searches per month. (Source)
The biggest group of users on Instagram fall between the ages of 18-24 (31.7%). (Source)
As of January 2024, most Instagram users are from India (362.9 million). (Source)
As of January 2024, most Instagram users are Male (50.6%). (Source)
More than half of US residents (57.5%) aged 12-17 use Instagram. (Source)
The average US Instagram user spends about 16 minutes per day on Instagram. (Source)
86% of US Instagram users use the platform for entertainment. (Source)
According to Forbes, 36% of people use Instagram to search for information and brands. (Source)
7% of US customers start their shopping journeys on Instagram. (Source)
Globally, 41% of social media male users and 47% of female users have purchased a product from Instagram. (Source)
According to Forbes, 12% of customers search for fashion brands on Instagram. (Source)
Instagram has the third largest ad audience, reaching 1.68 billion users in July 2024. (Source)
The average CPC (Cost per Click) for an Instagram ad is between $0.40 to $0.70. (Source)
The average conversion rate for the top-performing brands on Instagram is 1%. (Source)
X Statistics 2025
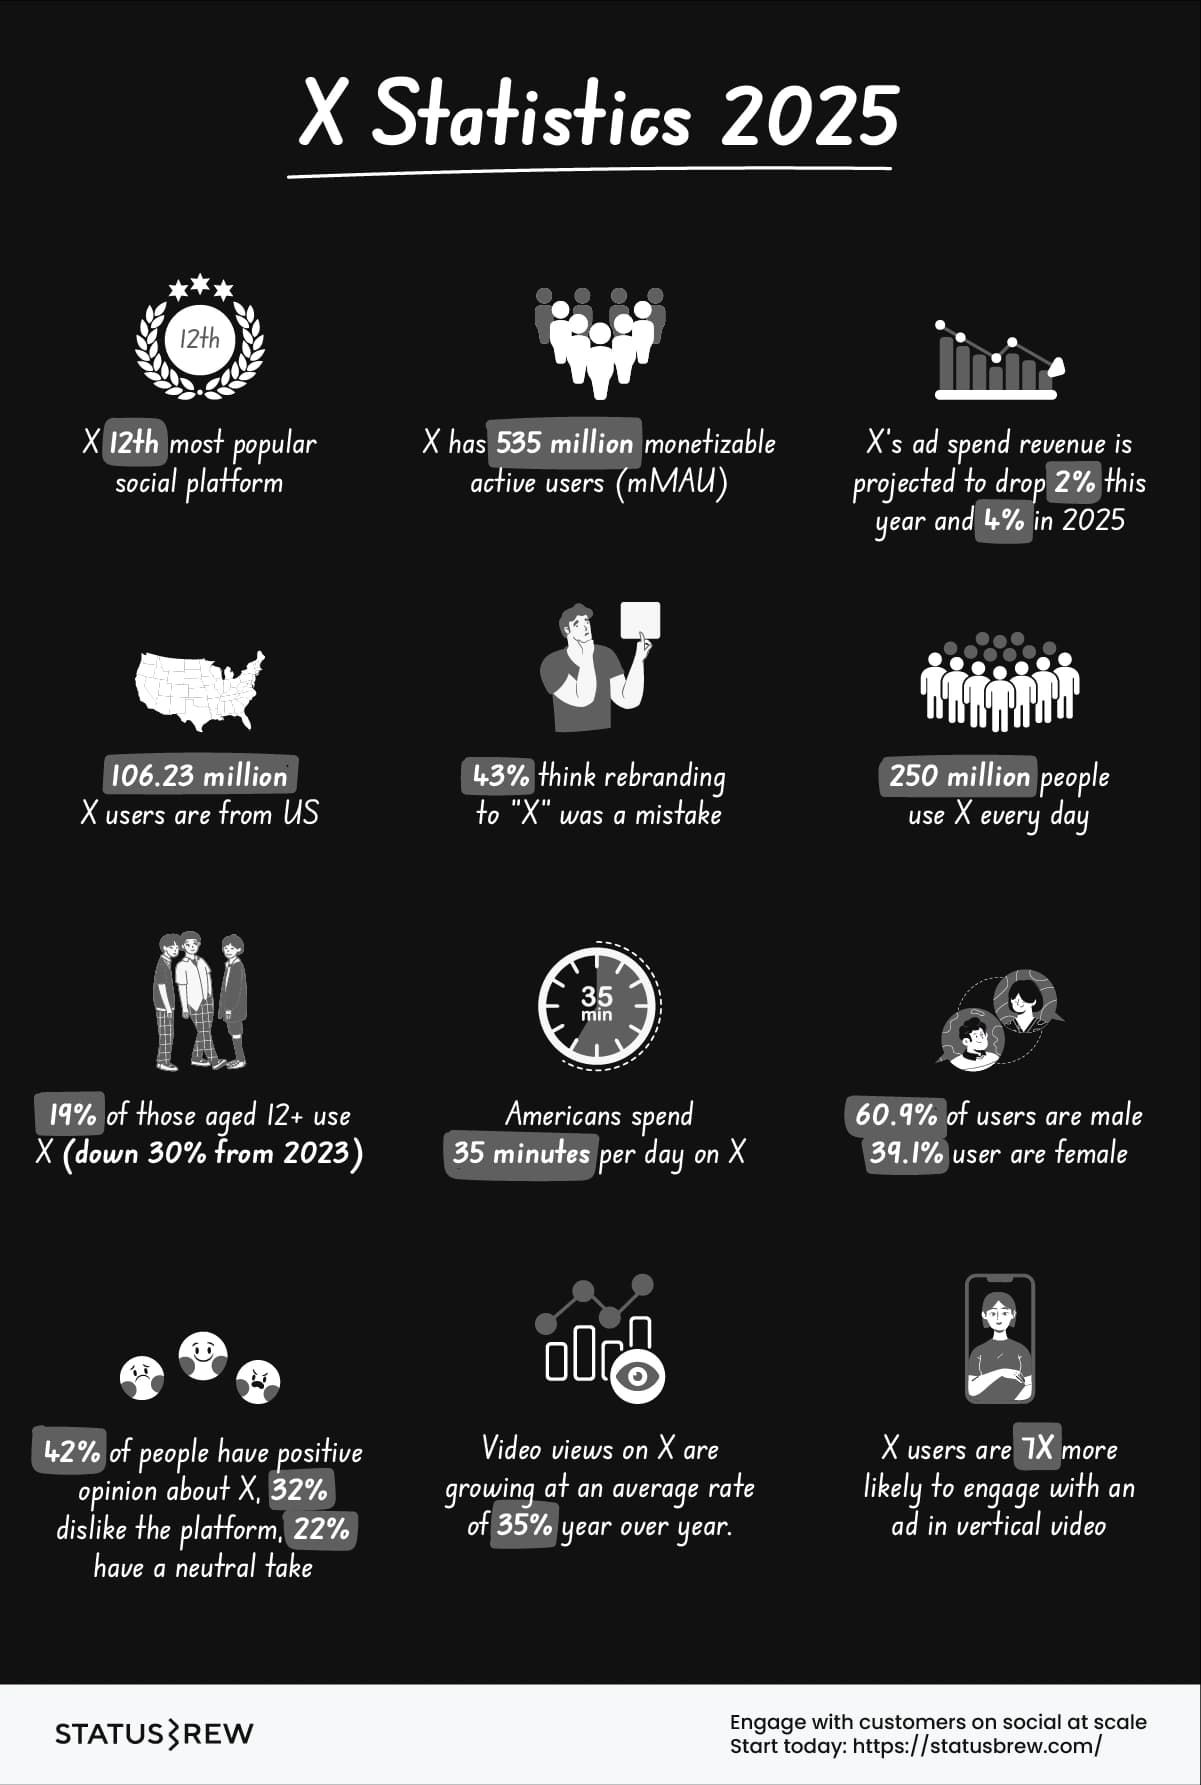
Twitter is the 12th most popular social network. (Source)
As of April 2024, Us has the largest number of Twitter users (106.23 million). (Source)
43% of Twitter users think that it’s a mistake to change Twitter’s name to “X.” (Source)
42% of people have positive opinion about X, 32% dislike the platform, with 22% have a neutral opinion. (Source)
250 million people use X every day (Source)
19% of those age 12+ are currently using X, a 30% drop from 2023. (Source)
Americans spend 35 minutes per day on X. (Source)
X has the largest gender gap of any social platform and is mostly male-dominated, making up 60.9% of their user base. (Source)
The global monetizable monthly active users (mMAU) of X is 535 million. (Source)
4 out of every 5 X user sessions include watching videos. Overall, video views on X are growing at an average rate of 35% year over year. (Source)
X users are 7X more likely to engage with an ad in vertical video compared to the same ad on the Home Timeline. (Source)
X’s ad spend revenue is projected to drop 2% this year and 4% in 2025. (Source)
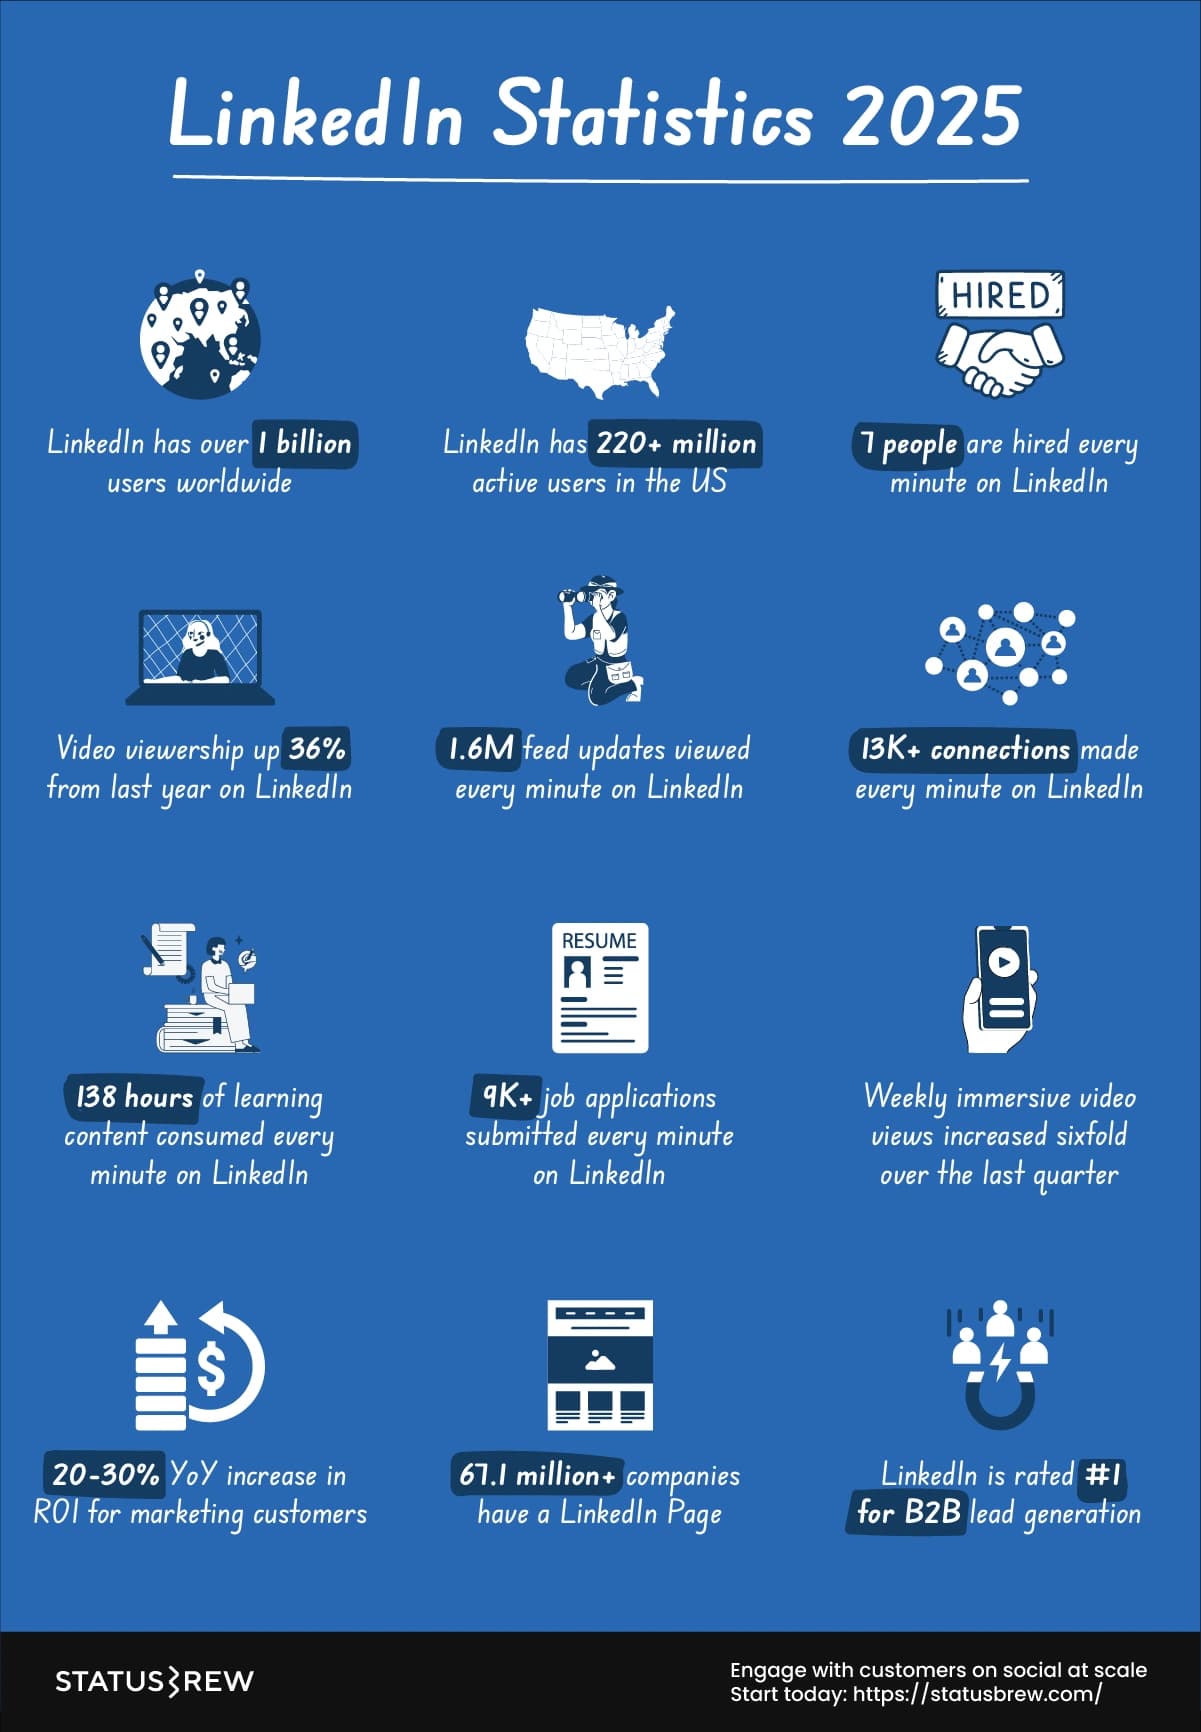
LinkedIn Statistics 2025
LinkedIn has over 1 billion users worldwide. (Source)
The United States has the largest number of active LinkedIn users, with over 220+ million users. (Source)
7 people are hired every minute on LinkedIn. (Source)
More than 9K users apply for jobs every minute on LinkedIn. (Source)
More than 1.6 million feed updates are viewed per minute on LinkedIn. (Source)
More than 13K connections are made per minute on LinkedIn. (Source)
Approximately 138 hours of learning content is consumed every minute on LinkedIn. (Source)
Video is growing quickly on LinkedIn, with viewership increasing by 36% compared to last year. (Source)
Weekly immersive video views have grown six times over the last quarter. (Source)
Brands have seen a 33% increase in purchase intent from ad exposure on LinkedIn. (Source)
40% of B2B marketers say LinkedIn is the most effective channel for driving high-quality leads. (Source)
Marketers see up to 2x higher conversion rates on LinkedIn. (Source)
Audiences exposed to brand and acquisition messages on LinkedIn are 6x more likely to convert. (Source)
ROI for marketing customers has improved 20-30% YoY in the past fiscal year. (Source)
Approximately 67.1 million companies and organizations have a Page on LinkedIn. (Source)
LinkedIn was rated the #1 platform for B2B lead generation. (Source)
Brands see a 2–3x lift in brand attributes when advertising on LinkedIn. (Source)
YouTube Statistics 2025
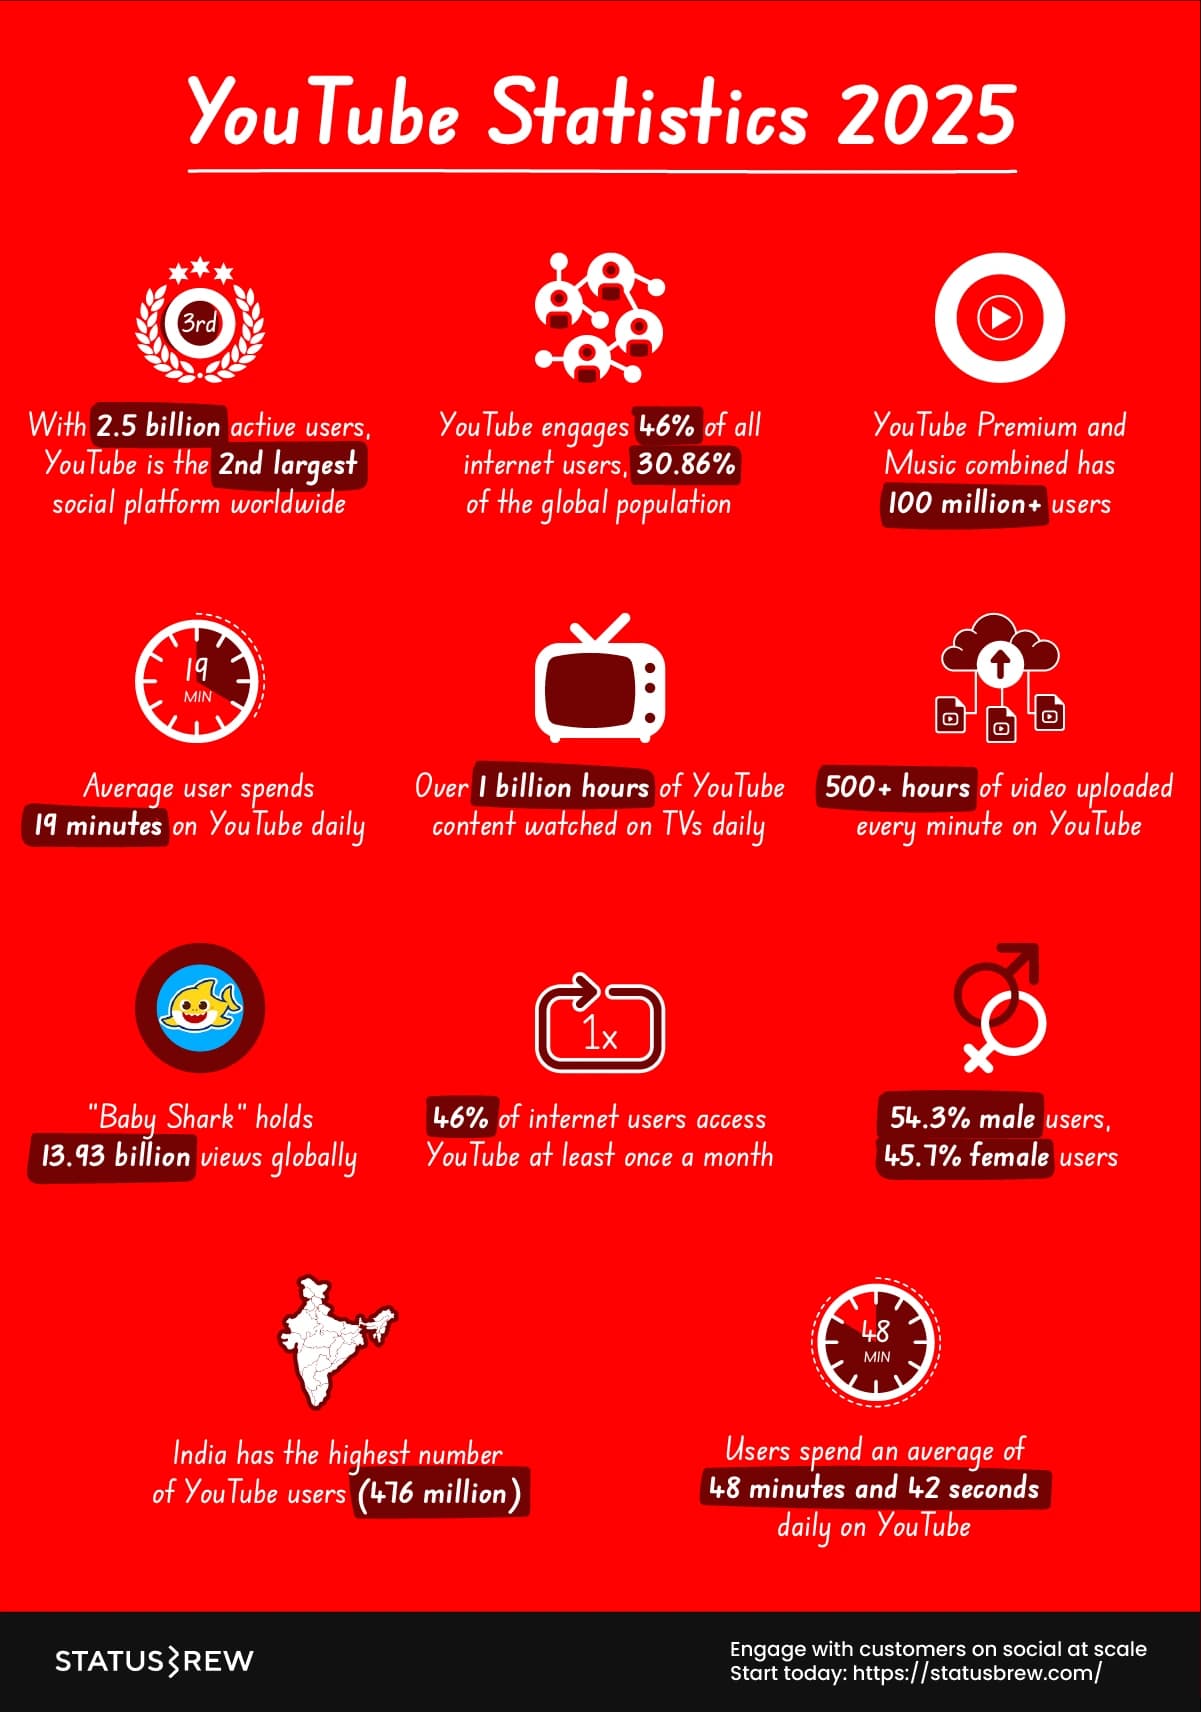
YouTube is the second biggest social media worldwide, with over 2.5 billion active users.
As of July 2024, India has the highest number of YouTube users (476 million) (Source)
YouTube Music and YouTube Premium together have more than 100 million subscribers. (Source)
The average daily time spent on YouTube is 19 minutes. (Source)
Viewers globally watch more than 1 billion hours on average of YouTube content on their TVs every day. (Source)
Over 500 hours of videos are uploaded every minute on YouTube. (Source)
“Baby Shark” is the most viewed video on YouTube, with 13.93 billion global views. (Source)
46% of internet users access YouTube at least once a month. (Source)
YouTube engages 46% of all internet users worldwide. (Source)
YouTube’s user base accounts for about 30.86% of the global population. (Source)
54.3% of YouTube users worldwide are men, and 45.7% are female. (Source)
Users spent an average of 48 minutes and 42 seconds on YouTube. (Source)
Pinterest Statistics 2025
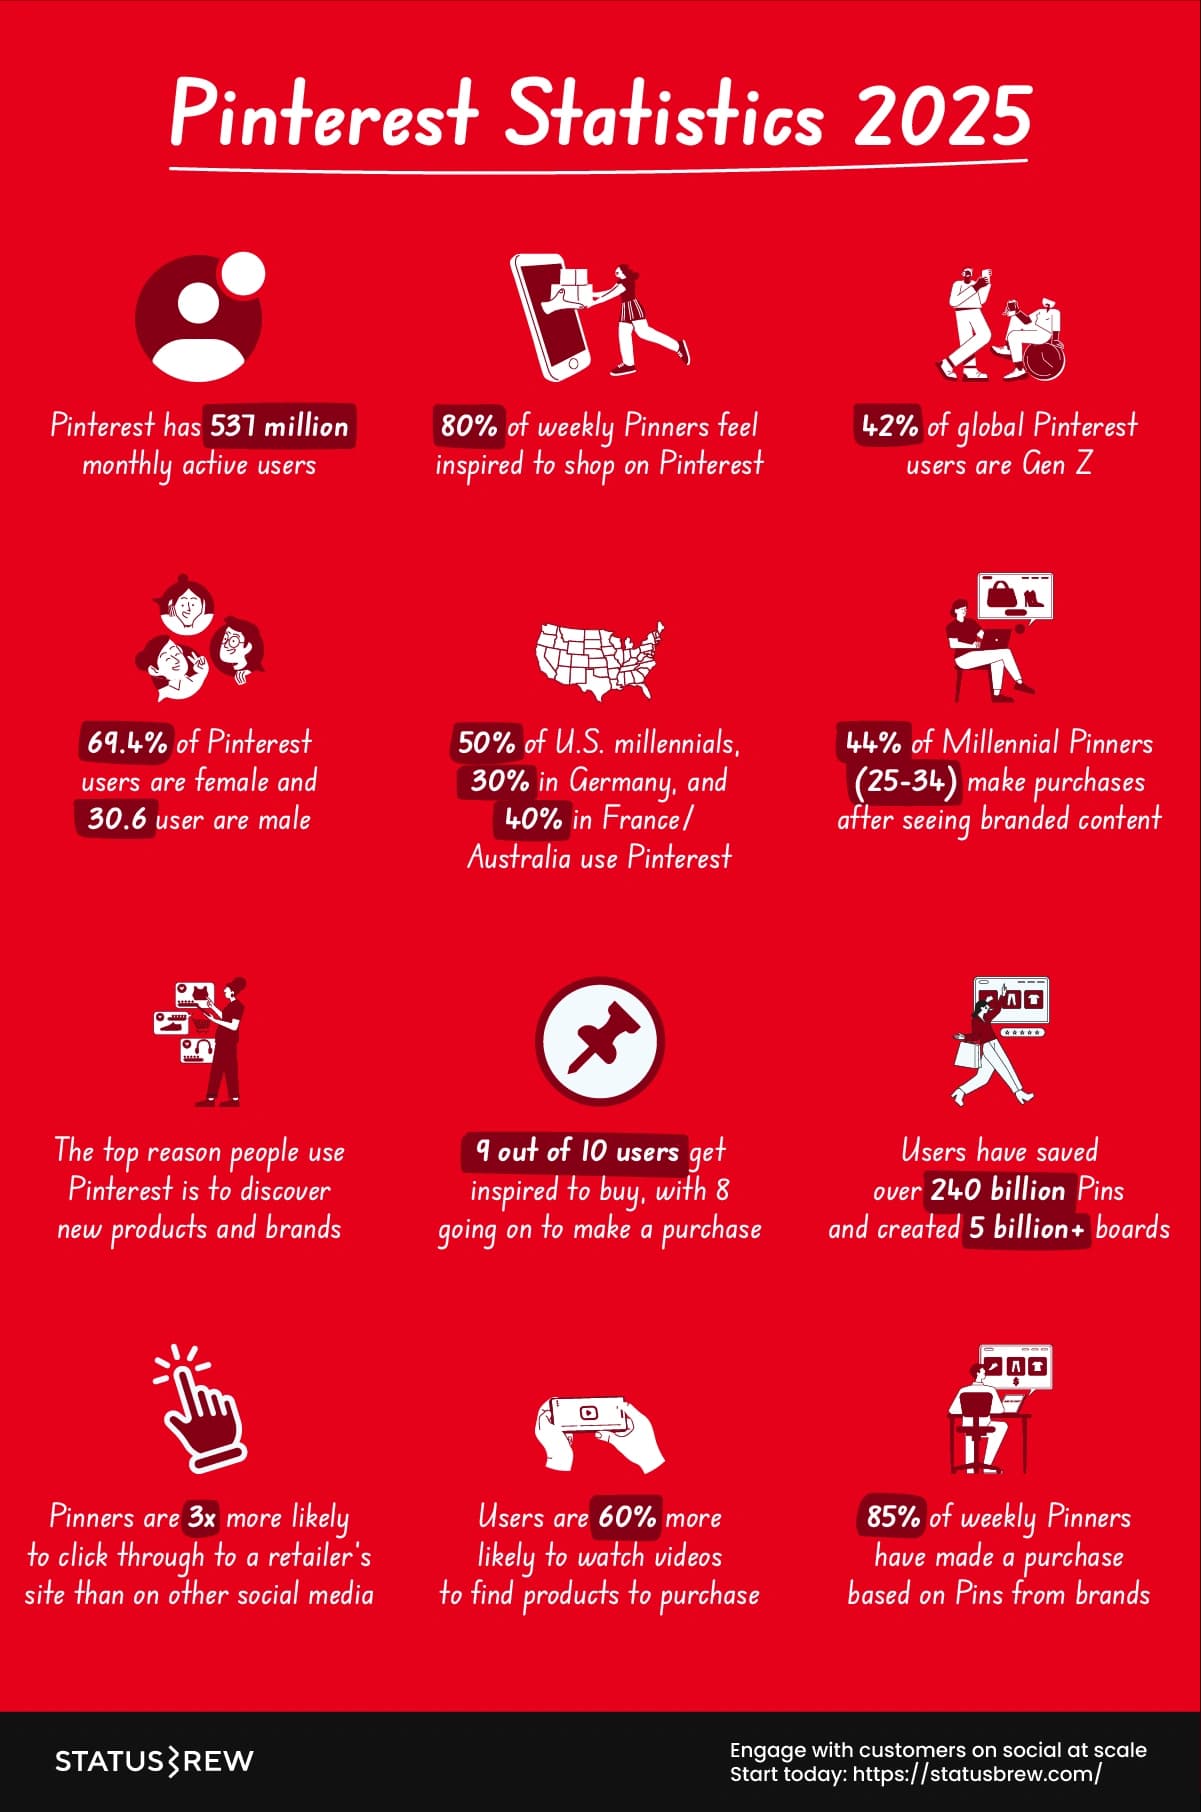
Pinterest has 537 million monthly active users. (Source)
80% of weekly Pinners feel inspired by the shopping experience on Pinterest. (Source)
Gen Z is Pinterest’s fastest-growing audience, making up 42% of their global user base. (Source)
As of April 2024, 69.4% of total Pinterest users are female. (Source)
44% of Millennial Pinners (age 25-34) have made a purchase as a result of seeing branded content on Pinterest. (Source)
The No. 1 reason people use Pinterest is to find new products and brands. (Source)
9 out of 10 people use Pinterest to get inspired about things to buy, 8 of whom end up doing so. (Source)
Users on Pinterest have saved over 240 billion Pins and created more than 5 billion boards to date. (Source)
>25% of time on Pinterest is spent shopping—higher than on any social media platform. (Source)
Pinners are almost 3x more likely to click through to a retailer’s site from Pinterest than from other social media. (Source)
People on Pinterest are about 60% more likely to view videos to find a product to purchase. (Source)
It takes half as many impressions to convert someone on Pinterest as on other platforms. (Source)
50% of U.S. millennials, about 30% of millennials in Germany, and almost 40% of millennials in France and Australia are on Pinterest. (Source)
Almost 80% of millennial women in the U.S., over 60% in Australia, and about 50% in Canada are on Pinterest. (Source)
85% of weekly Pinners have bought something based on Pins they see from brands. (Source)
WhatsApp Statistics 2025
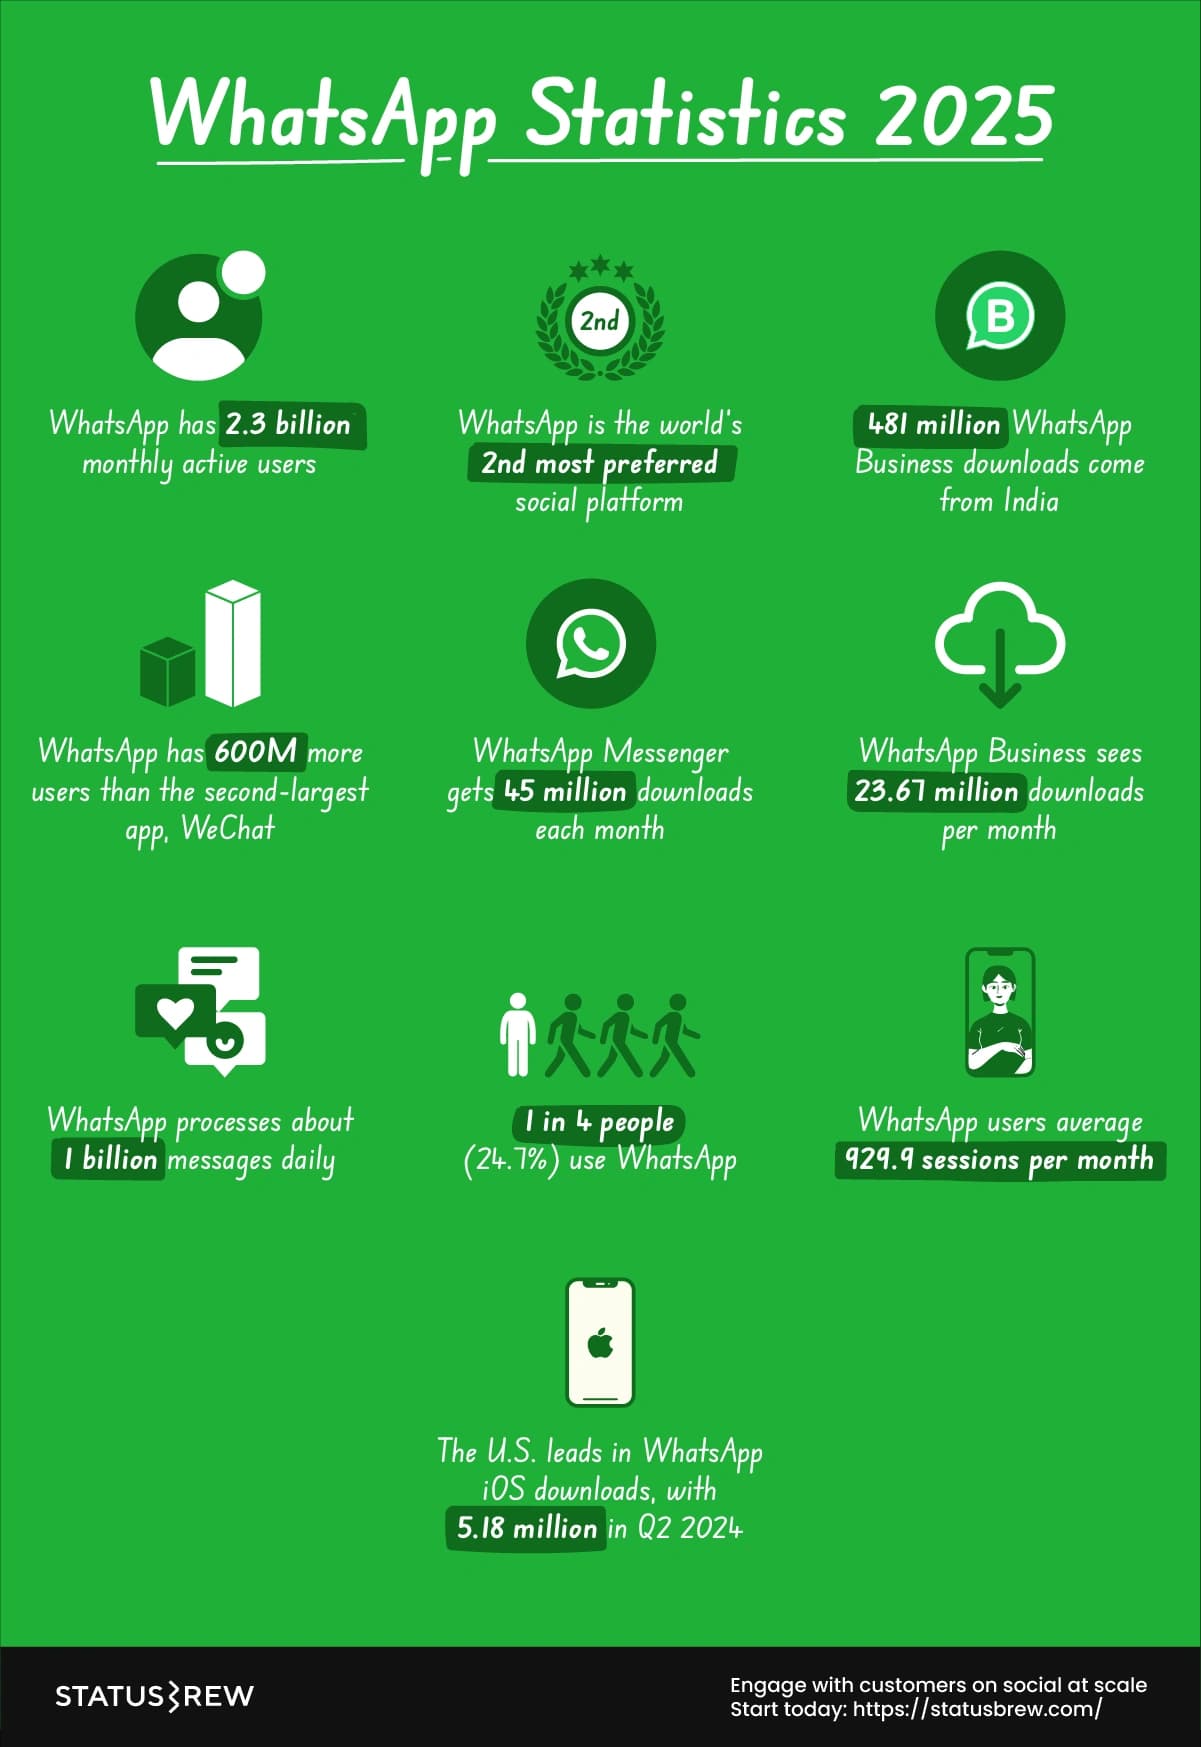
WhatsApp now has roughly 2.30 billion global monthly active users. (Source)
WhatsApp is the world’s second most preferred social medium today. (Source)
As of February 2024, most of the WhatsApp Business downloads came from India (481 million). (Source)
WhatsApp is the most popular messaging app, with approx 2 billion monthly users, over 600 million more than the second most popular messenger app, WeChat (1.34 billion). (Source)
WhatsApp Messenger has over 45 million downloads per month. (Source)
WhatsApp Business (23.67 million) has half as many downloads as WhatsApp Messenger. (Source)
WhatsApp delivers approximately 1 billion messages daily. (Source)
Around 1 in 4 people (24.7%) now use WhatsApp. (Source)
On average, WhatsApp users partake in 929.9 app sessions per month. (Source)
The US is the leading country in terms of Whats App iOS downloads (5.18 million). It had over 2x more downloads than any other nation in Q2 2024. (Source)
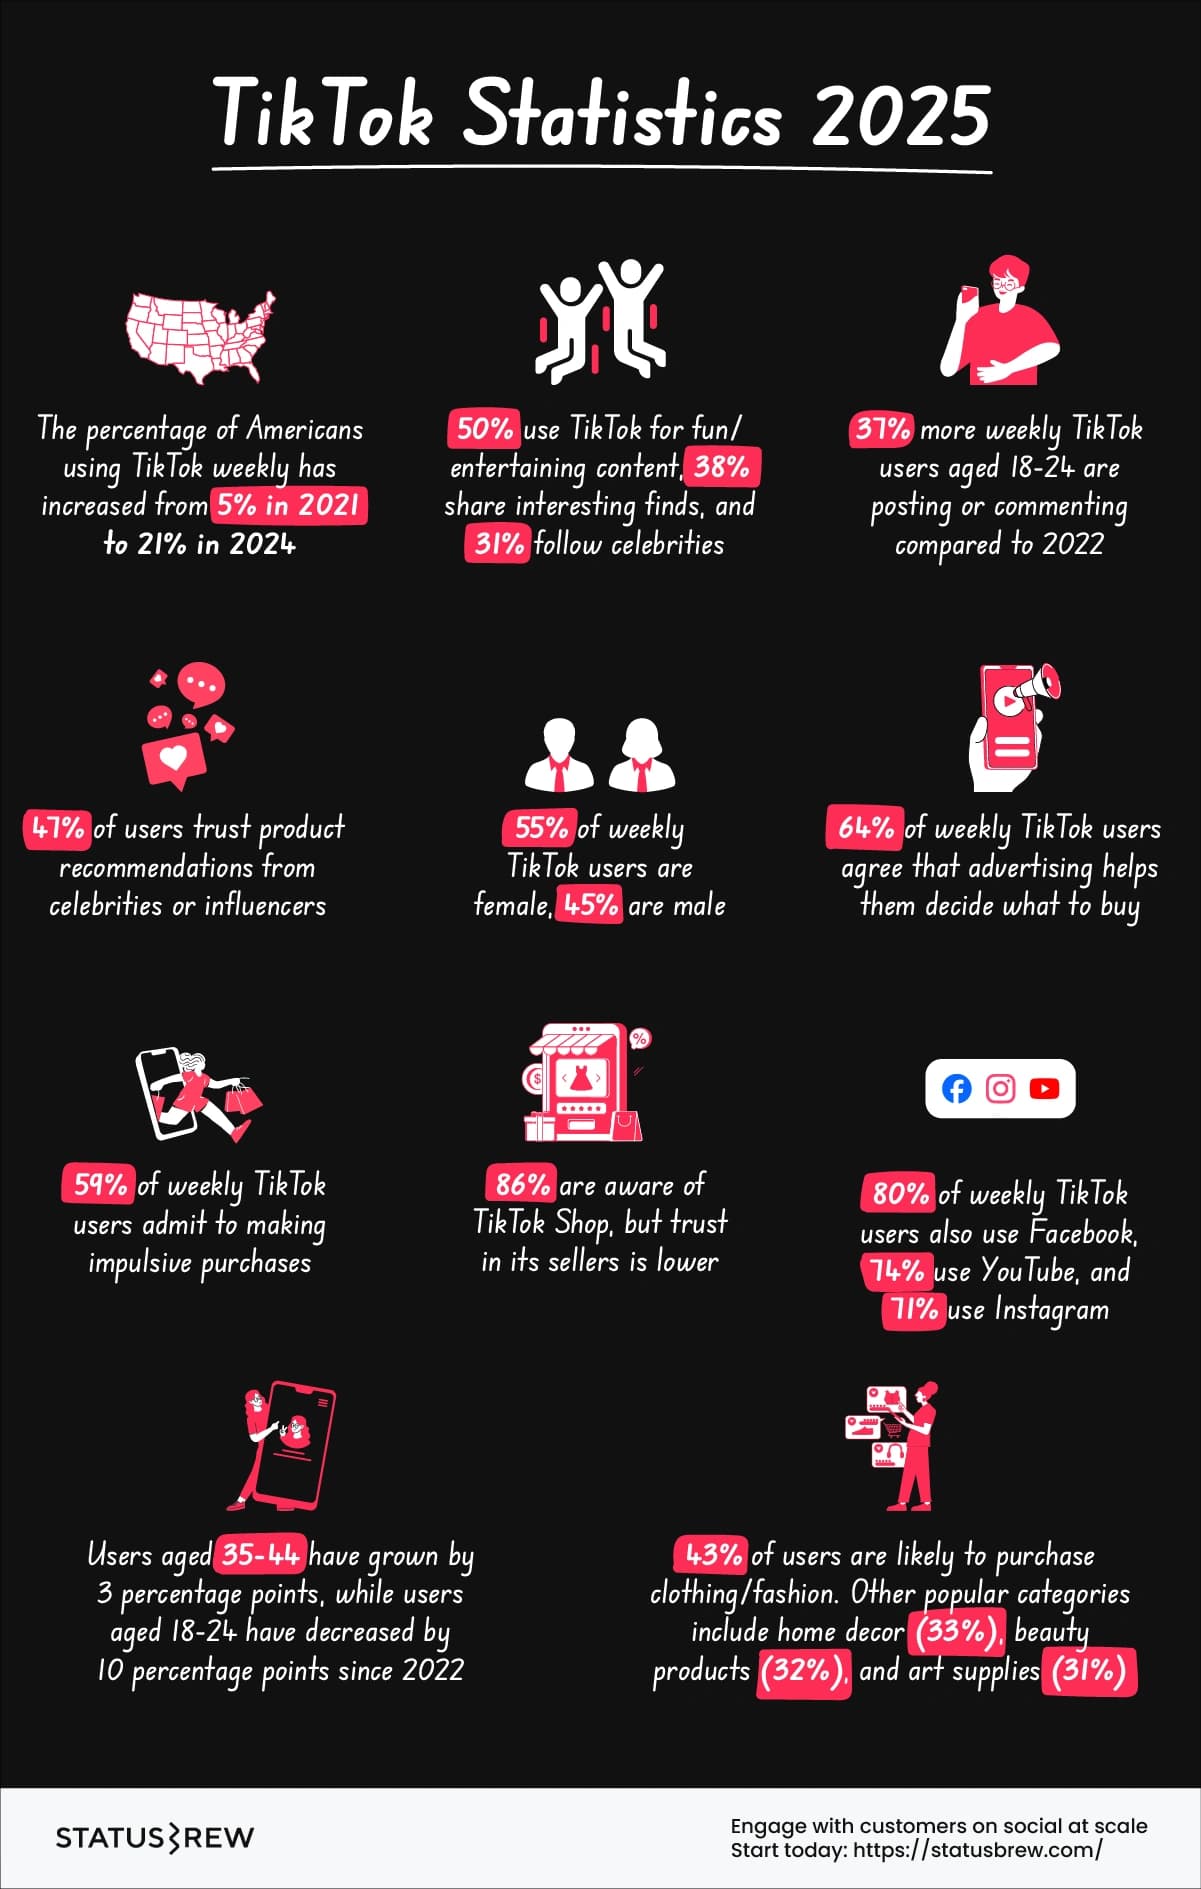
TikTok Statistics 2025
The percentage of Americans using TikTok weekly has quadrupled since 2021, rising from 5% in 2021 to 21% in 2024. (Source)
Weekly TikTok users aged 35-44 have grown by 3 percentage points since 2022, while users aged 18-24 have decreased by 10 percentage points. (Source)
Significantly more weekly TikTok users aged 18-24 post or comment than in 2022, with a 37-percentage-point increase. (Source)
50% use TikTok to watch fun or entertaining content, 38% use it to share things they find interesting, and 31% use it to keep up with celebrities. (Source)
55% of weekly TikTok users are female, and the rest are male (45%). (Source)
64% of weekly TikTok users agree that advertising helps them choose what to buy. (Source)
59% of weekly TikTok users agree they tend to make impulsive purchases. (Source)
86% of TikTok users are aware of TikTok Shop, though significantly fewer trust its sellers.
43% of users are likely to purchase clothing or fashion. (Source)
Home decor (33%), beauty products (32%), and art supplies (31%) follow as popular categories. (Source)
80% of weekly TikTok users also use Facebook, 74% use YouTube, and 71% use Instagram. (Source)
47% of weekly TikTok users trust product recommendations by celebrities or influencers. (Source)
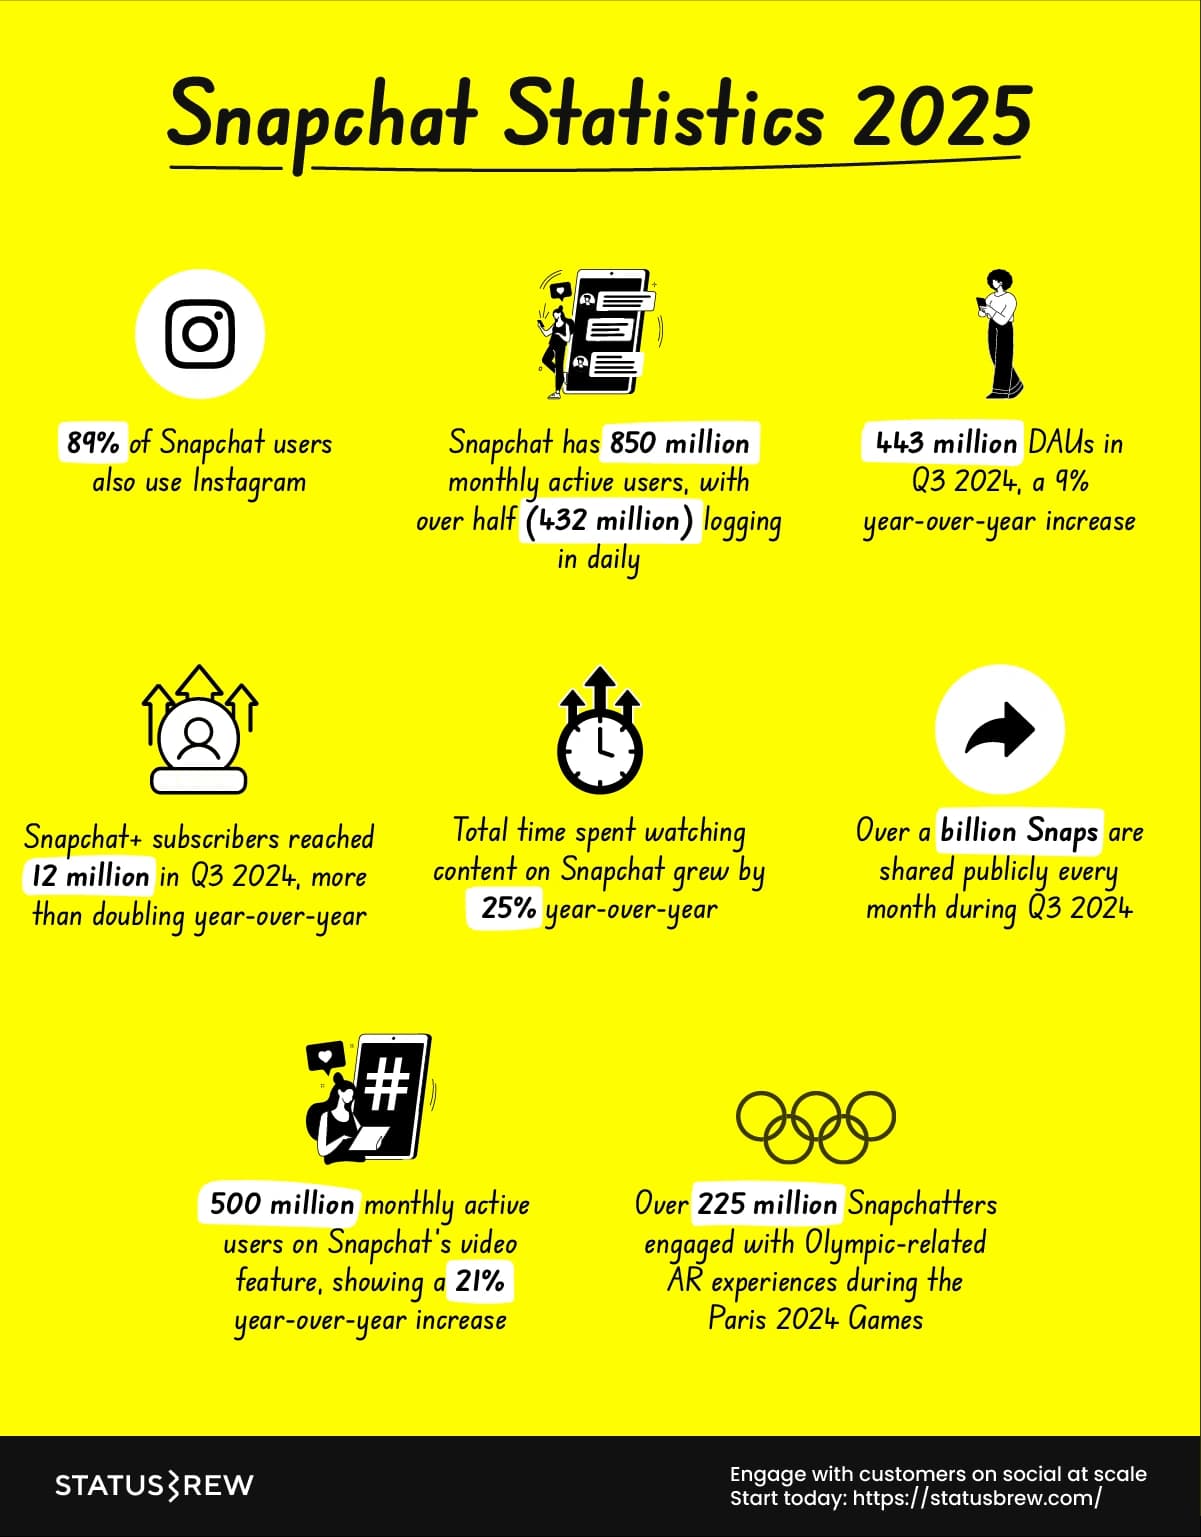
Snapchat Statistics 2025
89 percent of Snapchat users also use Instagram. (Source)
Snapchat revealed that it now has 850 million monthly active users and more than half of those users (432 million) log in every day. (Source)
Snapchat’s daily active users (DAUs) were 443 million globally in Q3 2024, a 9% year-over-year increase. (Source)
Snapchat's video feature had 500 million monthly active users, a 21% year-over-year increase. (Source)
Total time spent watching content on Snapchat increased by 25% year-over-year. (Source)
Over a billion Snaps were shared publicly every month during Q3 2024. (Source)
Snapchat+ subscribers reached 12 million in Q3 2024, more than doubling year-over-year. (Source)
Over 225 million Snapchatters engaged with Olympic-related AR experiences during the Paris 2024 Games. (Source)
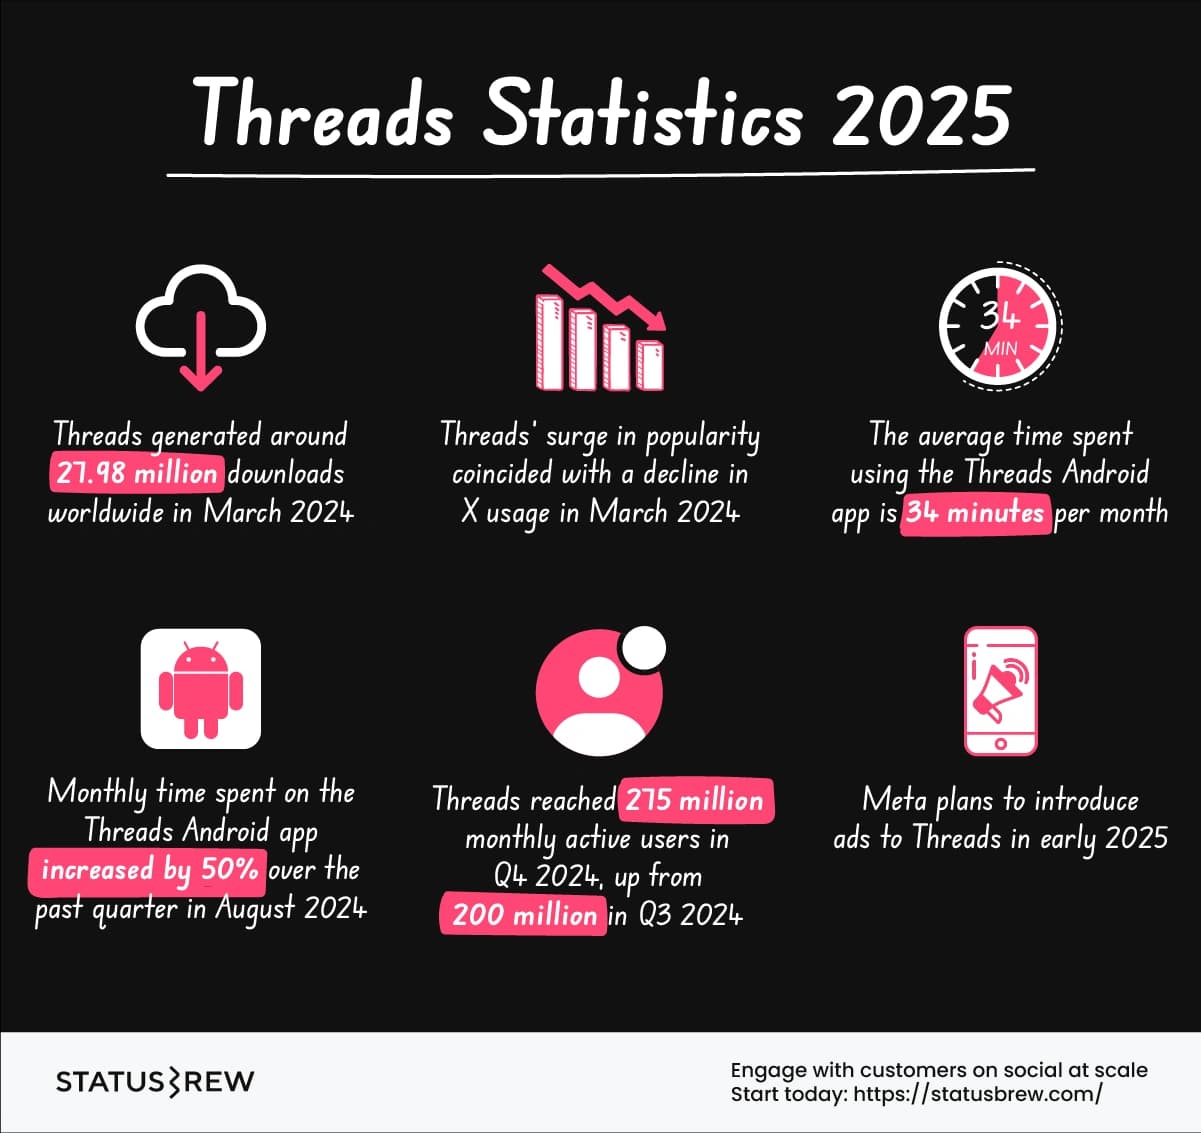
Threads Statistics 2025
In March 2024, Threads generated around 27.98 million downloads worldwide. (Source)
As of the fourth quarter of 2024, Meta's Threads had 275 million monthly active users, up from 200 million MAU in the third quarter of 2024. (Source)
The average time that each user spends using the Threads Android app is 34 minutes per month. (Source)
The monthly time spent using the Threads Android app has increased by roughly 50 percent over the past quarter in August 2024. (Source)
Despite its growing popularity, Threads is still only a very small part of Meta’s social empire. (Source)
Meta is preparing to introduce ads to Threads in early 2025. (Source)
X usage declined in March 2024 as downloads of Threads surged. (Source)
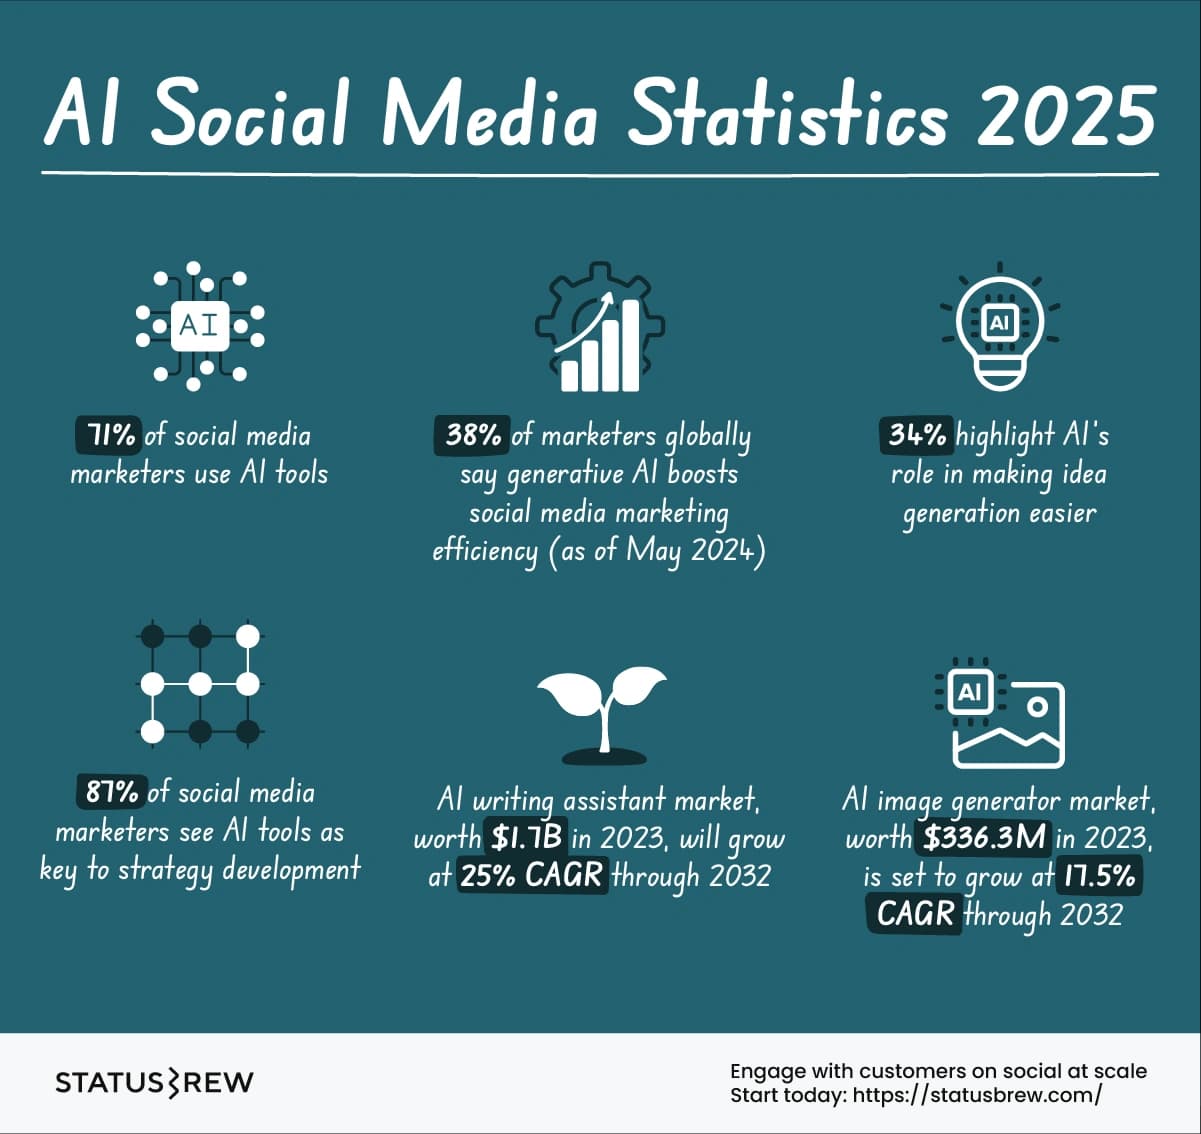
AI Social Media Statistics 2025
71% of social media marketers use AI tools. (Source)
As of May 2024, nearly 4 in 10 marketers worldwide (38%) say generative AI boosts social media marketing efficiency, while 34% highlight easier idea generation. (Source)
Percentage of social marketers that used AI applications for the following social media activities in 2024:
Edit and refine text: 77%
Produce text from scratch: 80%
Develop new ideas: 67%
Generate images: 41%
Completely revise and rewrite text: 72%
Edit and modify images: 37%
87% of social media marketers state that the use of AI tools will play an important role in developing a social media strategy. (Source)
The global AI market for writing assistant software was valued at $1.7 billion in 2023 and is estimated to grow at a CAGR of over 25% from 2024 to 2032, due to the rising demand for content creation. (Source)
AI image generator market size was valued at $336.3 million in 2023 and is projected to grow at a CAGR of over 17.5% from 2024 to 2032. (Source)
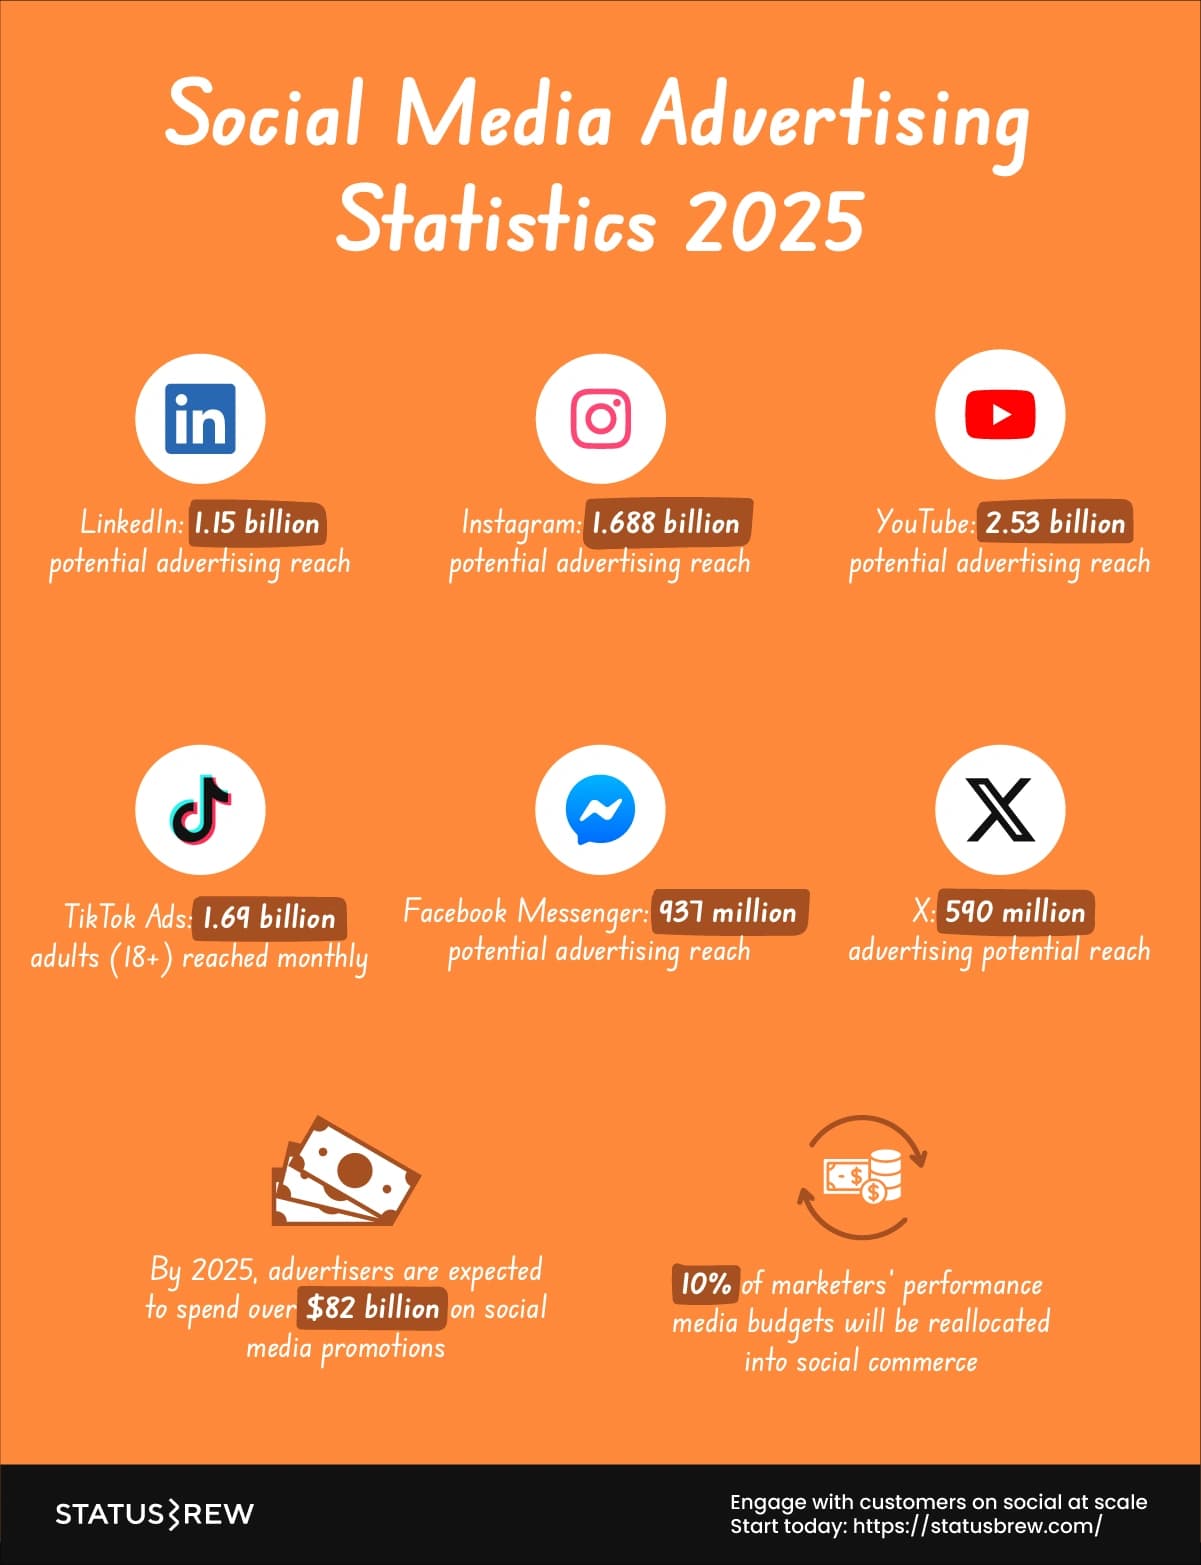
Social Media Advertising Statistics 2025
By 2025, advertisers are expected to spend over 82 billion dollars on promoting their products on social networks. (Source)
Marketers will shift 10% of their performance media budgets into social commerce. (Source)
YouTube has the largest social media advertising audience. YouTube’s potential advertising reach is 2.53 billion. (Source)
TikTok ads can potentially reach 1.69 billion adults over the age of 18 each month. (Source)
Facebook Messenger’s potential advertising reach is 937 million. (Source)
X (Twitter)’s reported potential advertising reach sits at 590 million. (Source)
LinkedIn reports a global ad reach of 1.15 billion. (Source)
Instagram’s reported ad audience total of 1.688 billion. (Source)
Social Media Engagement Statistics 2025
Comments between 10 and 99 characters drive the most engagement; anything more or anything less, including emoji-only comments, is a total bust. (Source)
Engagements decrease dramatically if you comment on an original post that’s more than 24 hours old. (Source)
Engagements are 1.6x higher when the original creator replies to your comment. (Source)
Nano- and micro-influencers (those with between 1k and 50k followers) are the most responsive. (Source)
Creators’ comment sections could soon become oversaturated with brands competing for attention. And creators will get choosy with their replies, avoiding ones that could compromise their authenticity and credibility. (Source)
In 2025, as more brands take a stab at proactive engagements, the most strategic ones will go beyond the comments section (and even beyond social media) to build genuine relationships with creators and influencers as a prerequisite to building successful outbound engagement strategies. (Source)
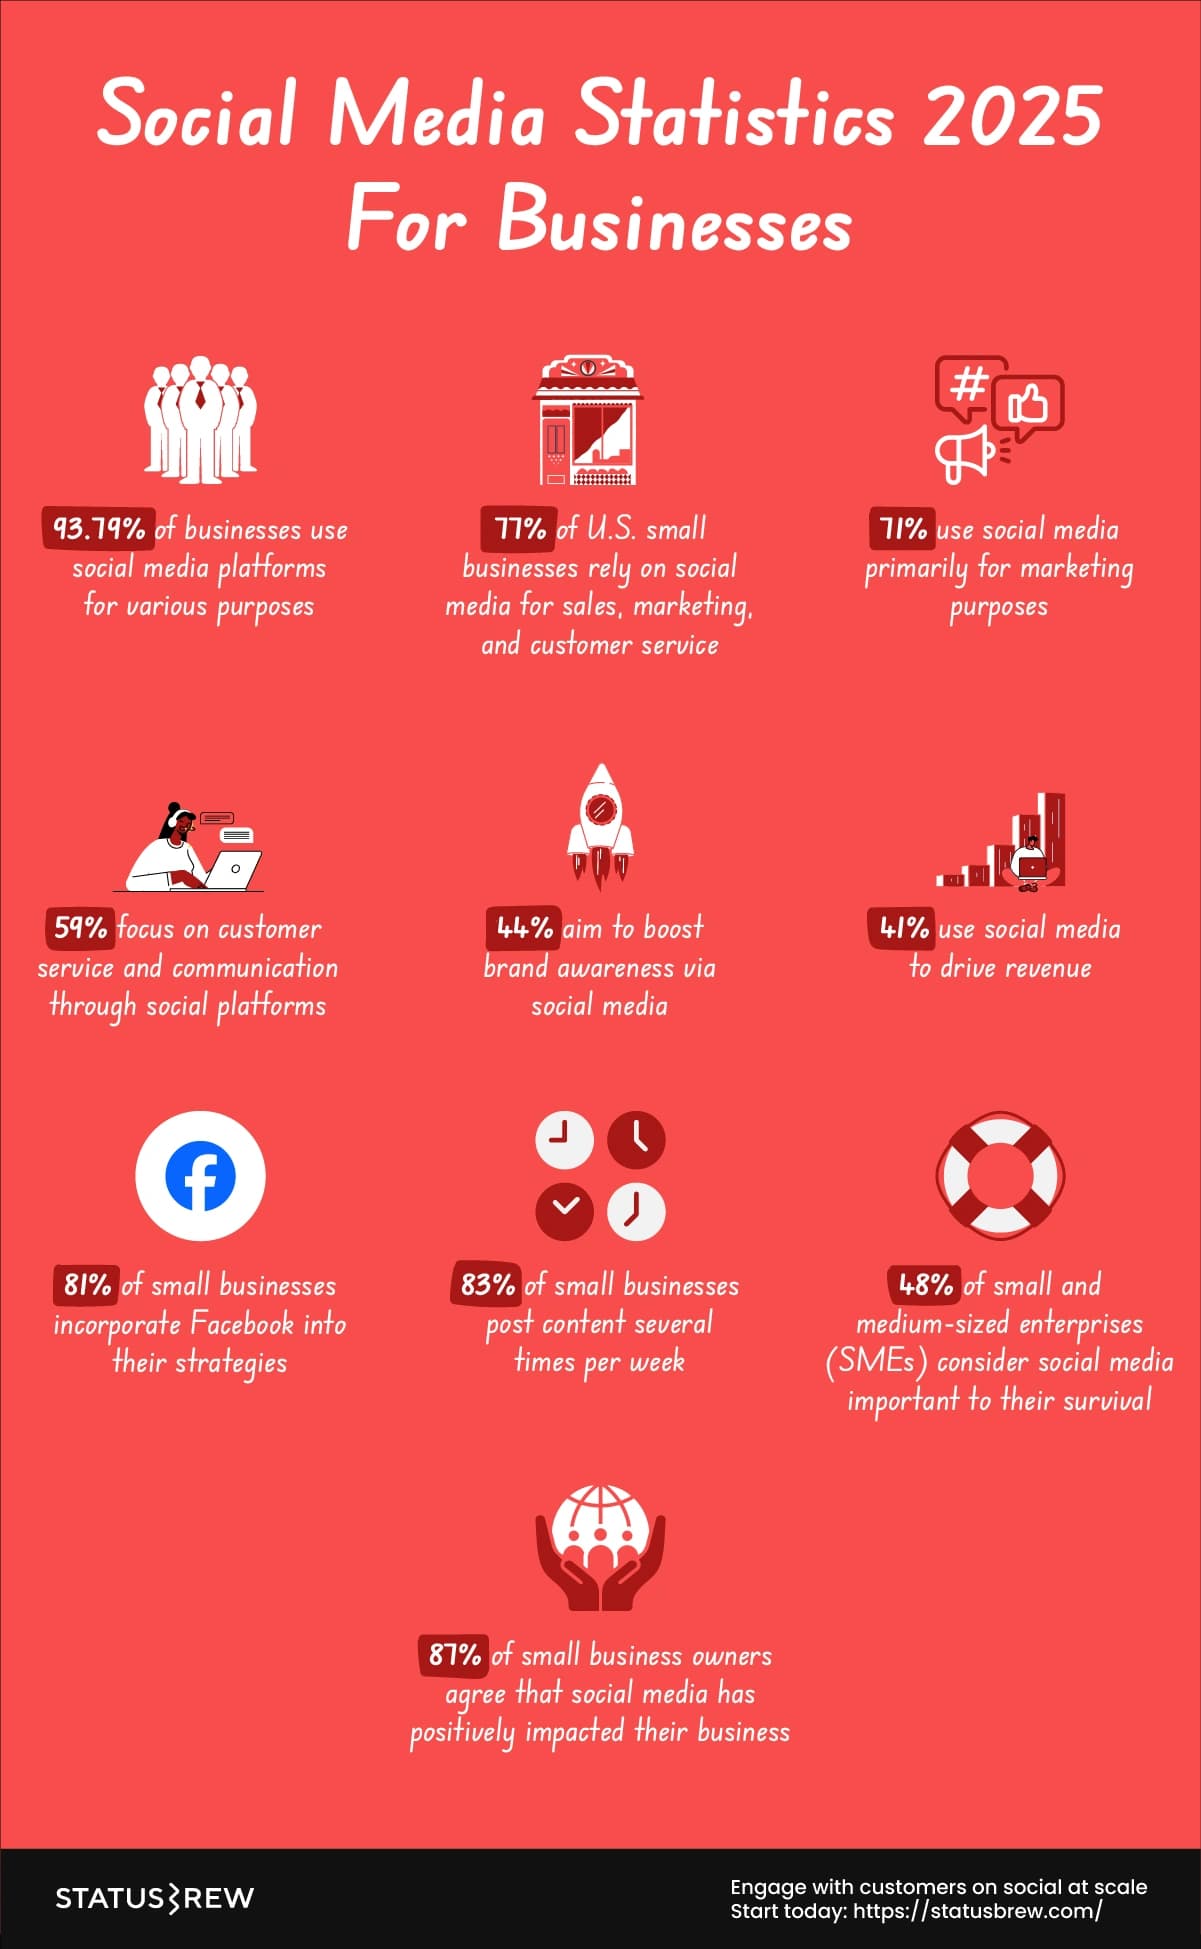
Social Media Statistics 2025 For Businesses
93.79% of businesses use social media platforms. (Source)
77% of U.S. small businesses rely on social media for sales, marketing, and customer service. (Source)
71% of small businesses use it primarily for marketing purposes. (Source)
59% of small businesses focus on customer service and communication through social platforms. (Source)
44% of small businesses aim to boost brand awareness via social media. (Source)
41% of small businesses use social media to drive revenue. (Source)
81% of small businesses use Facebook into their strategies. (Source)
83% of small businesses post content several times per week. (Source)
48% of small and medium-sized enterprises (SMEs) consider social media important to their survival. (Source)
87% of small business owners agree that social media has positively impacted their business. (Source)
Social Media Predictions For 2025
Instagram will remain a top priority for marketers, with 44% of respondents planning to focus on it as their main platform. Meanwhile, LinkedIn (20%) will be a strong contender for professional networking, followed by TikTok (18%) for its entertainment value and YouTube (11%) for long-form video content. (Source)
Short-form video (60 seconds or less) dominates, with 47% of marketers focusing on it. (Source)
Brands will reduce reliance on memes, especially those with legal risks, as audiences prefer authenticity over trend-chasing. (Source)
AI will optimize workflows, provide predictive data, and accelerate content production, but authentic, human-driven content will stand out. (Source)
Brands must integrate social media into their core strategies to remain relevant and use its cultural influence to build long-term connections. (Source)
AI-recommended Reels will flood feeds as Meta leans heavily into video for engagement growth. (Source)
Expect advanced AI-driven ad targeting, using in-app performance data to better predict user behavior and clicks on Meta. (Source)
LinkedIn will invest in business-focused live streams and video events as video engagement continues to grow. (Source)
TikTok will double down on live-stream shopping and interactive avatar-based commerce. (Source)
Final Thoughts
We hope the social media statistics and trends in this post will help you build an even stronger social media strategy in 2025.